


 Servicios personalizados
 Inglés (pdf)
 Articulo en XML
 Referencias del artículo
 Enviar articulo por email
 Citado por SciELO
  Citado por Google
  Similares en
SciELO
Similares en
SciELO  Similares en Google
 Permalink
INTRODUCTION
The homeostatic mechanisms regulating food intake rely on a neuroendocrine system that involves peripheral and central signaling. The peripheral gastrointestinal signs consist of a series of peptides that are produced in response to food intake and modulate hunger and satiety 1. There is growing evidence to suggest that glucagon-like peptide-1 (GLP-1) is one of the mediators of the post-meal satiety response. The main mechanism of satiety exerted by GLP-1 is related to the "ileal brake", which slows down gastric emptying 2,3,4. Previous studies have shown that peripheral GLP-1 infusion increases satiety and reduces hunger in a dose-dependent way 3. The underlying mechanisms of action combine slow gastric emptying with direct effects on central nervous system 2. However, these effects are impaired in the obesity and individuals with obesity exhibit attenuated postprandial GLP-1 secretion in comparison to normal-weight controls, which may harms food intake regulation 5,6,7).
Importantly, most studies evaluating the role of GLP-1 in hunger and satiety have employed peripheral infusion of this hormone, which elevates the serum GLP-1 levels to supraphysiological values, and in these conditions it increases satiety and reduces hunger and energy intake in the short term 8,9,10. However, gaps in the knowledge of the role of this hormone in appetite modulation in a physiological way, that is, secondary to food intake, still exist, especially in obesity.
In contrast, whether glucose-dependent insulinotropic polypeptide (GIP) has a role in appetite modulation remains unclear. Raben et al. (1994) 11 showed that a higher postprandial GIP response to a high-fat meal were seen in women after weight loss compared to normal-weight controls, and the authors suggest that GIP may promote hunger and excessive food intake. Other studies have founded that postprandial GIP response was inversely related to the subsequent feeling of satiety 5,12,13. On the other hand, positive 14 or neutral 9,10,15 correlation between postprandial GIP and satiety were also observed.
Added to this, evidences in animal studies suggests the involvement of the TG, which are markedly elevated after a high-fat meal, in stimulate hypothalamic peptides known to increase feeding (16,17,18,19, and the hyperphagia after a high-fat meal is preceded by a marked increase in circulating TG levels 19.
In this context, the primary aim of the present study was to compare the response of GLP-1 and GIP and the ad libitum energy intake to a standardized high-fat test meal in women with obesity classified according to the change in plasma TG after this meal. We also wanted to examine the relationship between postprandial GLP-1, GIP and TG responses with subjective appetite regulation (hunger and satiety) and ad libitum energy intake.
MATERIALS AND METHODS
STUDY DESIGN AND SUBJECTS
This is a transversal clinical study. Thirty three women with obesity (BMI 30.0-39.9 kg.m-2) between the ages of 20 and 45 years were recruited by posters in public places, e-mail and radio programs. None of the subjects used oral hypoglycemic agents, contraceptives and/or hormones, or anti-psychotic with drugs (washout of 3 months); had been diagnosed with diabetes mellitus, hypertriglyceridemia, thyroid dysfunction, hormone disorders; infections diseases or eating disorders; did not like the foods used in the study (bread, margarine, cheese, whole milk, pasta, tomato sauce and ground meat); had undergone nutritional monitoring during the previous 3 months; were pregnant or nursing or were in a menopausal period.
To compare the role of change in circulating TG after a high-fat meal in the postprandial response of GLP-1 and GIP and the ad libitum energy intake, women were classified in two groups according to their TG response after this meal. The median was used as a cutoff point of the postprandial change in TG levels: ∆TG in % = (TG at 180 min-TG at 0 min) x 100 / TG at 0 min. Group ∆TG ≤ median were called "Low TG change - LTG" and ∆TG > median, "High TG change -HTG".
The study was approved by the Research Ethics Committee of University of São Paulo, Ribeirão Preto Medical School (process number 4618/2009). The patients received 2 consent forms for signature, one before and the other after the study. Only after the study the women were informed that ad libitum food intake would be quantified, thus preventing them from being influenced by this information regarding the amount of food to be consumed.
HIGH-FAT MEAL
On each test day, patients arrived in the research unit in the morning after a 12 h overnight fast. A standardized, fixed energy high-fat breakfast (50 g of french bread with 15 g of margarine and 20 g of cheese and 150 ml whole milk; energy 414 kcal with 50% calories from fat, 35% from carbohydrates and 15% from protein) was then served, and they were instructed to eat all the food offered. Previous studies with high-fat meals also used this same percentage of energy from fat 20,21. Our aim with the high-fat meal was to elicit a sharp rise in the TG levels and stimulate physiological GIP and GLP-1 secretion 22,23.
AD LIBITUM ENERGY INTAKE
The ad libitum meal (lunch) were offered three hours after breakfast and consisted of pasta bolognese. The preparation of the pasta and sauce was standardized and rigorously applied on each day of administration. Each ad libitum meal consisted of 1,900 g (energy density 1.22 kcal.g-1) in order to make participants eat to their satisfaction, without being concerned about food availability and also to avoid variations in the quantity of food offered to each individual, which could interfere in the food intake. Each individual ate alone with no time restriction. The quantity of pasta consumed was evaluated by the difference between the starting amount and the leftovers on the pan and the plate.
BIOCHEMICAL ANALYSES
Venous blood was drawn through an indwelling antecubital cannula into syringes. Blood was collected into tubes containing sodium fluoride and EDTA for the analysis of plasma glucose concentrations, in tubes containing clot activator and gel separator for insulin and TG, and in tubes containing EDTA and anti-DPP-IV protease inhibitor (10 µL.mL-1 of blood) for the GIP and GLP-1. All blood samples were kept in ice until centrifugation at 3500rpm for 15 minutes at 4 oC, and serum and plasma samples were stored at -70 °C until analysis.
The analyses were performed at 0 (fasting), 30, 60, 90, 120, 150, and 180 min (this latter period was considered as preprandial, because it occurred before the ad libitum meal). The times selected for analysis of the postprandial curve of GIP and GLP-1 were adapted from the methodology proposed by Verdich et al. (2001) 5, which were also similar to the times used in other studies that described/evaluated postprandial curves of these hormones 24,25.
Total GIP and GLP-1 were determined by the Luminex(tm) xMAP methodology, by means of the kit GIP and GLP-1-HGT-68k (Millipore(r)); sensitivities were 0.2 and 5.2 pg.mL-1, respectively, and the CV values were 3.7 and 8.7%, respectively. TG was quantified by the endpoint enzymatic method, by employing the kit Triglycerides Liquiform (Labtest(r)); sensitivity and CV were 0.99 mg.dL-1and ≤ 5%, respectively.
Glucose was analyzed by the endpoint photometric method (Glucose PAP Liquiform), with the aid of the kit Glucose PAP Liquiform (Labtest(r)); the sensitivity and the coefficient of variation (CV) were 0.32 mg.dL-1 and 3.0%, respectively. Insulin was determined by the Luminex(tm) xMAP methodology, using the kit insulin-HGT-68K (Millipore(r)); sensitivity and CV were 1.1 µU.mL-1 and 7.3%, respectively. TG was quantified by the endpoint enzymatic method, by employing the kit Triglycerides Liquiform (Labtest(r)); sensitivity and CV were 0.99 mg.dL-1 and ≤ 5%, respectively.
ASSESSMENT OF HUNGER, SATIETY, PREFERENCE AND PALATABILITY
Previously validated 100-mm visual analogue scales (VAS) were used to assess hunger ("How hungry do you feel now?") and satiety ("How full/satisfied do you feel now?") 26. The participants were asked to fill in VAS before breakfast (0 min) and 30, 60, 90, 120, 150 and 180 min after the end of this meal (the same times when biochemical analyses were accomplished).
Moreover, after meal, the participants were asked to fill in 100-mm VAS to evaluate preference ("How much do you like pasta bolognese?") and meal palatability ("How tasty are this pasta?").
SAMPLE CHARACTERIZATION
ANTHROPOMETRIC AND BODY COMPOSITION ANALYSIS
Body weight (kg) and height (m) were measured to calculate the body mass index (BMI, in kg.m-2). Body composition (fat mass and fat free mass) was evaluated by bioelectric impedance analysis (Biodynamics 450 Bioimpedance Analyzer). These measures were taken at the beginning of the study, in a fasting state.
STATISTICAL ANALYSIS
The linear regression model with mixed effects (random and fixed effects) was employed to evaluate the differences in biochemical parameters and appetite between the groups at each time, as well as the difference between times within the same group. This methodology assumes that the residues have normal distribution, with mean 0 and constant variance σ². When this assumption was not verified, the response variable was transformed with the aid of the software SAS(r)9.0 and PROC MIXED. The orthogonal contrasts post-test aided the comparisons. The comparisons for orthogonal contrasts do not include adjustments for multiple testing. To study the variation between the groups of variables measured along time, the trapezium rule was employed to estimate the area under the curve (AUCtotal and AUCincremental) for each participant. To compare the variables of quantitative characterization (anthropometric and body composition data, ad libitum energy intake and biochemical and appetite variables in fasting) between the groups, non-parametric Mann-Whitney test was applied for independent samples. The correlations were determined by Spearman correlation coefficient. The level of significance was set at 5% (p < 0.05).
RESULTS
SUBJECT CHARACTERISTICS
There were no significant differences between the groups HTG and LTG for any anthropometric variables or fasting levels of biochemical parameters and appetite scores (Table I).

TRIGLYCERIDES (TG) AND POSTPRANDIAL INCRETIN RESPONSES (GIP AND GLP-1)
In HTG group (n = 16), the TG levels significant change from baseline at 60 min (p < 0.01) and remained at this level up to 180min. In contrast, for LTG group (n = 17), TG levels did not increase significantly as compared with basal levels at any of the evaluated times. The ∆TG (%) was higher in the HTG group compared to LTG group (78.8 ± 44.4% vs. 16.7 ± 18.4%, p < 0.01).
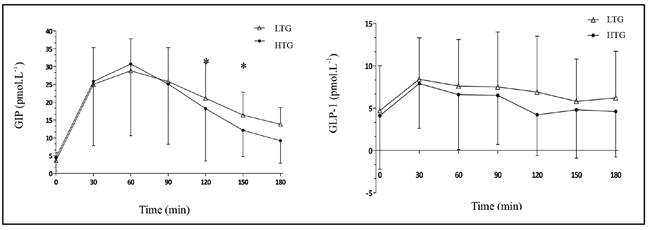
In the HTG group, the AUCincrementalGIP was significant lower when compared with LTG group (2423 ± 1979 pmol.L.min-1 vs. 2809 ± 1042 pmol.L.min-1, respectively, p = 0.03) and AUCtotalGIP also presented trend to be lower in this group (p = 0.08) (Table II). GIP was also significantly lower in HTG group at 150 min (16.4 ± 6.4 pmol.L-1 x 12.1 ± 7.3 pmol.L-1, p = 0.03) and at 180 min (13.8 ± 4.7 pmol.L-1 vs. 9.2 ± 6.3 pmol.L-1, p < 0.01) (Fig. 1).
The AUCtotalGLP-1 were similar between groups (Table II). There were no between-group differences for the GLP-1 at each time point (Fig. 1).
Table II Postprandial responses of hormones and appetite scores in LTG and HTG groups
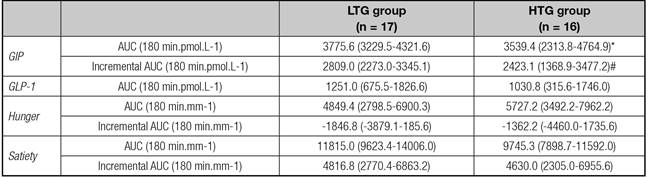
Data are expressed as mean and 95% CI. LTG: low TG change group; HTG: high TG change group. *p = 0.08; #p = 0.02.
Because of the presence of some undetectable and negative values in the postprandial period, it was not possible to calculate the AUC incrementalGLP-1.
HUNGER, SATIETY, AND AD LIBITUM FOOD INTAKE
Satiety was significantly lower in HTG group at 120 min (46.4 ± 32.3 mm vs. 67.0 ± 25.2 mm in LTG group, p = 0.03) and at 150 min (30.2 ± 24.4 mm vs. 62.3 ± 26.0 mm in LTG group, p < 0.01). This same trend was noted at 180 min (27.6 ± 29.9 mm vs. 44.5 ± 27.6mm in LTG group, p = 0.08). There were no between-group differences for hunger at each time point (Fig. 2).

Figure 2 Postprandial hunger and satiety response along time in LTG and HTG groups (*significant difference between the groups).
The HTG group showed a higher preprandial hunger (at 180 min) compared to hunger in fasting (64.2 ± 29.4 mm vs. 41.7 ± 35.4 mm, respectively, p < 0.01), which did not occur in LTG group (50.8 ± 31.7 mm vs. 39.6 ± 33.0 mm, respectively, p = 0.22) (Fig. 2).
Despite these findings, ad libitum energy intake, palatability, and preference were similar in both groups (Table I). However, it is noteworthy that HTG group presented 20% higher energy intake compared to LTG group, which corresponded to +97 kcal during this meal.
TRIGLYCERIDES, INCRETIN RESPONSES AND APPETITE REGULATION
A positive correlation between preprandial TG levels and AUCTG with ad libitum food intake was found in the total sample (r = 0,40, p = 0,03 and r = 0,38, p = 0,03, respectively). Also for the total sample, an inverse correlation between preprandial TG levels and satiety (in the same period) was found (r = -0,37, p = 0,04). Only in LTG group, a positive correlation between GIP and GLP-1 (in fasting) with satiety (r = 0.47, p = 0.05 and r = 0.70, p = 0.01, respectively); and an inverse correlation between ad libitum food intake and AUCtotalGLP-1 (r = -0.69, p = 0.01) were observed.
DISCUSSION
The findings of this study pointed out that women with larger increase in circulating TG levels after a high-fat meal intake exhibited some differences in incretin and appetite profile, that suggests attenuated postprandial GIP and satiety responses. We also found that preprandial TG levels and AUCTG levels correlated positively with ad libitum food intake, which indicates that TG somehow participated in appetite regulation.
Karatayev et al. (2009) 27 confirm the importance of post-prandial TG levels as a predictor of meal size in animals. However, the possibility that TG levels after a high-fat meal are causally related to subsequent hyperphagia still require further elucidation. Evidences suggests that circulating TG act physiologically on brain mechanisms, through orexigenic peptides, to stimulate feeding and, in particular, to mediate high-fat-induced hyperphagia 17,27,28. In fact, a lower secretion of GIP, which is a hormone with possible actions in the food intake regulation, were observed in the HTG group. Moreover, higher TG levels after a meal could be related to limited TG metabolization by the organism, which would stimulate food intake 29. This might point to difficult energy storage in the adipocytes, which could trigger food intake as an attempt to revert the situation, since the human homeostatic system aims to maintain body storage 1,30.
However, despite these differences for the incretin between HTG and LTG groups, there was no impact on ad libitum energy intake. Some studies that aimed to assess GIP function in appetite and food intake using exogenous infusion of different rates (from 0.8 to 5.0 pmol.kg.min-1) and distinct evaluation times did not find that GIP levels affected hunger, satiety, or prospective food intake 9,10. In contrast, Verdich et al. (2001) 5 showed an inverse correlation between the AUCincrementalGIP and ad libitum food intake, and our study also found a positive correlation between GIP and satiety (in fasting) in LTG group. Methodological differences, especially those related to the type of meal (quantity and quality) used to stimulate GIP secretion, and concomitant exogenous GIP infusion, may have been the reason for the diverse results. This is because several factors, such as chewing 31 and meal size and composition 25,32, can affect GIP levels, which are sensitive to abrupt and chronic alterations in the diet, especially those regarding the fat content 33.
Previous studies have demonstrated that exogenous infusion of GLP-1, in supraphysiological rates, reduces hunger and food intake 8,9,10. It is also known that GLP-1 reduces food intake in a dose-dependent way and the infusion rate was the only independent predictor of this reduction 3. In our work, it was observed that ad libitum food intake correlated negatively with AUCtotalGLP-1 in at least one group (LTG group). However, most consistent relationship between GLP-1with hunger and satiety upon physiologically stimulated secretion (secondary to food intake) were not find. Authors who used a methodological design similar to ours; i.e., GLP-1 secretion stimulated by food intake, did not find any GLP-1 effect on appetite or ad libitum food intake in eutrophic and men with obesity 5. Other studies that used infusions of exogenous GLP-1 at low rates (to reflect physiological postprandial concentrations) did also not detect any influence of GLP-1 on food intake 2,34. All these results suggest that, in physiological conditions, changes in GLP-1 along and after a meal do not significantly impact appetite regulation and subsequent energy intake in the short term, especially in individuals with obesity who seem to have an attenuated GLP-1 response during meals 5,6,7.
This lack of influence of GLP-1 in physiological conditions can be related to its short half-life, as well as GIP, which hinders the action of these hormones in appetite regulation. Both are, after its secretion, rapidly metabolized in their inactive forms by the enzyme DPP-IV, produced in high quantities by intestinal epithelial cells 33,35. Although providing an increased secretion in the postprandial period of around 5-10 times its baseline value, the biologically active quantity of these hormones in the blood stream is significantly smaller than the amount produced 36. Only about 10-15% of GLP-1 secreted reaches peripheral tissues and pancreatic β cells 35. It is important to consider the larger activity of DPP-IV verified in obesity; this degrades GLP-1 more precociously, thereby limiting its appetite-regulating actions in this condition 6,7.
Moreover, high-fat diets modify the intestine-brain axis communication, reduce the basal levels of GLP-1 and also reduce the activation of the GLP-1 receptor, attenuating its posterior satiety signaling 37,38,39. Besides that, lipotoxicity (which is associated with high-fat diets intake) affects GLP-1 receptors expression and signaling 40,41. Therefore, individuals with obesity, who are chronically exposed to high-fat diets, undergo rapid GLP-1 inactivation and require larger GLP-1 receptor stimulus to produce its anorexigenic effects.
The sample size can be considered a limitation in this study since some analysis showed no conclusive results but rather borderline p-values. Due to the pulsatile incretin secretion, the AUC's analysis also can be a limitation to find more conclusive results. Furthermore, it is important to consider that other variables related to emotional and environmental factors that influence food intake are difficult to control. The simple fact of participating in a survey can interfere with food intake.
In conclusion, our findings showed that women with larger increments in TG levels after a high-fat meal presented differences in satiety scores and lower postprandial secretion of GIP. This indicated an impaired incretin and appetite profile in women with this metabolic profile, however with no impact on ad libitum food intake in short term.

