


My SciELO
 Custom services
Services on Demand
Journal
Article
 English (pdf)
 Article in xml format
 Article references
 Send this article by e-mail
Indicators
-
 Cited by SciELO
 -
 Access statistics
Related links
-
 Cited by Google
 -
 Similars in
SciELO
Similars in
SciELO -
 Similars in Google
Share

 Permalink
Nutrición Hospitalaria
On-line version ISSN 1699-5198Print version ISSN 0212-1611
Nutr. Hosp. vol.34 n.6 Madrid Nov./Dec. 2017
https://dx.doi.org/10.20960/nh.1111
Estimation of body fat among 2-to-7-year-old Spanish children by different skinfolds equations and waist-to-height ratio
Determinación de grasa corporal en niños españoles de 2 a 7 años mediante diferentes fórmulas de plicometría y el índice cintura-talla
Ana Gutiérrez-Hervás1, Ernesto Cortés-Castell2, Mercedes Juste-Ruíz2, Vicente Gil-Guillén2 and María Mercedes Rizo-Baeza1
1Nursing Department. Universidad de Alicante. Alicante, Spain.
2Department of Pharmacology, Pediatrics and Organic Chemistry. Universidad Miguel Hernández. Alicante, Spain
ABSTRACT
Introduction: It seems relevant to analyze the body composition in the early childhood. However, there is not an agreement in the protocol to assess body composition in this age range/group.
Objective: To determine the most useful equation to estimate the body fat percentage that preschool children contain and the utility of the waist-to-height ratio to determine abdominal obesity.
Methods: We measured (weight, height, waist circumference and skinfolds) in 285 children aged 2 to 7 years old. BMI Z-Score, waist-to-height ratio and body fat percentage were estimated by Brook and Lukaski, Siri, Goran, Slaughter, Deurenberg, Huang, Dezenberg and Hoffman equations.
Results: It was found 26% combined overweight and obesity, with similar distribution in both sexes. The body fat obtained with the Hoffman equation (15.6-31.9%) showed the highest correlation with children BMI Z-Score. Waist-to-height ratio also presented a good relationship with children weight status. There were not significant differences between gender and body fat percentage or waist-to-height ratio.
Conclusions: Hoffman equation and waist-to-height ratio could be adequate to estimate body fat percentage and abdominal obesity respectively in Spanish preschool children from medium-low socioeconomic status.
Key words: Preschool child. Abdominal obesity. Body composition. Anthropometry.
RESUMEN
Introducción: parece relevante analizar la composición corporal en la primera infancia. Sin embargo, en este rango de edad no existe un protocolo consensuado para determinar la composición corporal.
Objetivo: determinar la fórmula más útil para estimar el porcentaje de grasa corporal contenido en niños preescolares y la utilidad del índice cintura-talla para determinar la obesidad abdominal.
Métodos: medimos (peso, talla, circunferencia abdominal y pliegues cutáneos) a 285 niños de 2 a 7 años. Se estimaron el Z-Score de IMC, el índice cintura-talla y el porcentaje de grasa corporal mediante las fórmulas de Brook y Lukaski, Siri, Goran, Slaughter, Deurenberg, Huang, Dezenberg y Hoffman.
Resultados: se halló un 26% de prevalencia combinada de sobrepeso y obesidad, con distribución similar entre sexos. El porcentaje de grasa corporal obtenido con la fórmula de Hoffman (15,6-31,9%) mostró la mayor correlación con el Z-Score del IMC. El índice cintura-talla también presentó una buena relación con el estado nutricional de los niños. No hubo diferencias significativas entre el sexo y el porcentaje de grasa corporal o el índice cintura-talla.
Conclusiones: la fórmula de Hoffman y el índice cintura-talla podrían ser adecuados para estimar el porcentaje de grasa corporal y la obesidad abdominal respectivamente, en preescolares españoles de nivel socioeconómico medio-bajo.
Palabras clave: Preescolar. Obesidad abdominal. Composición corporal. Antropometría.
INTRODUCTION
There is great concern about overweight and obesity due to increased prevalence of these conditions in recent years, both in adults (1,2) and in children (3,4). Due to the many adverse long term effects of obesity, it has become a major focus of health care intervention and expenditure. These effects include higher risk for type 2 diabetes, degenerative joint disease, obstructive sleep apnea, hypertension, and early death in adulthood as well as hyperlipidemia and hyperglycemia in childhood (5), or metabolic syndrome in preschool children (6). Because of that, obesity is the aim of many studies around the world (7,8). Three specific periods in early life are hypothesized to be critical for the development of obesity: the perinatal period, the adiposity rebound, and adolescence. The adiposity rebound is the point at which the BMI (body mass index) reaches a nadir and then begins to increase, it occurs around 6 and it is related with parents' BMI (9).
It seems relevant to analyze the body composition in the early childhood (8,10). Childhood obesity studies usually include very broad age ranges (11) and mostly focus on more than 8-year-old children or teenagers (12). However, younger ages are less studied (13-16), especially in Spain.
To diagnose obesity, BMI and body composition are used. The latter parameter can be measured by several methods that vary in their sophistication, accuracy, feasibility, cost, and availability. In small children, magnetic resonance imaging and DEXA have cost, ethical and time consuming limitations and bioelectrical impedance analysis (BIA) has an availability limitation (not accessible to children smaller than 5 years old), despite being the most reliable methods (16-19). On the other hand, air displacement plethysmography does not seem to be appropriate in early childhood (17). Nevertheless, anthropometry by skinfolds offers a good accessibility, low cost and an acceptable accuracy (20).
A large number of studies determine body composition by several equations to estimate the body fat percentage from skinfolds, however most of them have been executed in school children or teenagers (21-23), in preschool children it has been considerate by other authors (24-26). On the other hand, BMI should be used regarding age and sex (26,27).
The aim of this paper is to determine previously published equation to estimate the body fat percentage in early childhood, as a more accessible, quicker, cheaper and non-aggressive method, that has the higher correlation with weight status by BMI Z-Score. As well as analyze the utility of waist-to-height ratio to determine the abdominal obesity in Spanish preschool children.
MATERIALS AND METHODS
Design
A descriptive study with quantitative analysis was executed with children aged 2 to 7 years old from Rafal, a population of Alicante (Spain).
Participants
Two hundred and eighty-five children were included in the study, 146 (51.2%) girls median age 5.0 (SD 1.5) years and 139 (49.8%) boys of 5.1 (SD 1.4) years old. They are 72.3% of total children in the municipality from this age range. These children were from the unique school and the only two kindergartens of this municipality. Socioeconomic status of the families was medium-low and the rate of children with immigrant parents was 22.5%, mostly of Moroccan origin, according to census data.
The inclusion criteria were: 2- to -7-year-old children; whose parents had been informed about the nature of the study and had read and signed informed consent. As exclusion criteria: children under 2-years-old or over 7-years-old, children with Down syndrome and every child whose parents did not sign informed consent to participate in this study.
Environment
Anthropometry was executed in the school multipurpose classroom and in the pediatric clinic medical office population.
Tools
Auxological parameters were measured by two trained nutritionists. Seca weighing-scales (761 Clas IIII, accuracy 0.5 kg), a harpenden stadiometer (Holtain Limited, Crymych, Dyfed U.K.), which determines height accurately within 0.1 cm and two Holtain skinfolds calipers (Holtain Limited, Crymych, Dyfed U.K.) which determines skinfolds accurately within 0.1 mm. Weight, stature, abdominal circumference and biceps, triceps, subscapular and suprailiac skinfolds were measured.
Process
The study protocol was approved by the ethics committee of the Universidad de Alicante before its initiation.
For the anthropometry study, nutritionists addressed children to the multipurpose classroom in small groups of 4 children. They were observed while drawing or playing with toys to determine the most used arm. When it was detected, researchers helped children take off their shoes and their outer clothing and then they measured weight, stature and triplicate measure waist and skinfold listed above in every child. Parents were present, if they wanted, with their children during the measurement process.
BMI (kg/m2) was calculated from parameters obtained and BMI Z-Score was calculated in relation to their age and gender by Seinaptraker program (28), based on Orbegozo Fundation standards 1988. Children were classified by BMI Z-Score in 4 subgroups: thinness Zs ≤ -1, normal weight Zs -0.99-0.99, overweight Zs ≥ 1 and obesity Zs ≥ 2.
Waist-to-height ratio and the body fat percentage were also calculated with the assistance of SPSS Statistics (24.0). The last parameter was estimated using skinfolds with different equations designed to estimate body fat mass:
- Brook y Lukaski (29):
• Boys D = [1.1315 + 0.0018 (age-2)] - [0.0719 - (0.0006 (age-2) * log (∑biceps + triceps + subescapular + suprailiac)].- Siri (29):
• Girls D = [1.1315 + 0.0004 (age-2)] - [0.0719 - (0.0003 (age-2) * log (∑bicipital + tricipital + subescapular + suprailiac]. (D = density).
• Boys D = 1.1690-0.0788 * log (∑biceps + triceps + subescapular + suprailiac).- Goran (30):
• Girls D = 1.2063 -0.0999 * log (∑biceps + triceps + subescapular + suprailiac). (D = density). %BF = (4.95/D - 4.5) x 100.
• %BF = weight * (0.18 * weight +0.23 * subescapular + 0.13 * triceps - 3.0) / 100.- Slaughter (31):
• Boys %BF = weight * [(1.21 * (triceps + subescapular) - 0.008 (triceps + subescapular)2 - 1.7] / 100. • Girls %BF = weight * [1.33 * (triceps + subescapular) - 0.013 (triceps + subescapular)2 - 2.5] / 100.- Deurenberg (32):
• Boys %BF = weight * [26.56 (log ∑biceps + triceps + subescapular + suprailiac) - 22.23] / 100. • Girls %BF = weight * [29.85 (log ∑biceps + triceps + subescapular + suprailiac) - 25.87] / 100.- Huang 1 (33):
• %BF = weight * (0.632 * weight - 1.606 * age -1.882 * gender + 3.33) / 100 (gender 0 = girls; 1 = boys; age in years).- Huang 2 (33):
• %BF = weight * (0.764 * weight - 0.471 * stature + 45.955) / 100 (stature in cm).- Dezenberg 1 (34):
• %BF = weight * (0.342 * weight + 0.256 * triceps + 0.837 * gender - 7.388) / 100 (gender 1 = boys; 2 = girls).- Dezenberg 2 (34):
• %BF = weight * (0.332 * weight + 0.263 * triceps + 0.760 * gender + 0.704 - 8.004) / 100 (gender 1 = boys; 2 = girls).- Hoffman (22):
• %BF = 100 [6.371 + 0.488 * weight + 0.128 * triceps (11.138 * stature + 0.645 * gender - 0.188 * age] / weight (stature in cm; gender 0 = boys; 1 = girls; age in years).
Statistical analysis
To determine if there are significant differences in the children distribution according to weight status a Chi-squared test was executed. To determine the equation that has a better correlation with children weight status, regression lineal study between the estimated body fat percentage from each equation and BMI Z-Score in both genders was effected. The same test was completed for waist-to-height ratio. Finally, to verify the effectiveness of each of the equations used comparison statistical study of body fat percentages obtained according to weight status was performed, using the nonparametric U Mann-Whitney test. Significance at p < 0.05 was considered.
RESULTS
Gender distribution was similar in all weight status groups, without significant differences by Chi-squared test. Combined overweight and obesity prevalence was 26% (Table I).

Body fat percentages obtained with Hoffman equation showed the highest correlation with children weight state according to BMI Z-Score (p < 0.001). Other equations also obtained significant differences between weight status and body fat percentage to both genders (p < 0.001), except for Brook and Lukaski and the second Huang equations which did not present significant correlation to weight status (Table II). Waist-to-height ratio presented a good level of correlation versus BMI Z-Score as well, 0.643 in boys and 0.683 in girls, with a high signification level (p < 0.001) (Table II). In all cases, a slightly better correlation coefficient (r2) in girls was shown.

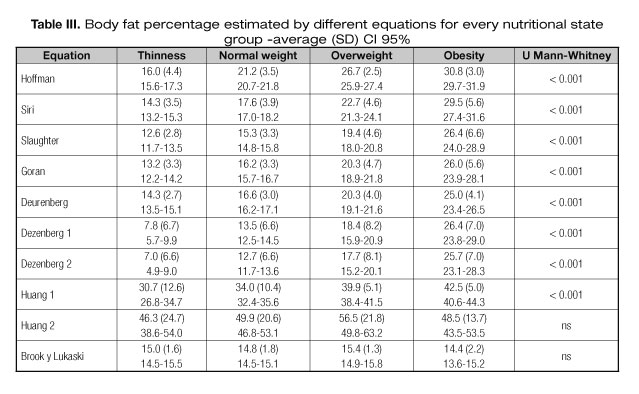
Average, standard deviation and confidence interval 95% values to body fat percentage obtained by every equation are shown in table III, which is observed as with the correlation level that Brook and Lukaski and the second Huang equations do not present significant differences between body fat percentage and weight status by Z-Score BMI. Values that seemed undervalued in the two Dezenberg equations with percentages ranging from 4.9% to 29.0% fat were observed, and there were overestimated values with the first Huang equation with body fat percentages from 26.8 to 44.3%.
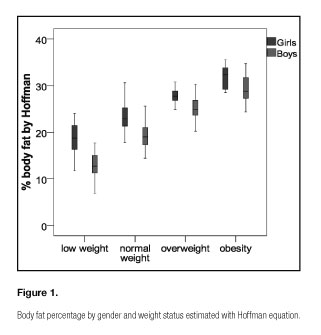
When the values of body fat percentage in each weight group were studied, distributions were different and highly significant (p < 0.001) according to the equation with the best correlation coefficient, Hoffman equation was observed (Fig. 1). In this figure, body fat percentages values were always higher in girls, although these percentages were not significantly different from the same groups of weight.
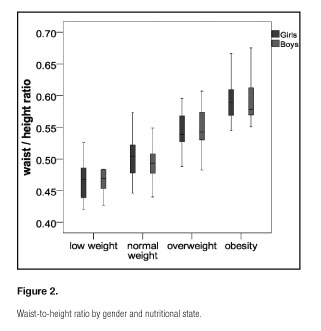
Regarding to waist-to-height ratio (Fig. 2), a different distribution by weight status was shown (p < 0.001) (Test U de Mann-Whitney), this ratio increased with weight groups, but the difference between genders referred to the body fat percentage was not evidenced.
DISCUSSION
The equation that presents the higher correlation with BMI Z-Score in 2-to-7-year-old Spanish children is the Hoffman equation. Also, waist-to-height ratio has a high correlation level with BMI Z-Score, consequently it could be effective to determine the abdominal obesity level. It has been shown that there is a clear relationship between both parameters in all groups of weight status, the higher BMI Z-Score higher body fat percentage has the child and highest is this accumulation in the abdominal area. There are not differences between genders because of the lack of clear sexual differentiation at this age. In contrary, Brook and Lukaski and the second Huang equation are the only ones with which no correlations or significant differences with weight status have been obtained. Furthermore, no coherent body fat percentage values have been observed; the first Huang equation seems overvalued these values when moving between 26.8% and 44.3% of body fat. Equally, both Dezenberg equations render seemingly inconsistent results, moving between 4.9% and 29.0%. They are a low percentages of body fat since it is thinness children but without an extreme degree of malnutrition (BMI Z-Score < -0.99).
Other authors, in a study of older children, also highlighted the suitability of the Hoffman equation in comparison with Goran, Slaughter and Huang equations (22).
Although, there are studies that conclude that the different Huang equations obtain more accurate results than the Dezenberg (25), other claim that the first Dezenberg equation used underestimates the total body fat percentage (21,25), while the second one overestimate it in a comparison between both or with BIA or DEXA results (21). Also in comparison with BIA or DEXA, the Slaugther equation overestimates total body fat (25) or obtains similar results (5). At the same time, to determine the most adequate equate to estimate the body fat percentage in 10-to-14-year-old Spanish children has been recommended (7). Body fat results obtained using skinfolds are usually compared with those obtained by DEXA or MRI because it has proven to be the most reliable and sensitive methods (13,16,18,19,26,27).
Discrepancies between these studies and the present study may be due to studies cited were published mostly before the Hoffman equation existed and it was tested in older children (7,25,33).
Waist-to-height ratio has been effective in estimation determining abdominal obesity as has been observed in higher samples and other populations (35,36). In addition, its easy application has been demonstrated because it does not need a highly trained researcher or health professional and it is the best predictor to obesity-associated diseases such as cardiovascular disease and type 2 diabetes (36,37).
BMI Z-Score, skinfolds and waist-to-height ratio are suitable parameters to diagnose childhood obesity (21,36,38,39). Nevertheless, unifying criteria for use of the formulas for the determination of total body fat in children is considered necessary, just as other authors have concluded (21,33).
Childhood overweight and obesity prevalence was 26%, coinciding with 23 international studies (37).
This paper provides evidence on the validity of different formulas for determining body composition in southeast Spanish early childhood from middle and low socioeconomic status. Its importance is due to the wide variety of equations that are present for this purpose in the literature, the few studies on this age population and the difficulty of determining body composition in preschool by the inadequacy or inaccessibility or better predictors of body fat; as DEXA or BIA (21,38-40). The use of skinfolds and their conversion into body fat percentage, along with the measurement of waist-to-height ratio can be useful in screening for overweight and obesity, complementing the Z-Score BMI. It could be helpful for the diagnosis and monitoring childhood obesity in primary care, with no initial need for more accurate methods but much more expensive and aggressive for the child.
The main limitation of this study is that it was performed in a small town and that these results have not been extrapolated to the general population in this age range, the study replication in other communities would be necessary. In contrast, note the very high participation, a percentage greater than 70% of all children in this age group in the population studied.
The most significant contribution is the comparison between the different equations and/or ratios for determining body composition in Spanish preschool children, population so far little present in the literature.
ETHICAL STANDARDS
All human and animal studies have been approved by the appropriate ethics committee and have therefore been performed in accordance with the ethical standards laid down in the 1964 Declaration of Helsinki and its later amendments.
Also, all people gave their informed consent prior to their inclusion in the study.
ACKNOWLEDGMENTS
The authors thank the town of Rafal for their participation in the study and the facilities used and we thank Catherine Nicholls for help with the English language version of the text.
REFERENCES
1. Bonfanti N, Fernández JM, Gómez-Delgado F, Pérez-Jiménez F. Efecto de dos dietas hipocalóricas y su combinación con ejercicio sobre la tasa metabólica basal y la composición corporal. Nutr Hosp 2014;29(3):635-643. DOI: 10.3305/nh.2014.29.3.7119
2. Gonçalves F, Cremonezi C, Rodrigues F, Wanda R. Weight and body composition variations in overweight women along outpatient nutritional treatment Nutr Hosp 2014;29(3):644-55. DOI: 10.3305/NH.2014.29.3.7193
3. Baile J, González-Calderón M. Precisión del índice de masa corporal, obtenido a partir de datos de peso y altura autoinformados en una muestra infantil española. Nutr Hosp 2014;29(4):829-831. DOI: 10.3305/nh.2014.29.4.7143
4. Dietz WH. Health consequences of obesity in youth: childhood predictors of adult disease. Pediatrica 1998;101:518-25.
5. Berlina K, Hamel-Lambertb J, DeLamatrec C. Obesity and overweight status health disparities among low-income rural apalachian preschool children. Child Health Care 2013;42(1):15-26.
6. Gutiérrez-Hervás AI, Rizo-Baeza MM, Martínez-Amorós N, Cortés-Castell E. Systolic pressure, abdominal obesity and body fat, metabolic syndrome predictors in Spanish preschoolers. Nutr Hosp 2015;31(5):2109-14. DOI: 10.3305/nh.2015.31.5.8685
7. Berral FJ, Gómez JR, Viana BH, Berral CJ, Carpintero P. Estudio de la composición corporal en escolares de 10 a 14 años. Rev Bras Cineantropom Desempenho Hum 2001;3(1):20-33.
8. DeBoer MD, Scharf RJ, Demmer RT. Sugar-sweetened beverages and weight gain in 2- to 5-year-old children. Pediatrics 2013;132(3):413-20.
9. Chan C, Wang WC. Quality of life in overweight and obese young Chinese children: A mixed-method study. Health Qual Life Outcomes 2013;11(1). DOI: 10.1186/1477-7525-11-33
10. Dietz WH. Critical periods in childhood for the development of obesity. Am J Clin Nutr 1994;59:955-9.
11. Davidson ZE, Ryan MM, Kornberg AJ, Sinclair K, Cairns A, Walker KZ, et al. Observations of body mass index in Duchenne muscular dystrophy: a longitudinal study. Eur J Clin Nutr 2014;68:892-987.
12. Fernández-Alvira JM, Velde SJ, De Bourdeaudhuij I, Bere E, Manios Y, Grammatikaki E, et al. Parental education associations with children's body composition: mediation effects of energy balance-related behaviors within the ENERGY-project. Int J Behav Nutr Phys Act 2013;21:80.
13. Cordova A, Villa G, Sureda A, Rodriguez-Marroyo JA, Martínez-Castañeda R, Sánchez-Collado MP. Energy consumption, body composition and physical activity levels in 11- to 13-year-old Spanish children. Ann Nutr Metab 2013;63(3):223-8.
14. Forsum E, Flinke Carlsson E, Henriksson H, Henriksson P, Lof M. Total body fat content versus BMI in 4-year-old healthy Swedish children. J Obes 2013:206715.
15. Sijtsma A, Corpeleijn E, Sauer Pieter JJ. Energy requirements for maintenance and growth in 3- to 4-year-olds may be overestimated by existing equations. J Pediatr Gastroenterol Nutr 2014;58:642-6.
16. Zanini RV, Santos IS, Gigante DP, Matijasevich A, Barros FC, Barros AJ. Body composition assessment using DEXA in six-year-old children: the 2004 Pelotas Birth Cohort, Rio Grande do Sul State, Brazil. Cad Saude Publica 2014;30:2123-33.
17. Crook TA, Armbya N, Cleves MA, Badger TM, Andres A. Air displacement plethysmography, dual-energy X-ray absorptiometry, and total body water to evaluate body composition in preschool-age children. J Acad Nutr Diet 2012;112:1993-8.
18. Karlsson AK, Kullberg J, Stokland E, Allvin K, Gronowitz E, Svensson PA, et al. Measurements of total and regional body composition in preschool children: A comparison of MRI, DEXA, and anthropometric data. Obesity 2013;21:1018-24.
19. Kulkarni B, Mamidi RS, Balakrishna N, Radhakrishna KV. Body composition assessment in infancy and early childhood: comparison of anthropometry with dual-energy X-ray absorptiometry in low-income group children from India. Eur J Clin Nutr 2014;68:658-63.
20. Cairns G, Angus K, Hastings G, Caraher M. Systematic reviews of the evidence on the nature, extent and effects of food marketing to children. A retrospective summary. Appetite 2013;62:209-15.
21. Eisenmann JC, Helaan KA, Welk GJ. Assesing body composition among 3-to-8-year-old children: antropometry, BIA and DEXA. Obes Res 2004; 12(10):1633-40.
22. Hoffman DJ, Toro-Ramos T, Sawaya AL, Roberts SB, Rondo P. Estimating total body fat using a skinfold prediction equation in Brazilian children. Ann Hum Biol 2012;39(2):156-60.
23. Swaminathan S, Thomas T, Yusuf S, Vaz M. Clustering of diet, physical activity and overweight in parents and offspring in South India. Eur J Clin Nutr 2013;67(2):128-34.
24. Fernández JA. Estimación de la composición corporal por dos de las ecuaciones de Dezenberg para niños de 5 a 10 años. Rev Cub de Salud Pública 2003;29(1):37-41.
25. Kehoe SH, Krishnaveni GV, Lubree HG, Wills AK, Guntupalli AM, Veena SR, et al. Prediction of body fat percentage from skinfold and bioimpedance measurements in Indian school children. Eur J Clin Nutr 2011;65(12):1263-70.
26. Wells JCK, Fewtrell MS. Measuring body composition. Arch Dis Child 2006;91:612-7. DOI: 10.1136/adc.2005.085522
27. Norgan NG. Population differences in body composition in relation to the body mass index. Eur J Clin Nutr 1994;3:10-25.
28. Sociedad Española de Investigación en Nutrición y Alimentación en Pediatría-SEINAP, Nestlé Nutrition Institute and InterCath Medical-One, 2007. Aplicación Informática para gestión de pacientes y cálculos auxológicos y nutricionales en Pediatría. Nestlé Nutrition Institute; 2007.
29. Rodríguez G, Moreno LA, Blay MG, Blay VA, Fleta J, Sarria A, et al. Body fat measurement in adolescents: comparison of skinfolds with dual-energy X-ray absorptiometry. Eur J Clin Nutr 2005;59:1158-66.
30. Goran MI, Driscoll P, Johnson R, Nagy TR, Hunter G. Cross calibration of body-composition techniques against dual-energy X-ray absorptiometry in young children. Am J Clinl Nutr 1996;63:299-305.
31. Slaughter MH, Lohman TG, Boileau RA, Horswill CA, Stillman RJ, Van Loan MD. Skinfold equations for estimation of body fatness in children and youth. Hum Bio 1988;60:709-23
32. Deurenberg P, Pieters JJ, Hautvast JG. The assessment of the body fat percentage by skinfold thickness measurements in childhood and young adolescence. Br J Nut 1990;63:293-303.
33. Huang T, Watkins M, Goran M. Predicting total body fat in Latino children. Obes Res 2003;11:1992-9.
34. Dezenberg CV, Nagy TR, Gower BA, Johnson R, Goran MI. Predicting body composition from anthropometry in preadolescent children. Int J Obes 1999;23:253-9.
35. Quelly SB, Lieberman LS. Global prevalence of overweight and obesity in preschoolers. Anthropol Anz 2011;68(4):437-56.
36. Research Group EPINUT nutritional epidemiology at the Complutense University of Madrid. Available at: http://www.epinut.ucm.es (accessed 13 december 2015).
37. Li C, Ford ES, Mokdad AH, Cook S. Recent trends in waist circumference and waist-height ratio among US children and adolescents. Pediatrics 2006;118:1390-8.
38. Bammann K, Huybrechts I, Vicente-Rodriguez G, Easton C, De Vriendt T, Marild S, et al; IDEFICS Consortium. Validation of anthropometry and foot-to-foot bioelectrical resistance against a three-component model to assess total body fat in children: the IDEFICS study. Int J Obes 2013;37(4):520-6.
39. Halvorson EE, Irby MB, Skelton JA. Pediatric Obesity and Safety in Inpatient Settings: A Systematic Literature Review. Clin Pediatr 2014;53(10):975-87.
40. Morrison H, Power TG, Nicklas T, Hughes SO. Exploring the effects of maternal eating patterns on maternal feeding and child eating. Appetite 2013;63:77-83.
 Correspondence:
Ernesto Cortés Castell.
Department of Pharmacology, Pediatrics and Organic Chemistry.
Universidad Miguel Hernández.
Ctra. Alicante-Valencia, km. 8,7.
03550 San Juan, Alicante. Spain
e-mail: ernesto.cortes@umh.es
Received: 12/03/2017
Accepted: 11/04/2017

