


Mi SciELO
 Servicios personalizados
Servicios Personalizados
Revista
Articulo
 Inglés (pdf)
 Articulo en XML
 Referencias del artículo
 Enviar articulo por email
Indicadores
-
 Citado por SciELO
 -
 Accesos
Links relacionados
-
 Citado por Google
 -
 Similares en
SciELO
Similares en
SciELO -
 Similares en Google
Compartir

 Permalink
Nutrición Hospitalaria
versión On-line ISSN 1699-5198versión impresa ISSN 0212-1611
Nutr. Hosp. vol.34 no.6 Madrid nov./dic. 2017
https://dx.doi.org/10.20960/nh.1063
Validation of a Food Frequency Questionnaire for the indigenous Épera-Siapidara people in Ecuador
Validación de un Cuestionario de Frecuencia de Consumo de Alimentos para indígenas Épera-Siapidara en Ecuador
M.ª Pilar Villena-Esponera1,2, Rafael Moreno-Rojas1, Manuel Romero-Saldaña3 and Guillermo Molina-Recio4
1Department of Food Science and Technology. University of Cordoba. Agrifood Campus of Excellence International CeiA3. Córdoba, Spain.
2Food Safety and Quality Research Group. Pontificial Catholic University of Ecuador in Esmeraldas (PUCESE). Esmeraldas, Ecuador.
3Department of Occupational Safety and Health. Córdoba City Hall. Córdoba, Spain.
4Department of Nursing. School of Medicine and Nursing. Universidad de Córdoba. Córdoba, Spain. NURSE Group - ADENYD
ABSTRACT
Background: A Food Frequency Questionnaire (FFQ) must be designed and validated in the local environment to ensure that the method is adapted to the objectives of the study and the population.
Objective: The aim of this study was to validate an FFQ to evaluate the food consumption pattern of the Épera-Siapidara population of Ecuador. One hundred and four individuals (54% men and 46% women), aged between 2 and 84, took part in the study.
Methods: The validity of this tool was assessed by comparing the relationship between the average daily nutrient intake estimated by the FFQ and the intake estimated in the three non-consecutive 24 h dietary recalls (24hR). The existing correlations were evaluated by Pearson's or Spearman's correlation, the inter-class correlation coefficient, Lin's concordance correlation coefficient and a Bland-Altman plot.
Results: The values estimated by the FFQ were significantly higher for minerals and vitamins. The relative correlation coefficients ranged from 0.71 to 0.23 for Na and Ca, respectively, while the inter-class correlation coefficient ranged from 0.84 to 0.33 for Na and cholesterol, respectively. Lin's concordance correlation coefficient was higher for macronutrients, with values ranging from between 0.35 for lipids to 0.51 for energy. Only 6% of the participants were wrongly classified. The Bland-Altman plots showed an overestimation of macronutrient and calcium intake by the FFQ compared with the 24hR, and an underestimation of fiber intake.
Conclusion: The FFQ demonstrated a good external consistency, which makes it a suitable instrument for correctly identifying the food and nutrient intake of the Épera-Siapidara population.
Key words: Validation studies. Nutrition surveys. Indigenous population. Ecuador.
RESUMEN
Introducción: se debe diseñar y validar un Cuestionario de Frecuencia de Consumo de Alimentos (CFCA) en el ambiente local para asegurar que el método se adapta a los objetivos del estudio y a la población.
Objetivo: validar un CFCA para evaluar el patrón de consumo de alimentos de población Épera- Siapidara en Ecuador. Participaron 104 personas (54% hombres y 46% mujeres), con edades comprendidas entre 2 y 84 años.
Métodos: la validez se realizó comparando la relación entre la ingesta diaria media de nutrientes estimada por el CFCA y la ingesta estimada de tres días no consecutivos mediante rellamadas de 24 h (24hR). Las correlaciones existentes se evaluaron por correlación de Pearson o Spearman, el coeficiente de correlación interclase (CCI), el coeficiente de correlación de concordancia de Lin (CCC) y gráficos de Bland-Altman.
Resultados: los valores estimados por el CFCA fueron significativamente mayores para minerales y vitaminas. Los coeficientes de correlación relativa oscilaron entre 0,71 y 0,23 para Na y Ca, respectivamente, mientras que el CCI varió de 0,84 a 0,33 para Na y colesterol, respectivamente. El CCC fue mayor para macronutrientes, con valores que oscilaron entre 0,35 para lípidos y 0,51 para energía. Solo el 6% de los participantes fueron clasificados erróneamente. Los gráficos de Bland-Altman mostraron sobreestimación de ingesta de macronutrientes y calcio por el FFQ y una subestimación de la ingesta de fibra.
Conclusión: la CFCA mostró buena consistencia externa, lo que lo convierte en un instrumento útil para identificar correctamente la ingesta de alimentos y nutrientes de la población Épera-Siapidara.
Palabras clave: Estudios de validación. Encuestas nutricionales. Población indígena. Ecuador.
INTRODUCTION
Nutrition is one of the prime factors which help to raise people's future potential and standard of living; however, it is conditioned by socio-economic factors and access to food (1). Indigenous populations are seen as particularly vulnerable to malnutrition, since few public policies cater for these groups and their settlements are generally found in isolated places (2,3); specific methodological approaches are therefore required which are specially adapted to their characteristics (4).
The Épera-Siapidara nation living in Ecuador is made up of 546 individuals, of whom 20% are considered refugees. They originate from the Embera indigenous people, located in Colombia in the departments of Cauca, Valle del Cauca and Nariño. Due to land reform, environmental pressure and armed conflicts, a number of families migrated to Ecuador, and settled in their current home on the banks of the Cayapas River. Displacement and territorial limitations are changing the traditional Épera-Siapidara food system, worsening its nutritional status, increasing food insecurity (2,5) and limiting the development of its people (1).
One of the commonest ways of evaluating the quality of a diet is the Food Frequency Questionnaire (FFQ), which allows us to obtain information about the long-term patterns of habitual food consumption. It is also a method which is relatively inexpensive, quick and easy to apply (6). However, FFQ must be designed and validated in the local environment to ensure that the method is adapted to the objectives of the study and the population, and is sensitive to local cultural values (7). To determine the validity of the measurements, it is important to check that the results obtained are similar to those derived using other methods (8-10). A number of different methods are used for validating FFQs, but in cases where little cooperation can be expected from the subjects and their literacy level is low, the most suitable and most widely used method is the 24 h dietary recalls (24hR) (11).
The aim of the study is to validate a FFQ to assess the food consumption pattern of the Épera-Siapidara population in Ecuador.
METHODS
Subjects
The main concentration of Épera-Siapidara population is at Santa Rosa de los Épera (12). Due to the difficulty in access and staying in the community, and to the absence of a part of the adult population during the application of the survey, it was not possible to obtain an exhaustive sample of 100% of homes. For this reason, a randomized stratified sampling by age and sex without replacement was carried out on the population of 254 individuals who were registered for this research project, with an expected frequency of chronic malnutrition of 12% (the objective stated for 2015 in Ecuador for reducing malnutrition) (13) and a confidence level of 95%. The sample obtained was 100 individuals aged 2-82 years, representative both numerically and for their homogeneity in the alimentary behavior.
Study design
In the third quarter of 2014, a single trained interviewer estimated food consumption in the community of Santa Rosa de los Épera by conducting one FFQ and three 24hR. Due to the humid tropical climate and consistently high temperatures in the province of Esmeraldas, with little variation in temperature over the whole year, it was considered that the diet did not vary substantially due to seasonal changes (14).
Food Frequency Questionnaire
Different groups of a population consume different types of food and an incorrect estimation can lead to a false link between food consumption pattern and their state of health (8). Therefore, the FFQ was adapted from the one developed in Colombia by Monsalve et al. (15) in 2011, which used a focus group consisting of 6 women from the community. Adapted from the ENSIN 2005 database for Colombia (16), foods were classified into the following categories: dairy products, eggs, meat and fish, oils and fats, legumes and flours, fruit, greens and other vegetables, sweets and desserts, miscellaneous, beverages and others. All the questions referred to the year leading up to the interview and allowed the subject to state the frequency of consumption per day, week, month or year. The questionnaire was answered by the person responsible for preparing the family food.
The amount of food consumed was measured directly by weighing the food and beverages on the spot, and indirectly by a single individual specially trained in estimating the portions for the purposes of this study. In addition, to aid the calculation of the weight of the food consumed, a photographic atlas of food rations designed by the research team was used.
Validity study and statistical analysis
Three 24hR were carried out, the first one a week after conducting the FFQ and the other two less than one month after the first, one showing consumption during the week and the other consumption at weekends. The mean intake of the three 24hR was used as a reference value for ingestion from the 24hR.
In both questionnaires, Nutriplato 2.0 software (17) was used to estimate energy and daily nutrient intake by means of an SQL compilation algorithm.
The quantitative variables were analyzed by their mean, median and standard deviation (SD) for the 24hR and the FFQ. The significance of nutrient intake differences between the FFQ and the mean of the three 24hR was obtained by age groups using the Wilcoxon test. Gross classification errors were calculated using contingency tables.
The validity of the FFQ was estimated through the correlation between the average daily intake of nutrients estimated in the FFQ and the average nutrient intake estimated over the 3 days, for each person evaluated by the 24hR (6,18,19).
Histograms with normal curves and the Kolmogorov-Smirnov test were used to verify normality, using p > 0.05. For an initial approximation of the correlation between the variables, Pearson's or Spearman's linear coefficient was used, depending on whether it followed a normal distribution or not. After that, in order to correct and exclude inter-individual and intra-individual variation, the intra-class correlation coefficient (ICC) was calculated (20). To do this, the data were adjusted for energy following the residual method in order to control the confounding effect of the calories (13,20,21) and nutrient intake values were log transformed to normalize the distribution of these data. Finally, in order to calculate both the accuracy and the precision of the relation, Lin´s concordance correlation coefficient was used, which allows us to observe the deviation of the data obtained by two methods on a line from the origin and at 45 degrees, which corresponds with the perfect concordance line or perfect reproducibility.
Finally, the Bland-Altman analysis for energy, macronutrients, fiber and calcium was used to produce a graphical display of the agreement limits between the 24hR and FFQ methods (22).
The statistical calculations were performed using SPSS version 15.0 (SPSS Inc., Chicago, United States) and Epidat version 4.1 (Consellería de Sanidad, Xunta de Galicia, Spain). In all the statistical tests, the significance level used was p < 0.05.
Ethical standards
Two types of consent were requested: one from the community, for which those attending the General Assembly were asked to vote, and the president of the Épera-Siapidara was required to sign a document. The head of the household also signed after reading the informed consent document, which was read out in Spanish or translated into Siapidee when necessary.
RESULTS
The study was carried out on 104 individuals (54% men and 46% women). Just as in the case of the population of Santa Rosa de los Épera, the gender distribution of the sample was well balanced. The average age was 21.9 ± 18.1, similar to the mean of the population (19.6 ± 17.7). The sample showed a wide variation, as in the distribution of the population, with ages ranging from 2 to 84 years old. Due to the low number of women aged 40-49 years in the community, no information was obtained for this population group.
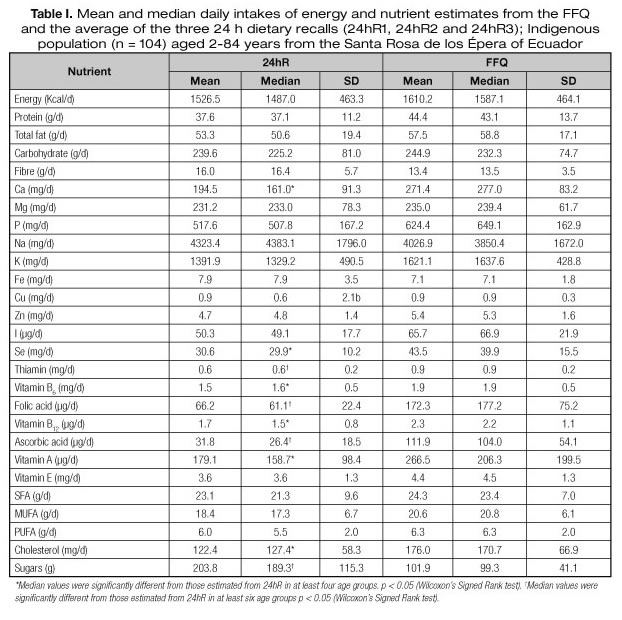
Table I shows the mean, median and SD of nutrient intake. The values estimated by the FFQ were significantly higher for Ca, Se, thiamine, vitamin B6, biotin, folic acid, vitamin B12, ascorbic acid, vitamin A and cholesterol; and lower for sugars. No significant differences were found for macronutrients, except in the 40-49 age group for proteins and lipids, the 50-59 age group for lipids and the 10-13, 14-19 and 20-29 age groups for fiber (p < 0.05).
The percentages of classification errors are shown in table II. Between 40% and 76% of the individuals were classified in the same quintile or the adjacent one in the FFQ and in the mean of the three 24hR (mean 58.7%). Specifically, for macronutrients, fiber and energy, the classification range in the same quintile or the adjacent one ranged from 56.7% to 62.2%; in the case of minerals, this was between 39.4% and 76.0%, for vitamins it was between 51.9% and 61.4% and for fats between 53.8% and 62.5%. The mean percentage of misclassification was 6%, and for all the nutrients, below 14%.

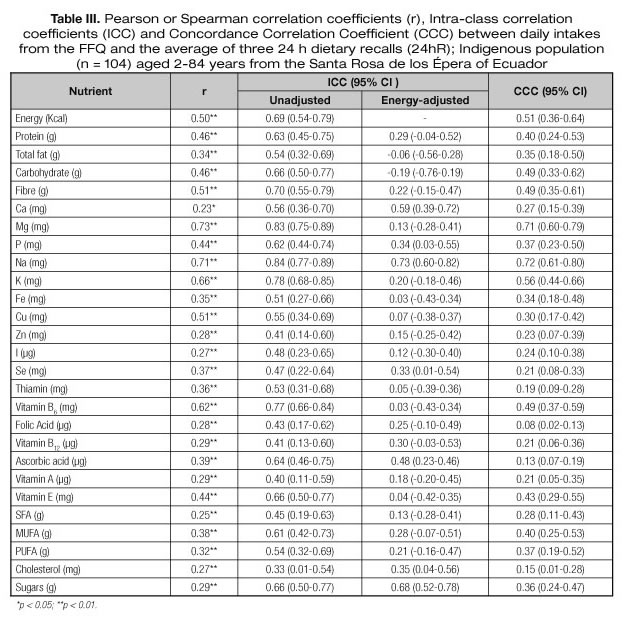
The results of the validity of the nutrient intake are shown in table III. After analyzing the Pearson's or Spearman's correlation coefficient, ranges of 0.34-0.51 for macronutrients, 0.23-0.73 for minerals, 0.28-0.62 for vitamins and 0.25-0.38 for fatty acids were found. The highest correlations were found for magnesium, sodium and potassium. The ICC ranged from 0.84 to 0.33, with values > 0.50 for fiber, sodium, potassium, copper and vitamin B6 with unadjusted data. When adjusted for energy, the ICC values were lower for most nutrients. The values for Lin's concordance correlation coefficient were higher for macronutrients: from 0.35 for lipids and 0.51 for energy and, in the case of minerals, 0.21 for selenium and 0.72 for sodium.
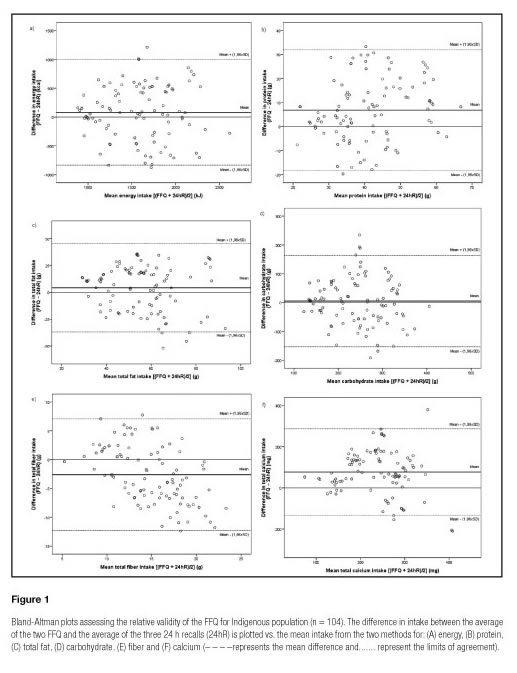
The Bland-Altman plots showed an overestimation of macronutrient and calcium intake by the FFQ compared to the 24hR and an underestimation for fiber intake (Fig. 1). The average differences were: -83.6 Kcal for energy, -6.8 g for proteins, -4.2 g for lipids, -5.2 g for carbohydrates, 2.6 g for fiber and -77 mg for calcium. However, the graphs indicated that the two methods are comparable, as no more than 4 readings were out of the agreement range for energy, carbohydrates, lipids, proteins, fiber and calcium.
DISCUSSION
A food frequency questionnaire was validated for the indigenous Épera-Siapidara population of Ecuador. According to the literature, this was the first questionnaire published and validated for this population. The validity of the FFQ was checked by comparing the results with those obtained from three 24hR, a method used in a large number of studies (6,14,23-26) and the one chosen as a reference for our study. Alternatively, we could have used a dietary journal; however, this option was rejected in view of the community's high illiteracy rate and their difficulties of accessibility or permanence. Both the FFQ and the 24hR are prone to similar sources of error, based on memory dependence and the estimation of portion size. To reduce the error in the estimate, all the questionnaires in this study were carried out by a single person carrying a photographic atlas of food portions. Estimates of macronutrient, energy and fiber intake may be comparable between the two methods used. However, we found that the FFQ used tended to overestimate the consumption of micronutrients and vitamins compared to the values obtained with the 24hR, and to underestimate the sugars. This problem of over/underestimation of nutrient intake has been reported in other studies and has been identified as a common problem when comparing FFQ with other dietary methods (8,9,27,28).
Despite the differences found for some nutrients, the correlation coefficients confirm a close relationship between the methods compared.
The correlation for energy, fiber and the three main macronutrients is similar to other studies (9,24,29,30) (with a range of 0.34 for lipids and 0.50 for energy) or even higher when compared with studies carried out in rural areas or peri-urban areas of Latin America (8,31). As regards the consumption of minerals and vitamins, correlations of over 0.50 are observed for magnesium, sodium, potassium, copper and vitamin B6, which indicate a close correlation between both methods (32,33). All the other nutrients except calcium are in the 0.30-0.49 range, which indicates a fair to medium association (24,34). The correlations found are similar to those obtained in other similar validation studies: Elorriaga et al. (24) presented values between 0.26 and 0.47 in a study carried out in Chile, Argentina and Uruguay; Silva-Jaramillo et al. (23) found coefficients between 0.26 and 0.57 in a validation study carried out in the capital of Ecuador, and Dehghan et al. (31) produced correlations between 0.18 and 0.38 in urban areas and between 0.00 and 0.31 in rural areas of Colombia.
The ICC values were between 0.3 and 0.8, with an average of 0.6 for unadjusted data, which is similar to the values found in other validation studies (27,35,36). As in other studies (10,30,37), no increase in correlation was observed when adjusted for energy.
The criticisms made about the use of Pearson's coefficient or the ICC to measure agreement can be put down to the fact that they do not provide information on the magnitude and direction of the difference (bias) between the two variables analyzed (38). To overcome the limitations of the ICC, Lin (1989) developed a coefficient to determine the concordance between continuous variables using the Concordance Correlation Coefficient (39). The results of the study show values similar to other studies for energy, macronutrients and fiber (26,32,40,41). However, the infrequent use of this method to assess the concordance in micronutrients and vitamins does not allow us to reach accurate conclusions based on these results.
The Bland-Altman method, based on a graphical interpretation, was used to obtain more detailed information about the relationship between the FFQ and the results produced by the 24hR. The results obtained are similar to those of other studies (8,10,27,34,35), where very few individuals fell outside the recommended limits, thus confirming an acceptable level of agreement between the two methods.
The classification capacity obtained by the FFQ was similar or slightly higher than that produced in other studies (24,27,35,36,42), when comparing the extreme misclassification measured using the FFQ with the average of the three 24hR. However, it should be noted that some studies, for comparison purposes, grouped participants in quartiles (23,42) instead of in quintiles, as was the case in our study.
The main limitation of this research is the impossibility to use biomarkers, which are accepted as the "gold standard" for the validation of FFQs. However, many studies have used, like us, the 24hR as a reference (6,8,9,24-31,36,42). Another limitation has been the impossibility to assess the reproducibility of the FFQ by repeating it after the original survey. The possibility of doing this by using a self-access version was considered; however, due to the high illiteracy rate in the community, this was not considered a practical option. Following Aguirre-Jaime et al. (14), we evaluated the possibility of carrying out part of the survey to evaluate reproducibility; however, we concluded that this was not a viable option due to the subjectivity of this method.
According to the results of the validation, we consider that the FFQ is an instrument which shows good properties of external consistency and is capable of accurately identifying the food and nutrient intake of the Épera-Siapidara population, thus making it a valid tool for epidemiological studies which aim to assess the diet of this population group in Ecuador.
ACKNOWLEDGMENTS
The authors are grateful to the participants of the study and the community Santa Rosa de los Épera (Esmeraldas) Ecuador.
REFERENCES
1. Jiménez-Benítez D, Rodríguez-Martín A, Jiménez-Rodríguez R. Análisis de determinantes sociales de la desnutrición en Latinoamérica. Nutr Hosp 2010;25(s03):18-25.
2. Garcete Mañotti L. La nutrición como pilar para el desarrollo del capital humano. Pediatr (Asunción. 2010;37(2):87-8.
3. Villalobos-Colina D, Marrufo-Torres L, Bravo-Henríquez A. Situación nutricional y patrones alimentarios de niños indígenas en edad escolar de la etnia Wayuú. Antropo 2012;28:87-95.
4. Aranceta-Bartrina J, Varela-Moreiras G, Serra-Majem L, Pérez-Rodrigo C, Abellana R, Ara I, et al. Methodology of dietary surveys, studies on nutrition, physical activity and other lifestyles. Nutr Hosp 2015;31(s03):9-12.
5. Prada Gómez GE, Herrán Falla OF, Ortiz Cárdenas R. Patrón alimentario y acceso a los alimentos en familias desplazadas en el municipio de Girón, Santander, Colombia. Rev Panam Salud Publica 2008;23(4):257-63.
6. Rivas A, Romero A, Mariscal M, Monteagudo C, Hernández J, Olea-Serrano F. Validación de cuestionarios para el estudio de hábitos alimentarios y masa ósea. Nutr Hosp 2009;24(5):521-8.
7. Parr CL, Barikmo I, Torheim LE, Ouattara F, Kaloga A, Oshaug A. Validation of the second version of a quantitative food-frequency questionnaire for use in Western Mali. Public Health Nutr 2002;5(6):769-81.
8. Dehghan M, Cerro S del, Zhang X, Cuneo JM, Linetzky B, Diaz R, et al. Validation of a Semi-Quantitative Food Frequency Questionnaire for Argentinean Adults. PLOS ONE 2012;7(5):e37958.
9. Jackson MD, Walker SP, Younger NM, Bennett FI. Use of a food frequency questionnaire to assess diets of Jamaican adults: validation and correlation with biomarkers. Nutr J 2011;10:28.
10. Trinidad Rodríguez I, Fernández Ballart J, Cucó Pastor G, Biarnés Jordà E, Arija Val V. Validación de un cuestionario de frecuencia de consumo alimentario corto: reproducibilidad y validez. Nutr Hosp 2008;23(3):242-52.
11. Cade J, Thompson R, Burley V, Warm D. Development, validation and utilization of food-frequency questionnaires - a review. Public Health Nutr 2002;5(4):567-87.
12. Carrasco E. Territorio, fundamento de la visibilidad. In: Los Épera Siapidara en Ecuador. De la invisibilidad a la visibilidad. Quito: Trama ediciones; 2010. pp. 71-86.
13. Moreano Barragán M. Perfiles nutricionales por países. Ecuador. Roma-FAO. 2001. (Cited 2015 Feb 12). Available at: ftp://ftp.fao.org/es/esn/nutrition/ncp/ecumap.pdf.
14. Aguirre-Jaime A, Cabrera de León A, Domínguez Coello S, Borges Álamo C, Carrillo Fernández L, Batista G, et al. Validación de un cuestionario de frecuencia de consumo de alimentos adaptado para el estudio y seguimiento de la población adulta de las Islas Canarias. Rev Esp Salud Públ 2008;82(5):509-18.
15. Monsalve Álvarez M, González Zapata LI. Diseño de un cuestionario de frecuencia para evaluar ingesta alimentaria en la Universidad de Antioquía, Colombia. Nutr Hosp 2011;26(6):1333-44.
16. Instituto Colombiano de Bienestar Familiar. Encuesta Nacional de la Situación Nutricional en Colombia, 2005. Colombia: Instituto Colombiano de Bienestar Familiar. Bogotá: Panamericana Formas e Impresos S.A.; 2006.
17. Moreno Rojas R, Pérez Rodríguez F, Cámara Martos F. Nutriplato 2.0 web para valoración de recetas y platos de libre uso. Nutr Clin Diet Hosp 2012;32(1):58-29.
18. Sánchez-Llaguno SN, Neira-Mosquera JA, Pérez-Rodríguez F, Moreno-Rojas R. Preliminary nutritional assessment of the Ecuadorian diet based on a 24-h food recall survey in Ecuador. Nutr Hosp 2013;28(5):1646-56.
19. Paalanen L, Männistö S, Virtanen MJ, Knekt P, Räsänen L, Montonen J, et al. Validity of a food frequency questionnaire varied by age and body mass index. J Clin Epidemiol 2006;59(9):994-1001.
20. Willett W. Nutritional Epidemiology. 2nd ed. New York: Oxford University Press; 1998.
21. Arija V, Abellana R, Ribot B, Ramón JM. Biases and adjustments in nutritional assessment from dietary questionnaires. Nutr Hosp 2015;31(s03):113-8.
22. Bland JM, Altman DG. Statistical methods for assessing agreement between two methods of clinical measurement. Lancet [internet]. 1986. (Cited 2016 Dec 12); 327(8476):307-10. Available at: http://www.sciencedirect.com/science/article/pii/S0140673686908378
23. Silva-Jaramillo KM, Neutzling MB, Drehmer M. FFQ for the adult population of the capital of Ecuador (FFQ-Quito): development, reliability and validity. Public Health Nutr 2015;18(14):2540-9.
24. Elorriaga N, Irazola VE, Defago MD, Britz M, Martinez-Oakley SP, Witriw AM, et al. Validation of a self-administered FFQ in adults in Argentina, Chile and Uruguay. Public Health Nutr 2015;18(1):59-67.
25. Zarrin R, Ibiebele TI, Marks GC. Development and validity assessment of a diet quality index for Australians. Asia Pac J Clin Nutr 2013;22(2):177-87.
26. Marques-Vidal P, Ross A, Wynn E, Rezzi S, Paccaud F, Decarli B. Reproducibility and relative validity of a food-frequency questionnaire for French-speaking Swiss adults. Food Nutr Res [Internet]. 2011 May. (Cited 2016 Oct 25); 55(0). Available at: http://www.foodandnutritionresearch.net/index.php/fnr/article/view/5905
27. Zapata ME, Buffarini R, Lingiardi N, Gonçalves-Soares AL. Reproducibility and relative validity of a semi-quantitative food-frequency questionnaire in an adult population of Rosario, Argentina. Rev Esp Nutr Hum Diet 2015;19(4):227-30.
28. Silva NF da, Sichieri R, Pereira RA, Silva RMVG da, Ferreira MG. Reproducibility, relative validity and calibration of a food frequency questionnaire for adults. Cad Saude Publica 2013;29(9):1783-94.
29. Marcinkevage J, Mayén A-L, Zuleta C, DiGirolamo AM, Stein AD, Ramirez-Zea M. Relative Validity of Three Food Frequency Questionnaires for Assessing Dietary Intakes of Guatemalan Schoolchildren. PLOS ONE 2015; 10(10):e0139125.
30. Satvinder Kaur, Hamid Jan bin Jan Mohamed, Rohana Abdul Jalil, Barakatun-Nisak Mohd, Hip Seng Yim. Validation and Reproducibility of a Culturally Specific Food Frecuancy Questionnaire (FFQ) for Malaysian Punjabis. Mal J Nutr 2016;22(2):245-55.
31. Dehghan M, López Jaramillo P, Dueñas R, Anaya LL, Garcia RG, Zhang X, et al. Development and Validation of a Quantitative Food Frequency Questionnaire among Rural- and Urban-dwelling Adults in Colombia. J Nutr Educ Behav 2012;44(6):609-13.
32. Bautista LE, Herrán OF, Pryer JA. Development and simulated validation of a food-frequency questionnaire for the Colombian population. Public Health Nutr 2005;8(2):181-8.
33. Ambrosini GL, Klerk N de, Musk AW, Mackerras D. Agreement between a brief food frequency questionnaire and diet records using two statistical methods. Public Health Nutr 2001;4(2):255-64.
34. Goni Mateos L, Martínez Hernández JA, Santiago Neri S, Cuervo M. Validación de una encuesta para evaluar el estado nutricional y los estilos de vida en las etapas preconcepcional, embarazo y lactancia. Rev Esp Nutr Comunitaria [Internet]. 2013. (Cited 2016 Jul 21); 19(2): 105-113. Available at: https://www.scienceopen.com/document?vid=b952f275-2d78-4a35-ab46-07332a4fecaa
35. Macedo-Ojeda G, Vizmanos-Lamotte B, Márquez-Sandoval YF, Rodríguez-Rocha NP, López-Uriarte PJ, Fernández-Ballart JD. Validación de un cuestionario semi-cuantitativo de frecuencia de consumo de alimentos para determinar la ingestión de grupos de alimentos y nutrientes. Nutr Hosp 2013;28(6):2212-20.
36. Fernández-Ballart JD, Piñol JL, Zazpe I, Corella D, Carrasco P, Toledo E, et al. Relative validity of a semi-quantitative food-frequency questionnaire in an elderly Mediterranean population of Spain. Br J Nutr 2010;103(12):1808-16.
37. Martin-Moreno JM, Boyle P, Gorgojo L, Maisonneuve P, Fernandez-Rodriguez JC, Salvini S, et al. Development and validation of a food frequency questionnaire in Spain. Int J Epidemiol 1993;22(3):512-9.
38. Cortés-Reyes É, Rubio-Romero JA, Gaitán-Duarte H (2010) Métodos estadísticos de evaluación de la concordancia y la reproducibilidad de pruebas diagnósticas. Rev Col Obst Gin 2010;61(3):247-55.
39. Lin LI. A concordance correlation coefficient to evaluate reproducibility. Biometrics 1989;45(1):255-68.
40. Herrán OF, Ardila MF. Validity and reproducibility of two semi-quantitative alcohol frequency questionnaires for the Colombian population. Public Health Nutr 2006;9(6):763-70.
41. Rodríguez MM, Méndez H, Torún B, Schroeder D, Stein AD. Validation of a semi-quantitative food-frequency questionnaire for use among adults in Guatemala. Public Health Nutr 2002;5(5):691-9.
42. Lee Y, Park K. Reproducibility and validity of a semi-quantitative FFQ for trace elements. Br J Nutr 2016;116(5):864-73.
 Correspondence:
María Pilar Villena Esponera.
Departamento de Bromatología y Tecnología de los Alimentos.
Campus Rabanales, ed. Darwin-anexo.
Universidad de Córdoba
e-mail: pilar.villena@hotmail.com
Received: 23/02/2017
Accepted: 22/05/2017

