


My SciELO
 Custom services
Services on Demand
Journal
Article
 text in
  English (pdf)
 Article in xml format
 Article references
 Send this article by e-mail
Indicators
-
 Cited by SciELO
 -
 Access statistics
Related links
-
 Cited by Google
 -
 Similars in
SciELO
Similars in
SciELO -
 Similars in Google
Share

 Permalink
Nutrición Hospitalaria
On-line version ISSN 1699-5198Print version ISSN 0212-1611
Nutr. Hosp. vol.34 suppl.4 Madrid 2017
https://dx.doi.org/10.20960/nh.1571
Adequacy of the dietary intake of total and added sugars in the Spanish diet to the recommendations: ANIBES study
Adecuación de la ingesta de azúcares totales y añadidos en la dieta española a las recomendaciones: estudio ANIBES
Emma Ruiz1 and Gregorio Varela-Moreiras1,2
1Spanish Nutrition Foundation (FEN). Madrid, Spain.
2Faculty of Pharmacy. CEU San Pablo University. Madrid, Spain
Potential conflicts of interest: the ANIBES scientific study was supported by Coca-Cola Iberia through a grant to support the research project managed via an agreement with the FEN. In this sense, Coca-Cola Iberia did not participate in the study design nor in the collection, analysis and interpretation of the data, nor did it take part in writing the various scientific articles resulting from the research nor in deciding to publish the findings.
ABSTRACT
Introduction: In 2015, the WHO published its recommendations for added sugars intake: < 10% of the total energy (TE) intake in both adults and children. No updated information is available in Spain about the degree of compilance.
Objectives: To examine total sugar intake, mainly focused on added, and food and beverage sources. To analyze fulfilment with WHO recommendations.
Methods: The ANIBES study of a representative sample of the Spanish population (9-75 yr) was used. Food and beverage records were obtained by a three-day dietary record by using a tablet device.
Results: The median total sugar intake was 17% total TEI: 7.3% for added, and 9.6% for intrinsic sugar intake. Differences were observed for added sugar which was much higher in children and adolescents. For the intrinsic sugar, however, a higher contribution to TEI was observed in the elderly. 58.2% of children fulfil WHO recommendations (< 10% TEI), lower for adolescents (52.6%), and higher for adults (76.7%) and older adults (89.8%). The major sources of total sugar were milk and dairy products (23.2%), non-alcoholic beverages (18.6%), fruits (16.8%) and sugars and sweets (15.1%) and grains (12.0%). The major sources of intrinsic sugars were fruits (31.8%), milks (19.6%), juices and nectars (11.1%), vegetables (9.89%), yoghurt and fermented milk (7.18%), low-alcohol-content beverages (4.94%), bread (2.91%), and sugar-sweetened soft drinks (2.24%). As for free sugars, sources were sugars and sweets (34.1%), non-alcoholic beverages (30.8%, mainly as sugar-sweetened soft drinks, 25.5%) and grains (19.1%, principally as pastries and cakes, 15.2%).
Conclusion: The present study demonstrates that only a moderate percentage of the Spanish population adhered to current recommendations for total and added sugar intake, and urgent efforts are needed to improve diet quality in the youngest populations.
Key words: Carbohydrates. Total sugars. Added sugars. Intrinsic sugars. ANIBES.
RESUMEN
Introducción: la Organización Mundial de la Salud (OMS) en el año 2015 recomendó que el consumo de azúcares añadidos se debería reducir a menos del 10% de la ingesta calórica total, pero no hay datos actualizados en España.
Objetivos: evaluar la ingesta de azúcares totales, con especial énfasis en los añadidos, sus fuentes alimentarias, y el grado de adherencia a las recomendaciones de la OMS.
Métodos: se ha utilizado la muestra ANIBES (9-75 años), representativa de la población española. La estimación de la ingesta ha sido mediante registro de 3 días ("Tablet").
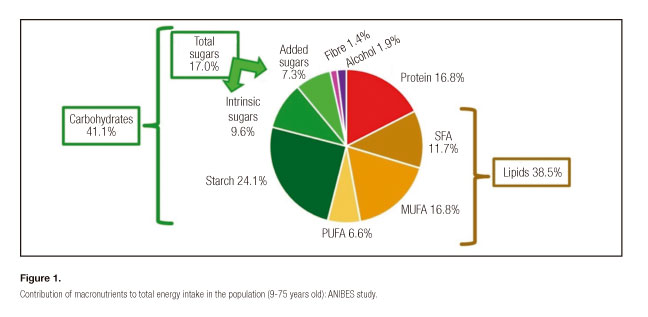
Resultados: los hidratos de carbono proporcionan un 41,1% de la energía total consumida (ETC): 24,1% de los almidones, y el 17% del total de azúcares (9,6% para azúcares intrínsecos y el 7,3% a los azúcares añadidos). El aporte de azúcares intrínsecos es mayor en las poblaciones de mayor edad; por el contrario, el consumo de azúcares añadidos es significativamente mayor en edades más tempranas. Un 58,2% de la población infantil cumpliría con la recomendación de la OMS (< 10% ETC), menor para los adolescentes (52,6%), y aumenta la adherencia con la edad: 76,7% (18-64 años) y 89,8% en personas mayores. En cuanto a los azúcares totales, las principales fuentes de la dieta son leche y derivados (23,2%), bebidas sin alcohol (18,6%), frutas (16,8%), azúcares y dulces (15,1%) y cereales y derivados (12,0%). La principal fuente de azúcares intrínsecos fueron las frutas (31,8%), leche (19,6%), zumos y néctares (11,1%), vegetales (9,89%), yogurt y leche fermentada (7,18%), bebidas de bajo contenido alcohólico (4,94%), pan (2,91%), y bebidas azucaradas (2,24%). Para azúcares añadidos: azúcares y dulces (34,1%), bebidas sin alcohol (30,8%, básicamente como refrescos con azúcar, 25,5%) y cereales y derivados (19,1%, un 15,2% como bollería y pastelería).
Conclusión: hay diferencias importantes en el cumplimiento de las recomendaciones de la OMS, dependiendo de la edad, por lo que es necesario un especial énfasis y concienciación en población infantil y adolescente.
Palabras clave: Hidratos de carbono. Azúcares totales. Azúcares añadidos. Azúcares intrínsecos. ANIBES.
INTRODUCTION
The term "sugars" has traditionally been used to refer to monosaccharides and disaccharides, which are types of carbohydrate (CH). Due to their sweet taste, sugars are used as sweeteners to increase the palatability of foods and drinks, to preserve foods, and to lend certain characteristics to foods such as viscosity, texture, volume and the ability to provide flavor or a golden color. The main function of CH is to provide the body with energy. Sugars are the nutrients which produce the cleanest and quickest combustion in the cells and which leave fewer residues in the body. They are also the most cost-effective and abundant, with foods rich in this macronutrient representing a staple in human nutrition (1-3).
Despite this, from a nutritional perspective, sugars are not essential nutrients, as glucose may be produced by the body (4). No precise daily recommended levels of carbohydrates have been established for human nutrition, although more traditional recommendations advise that this nutrient should comprise between 55% and 60% of the total energy in the diet (4). Meanwhile, the European Food Security Authority (EFSA) has proposed a range of reference intakes of between 45-60% of the total energy, with total monosaccharides and disaccharides remaining below 10% (1). The World Health Organization (WHO), on the other hand, recommends reducing consumption of free (added) sugars throughout the life course to less than 10% of total calorie intake. Moreover, according to the WHO, a recommended reduction to less than 5% would result in additional health benefits (4). In Spain, the Spanish Society of Community Nutrition (SENC) also recommends that less than 10% of total energy should be obtained from added sugars, advising optional, occasional consumption (5).
It is important to highlight that these recommendations and limits focus only on the effects of consuming free or added sugars, and not intrinsic sugars (present in fruit, vegetables, natural juices, etc.). On the other hand, the maximum amount of CH which we may ingest is limited only by its calorific value and by our energy needs, that is, by potential problems linked to excessive energy intake: inadequate control of body weight and higher risk of becoming overweight or obese (6). Equally, excessive sugar consumption has been linked to various health risks: obesity, type 2 diabetes, heart disease, osteoporosis and cancer, although no convincing correlation with these pathologies has been identified based on present scientific evidence (7). However, such a relationship has been observed between consumption of simple sugars and tooth decay (significant evidence), although this may be influenced by other factors such as the consumption of starch, the frequency of food consumption, oral hygiene, etc., and not only sugar consumption (1,2,4,8).
Very little reliable data on the intake of sugars and their subtypes is available, due primarily to the lack of information on sugars in most Food Composition Tables (FCT) and databases, as well as to the usual methodological issues in dietary surveys, which complicate the collection of precise information on actual food and beverage consumption (9,10).
In view of the above, this article presents information from the ANIBES study, representative of the Spanish population aged between 9 and 75 years old, which used new technologies to record food and beverage consumption in relation to the intake of total sugars as well as natural or intrinsic sugars and so-called added sugars, and primary food sources. Pioneering information on the percentage of the Spanish population which adheres to the maximum intake level recommended by the WHO and other institutions is presented.
MATERIAL AND METHODS
For the first time in Spain, the ANIBES study combines evaluation and anthropometric data on macronutrient and micronutrient intake, as well as physical activity and socioeconomic data on the Spanish population, in a single study. A detailed methodology of the ANIBES study has already been published (11,12).
To summarize, the scope of the study comprised individuals aged between 9 and 75 years old who are resident in Spain (with the exception of the autonomous cities of Ceuta and Melilla), who live in communities of at least 2,000 inhabitants. Based on an initial sample of 2,634 participants, the final valid sample comprised 2,009 participants, who were representative of the Spanish population (margin of error of ± 2.23% for a 95.5% confidence interval). This sample was extended to boost the youngest age groups (9-12, 13-17 and 18-24 years old), to ensure correct representation and interpretation of all groups, with at least 200 participants in each (margin of error of ± 6.9%), which corresponds to our final extended sample of 2,285 participants. The selection of individuals to participate in the study took place during the months of September, October and November 2013, using stratified multistage sampling, with random selection of the household within the municipality and age and gender quotas for the individual selected in each household. Two pilot studies were previously conducted, with the aim of assessing and validating the various tools used.
In particular, to estimate the intake of total, intrinsic and added sugars, the following procedure and methodology were used: once the energy and nutrients had been calculated from the consumption data collected, an estimate of the proportion of intrinsic sugar and added sugar was derived from product labels produced by the brand (information from the list of ingredients and nutrition labelling) with regard to the total sugars obtained according to data from Food Composition Tables (FCT) (13). The full labels from the packaged products were gathered for each coded food. Among these, as far as possible, brands representing at least 80% of the market were chosen. To do this, it was necessary to take photographs in supermarkets of an average of 2-7 own-brand and branded products for each food (1,164 products) displaying the FCTs coded in ANIBES (766 foods, of which 327 were fresh and/or were not labelled). An average of 1 to 4 photographs were required for each product, capturing the packaging, the company and the brand, as well as the list of ingredients and nutritional information, in a legible manner (3,037 photographs). The labels of those products which could not be found in supermarkets were collected from official brand websites or supermarket websites (less than 10% in the end).
The sugars present in the foods were classified in line with the following criteria:
-Foods without added sugars: all fresh products which are raw or unprocessed, which are not labelled, and which we can deduce do not contain any other added ingredient (most fruits, vegetables, meats, fresh fish, etc.); packaged/labelled products which do not contain any form of added sugar in their list of ingredients. Here, added sugar is defined in accordance with European Union Regulation 1924/2006 on nutrition and health claims made on foods and 1169/2011 on the provision of food information to consumers as: monosaccharides, disaccharides and foods used for their sweetening properties, with the exception of polyalcohols.
-Foods with added sugars: all packaged/labelled products which include some form of added sugar in their list of ingredients. Using this data, the intrinsic sugar content (from natural sources) was estimated on the basis of each of the ingredients present in the product. This amount was subtracted from the total sugar content in the nutritional information for the product (indicated as "of which sugars"), obtaining the proportion of each of the different types of sugars. This proportion was applied to the total sugars in the product indicated in the FCTs. On occasion, the % of added sugar was indicated on the ingredients label and there was no need for any calculation.
The full set of data was duly coded, cleaned and processed for subsequent statistical analysis, using SPSS 19.0 and Excel. The final sample (2,009) was used to display data on the total population and the comparison between genders. For comparisons between age groups and age + gender, the final sample + extension (2,285 participants) was used, with the aim of expanding the least-represented age groups in the final sample. The Kolmogorov-Smirnoff test of normality was used to test the normality of the distribution. For normally distributed variables, comparison between groups took place using the Student's t test for two independent samples and the ANOVA test for more than two independent samples. Levene's test was used to assess the equality of variances, and a Bonferroni adjustment or Games Howell test was applied to multiple comparisons between groups for unequal variances. To resolve the lack of normality, non-parametric tests were carried out: the Mann-Whitney test for two independent samples, and the Kruskal Wallis test for more than two independent samples with a confidence interval of 95%. The results were considered significant with: *p ≤ 0.05, **p ≤ 0.01 and ***p ≤ 0.001 for a confidence interval of 95%.
RESULTS
Carbohydrates as a whole provide 41.1% of total energy intake (TEI). Within CH, 24.1% of TEI comes from starch, and 17% from sugars (Fig. 1). The proportion of starches in the TEI is lower in older adults (Fig. 2). Meanwhile, the percentage of total sugars is lower in the adult group (p ≤ 0.05) than in the other age groups. When the total sugars are disaggregated, 9.6% correspond to intrinsic sugars and 7.3% to added sugars (Fig. 1). Intake of intrinsic sugars is higher among older people; on the other hand, the consumption of added sugars is significantly higher in young people, particularly in adolescents, reaching an average of 10% of the total energy intake (Fig. 2). Table I shows the stratification of the population in terms of the percentage of their added sugar intake. Thus, 58.2% of the child population between 9 and 12 years old, regardless of gender, comply with the recommendation that added sugar intake should represent less than 10% of TEI. In the case of adolescents, compliance is lower (52.6%), yet it is much higher in men (56.2%) than in women (46.0%). Among the adult population (18-64 years old, 76.7%) and in older adults (65-75 years old, 89.8%) fulfilment of the recommendations is markedly higher, particularly among elderly men, among whom it reaches 92.9%. When considering the conditional additional recommendation that added sugar intake should remain below 5% of the TEI, 9.4% of the child population and 13.3% of adolescents would meet the recommendation, far below the levels observed in older populations: 37.5% for those aged between 18-64 years old, and up to 55.3% in people aged 65-75 years old.


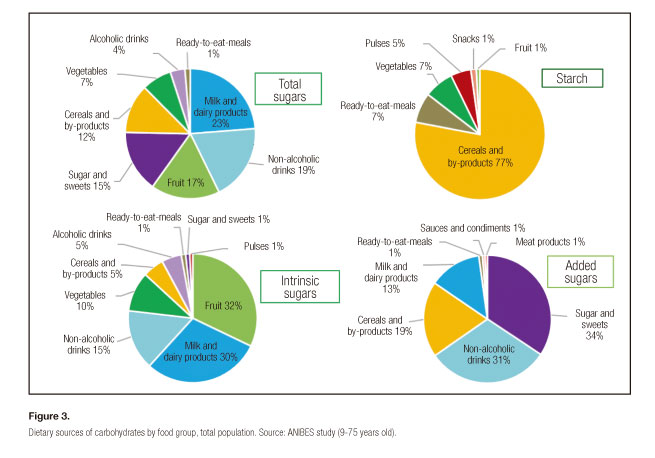
With regard to total sugars, the main dietary sources are milk and dairy products (23.2%), non-alcoholic beverages (18.6%), fruit (16.8%), sugar and sweets (15.1%) and cereals and their by-products (12.0%), which cover 85% of the sugar consumed (Fig. 3). In the case of intrinsic sugars, the main source is fruit (31.8%), milk and dairy products (29.3%) and non-alcoholic beverages (15.0%), such as fruit juices and nectars (11.1%). Meanwhile, sugar and sweets (34.1%), non-alcoholic beverages (30.8%, mainly sugar-sweetened drinks, 25.5%) and cereals and their by-products (19.1%, including 15.2% pastries and cakes) are the main sources of added sugar, as demonstrated in figure 3. This figure also shows the distribution of starch, which is largely supplied by cereals and their by-products (almost 80%).
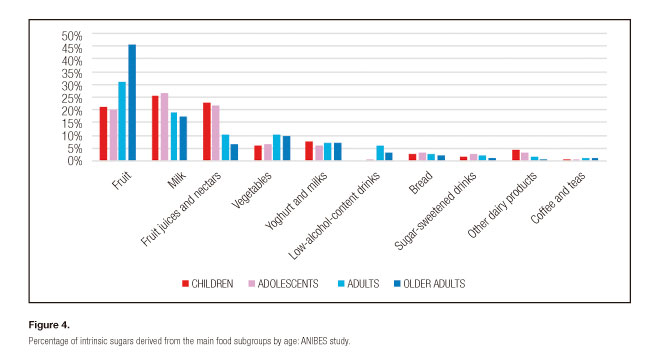
Age differences relating to intrinsic sugars may be observed: higher intake by adults and older adults, deriving mainly from fruit and vegetable consumption, than in children and adolescents, among whom the milk and fruit juice and nectar subgroups are more widely present. Low-alcohol-content beverages are also a source to be taken into account among adults and older adults (Fig. 4).
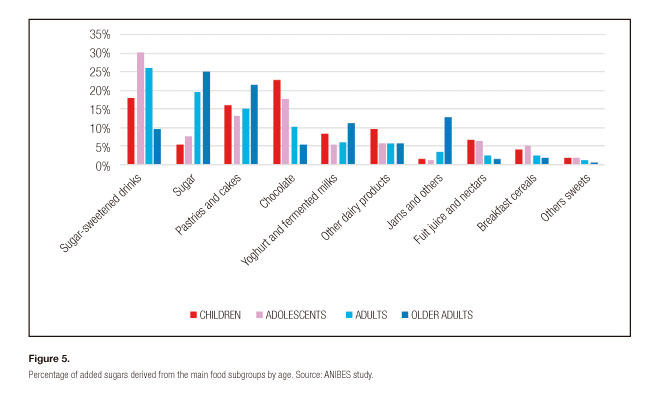
With regard to added sugars, in the child and adult groups, but particularly among adolescents, the sugar-sweetened soft drinks subgroup represents a relevant source (18.0% among children, 26.0% among adults and 30.2% among adolescents), while in the case of older adults it stands at 9.5% (Fig. 5). Pastries and cakes are also a significant source among all age groups. In the group of children and adolescents, the subgroups of chocolate, other dairy products, yoghurt and fermented milks, fruit juices and nectars, and breakfast cereals and cereal bars represent the next groups in terms of intake. Among adults and older adults, the sugar and sweets group is substantial.
DISCUSSION
According to the data collected for the ANIBES study, the sugar and sweets group currently represents 3.3% of TEI in Spain, with trends differing by age (5.1% among children and 2.6% among older adults). In the ENIDE survey, this group contributed 5% of the total energy intake (14). In other countries such as Germany, this group contributed 7% of TEI, and in the United Kingdom, it represented 5% among adults (15).
Nonetheless, it is important to take into account the methodological difficulties linked to this food group, as not all classifications include the same products.
With regard to the proportion of carbohydrates in energy intake, the specific expert reports on this macronutrient produced by the FAO/WHO recommend that the bulk of calorie needs should be covered by carbohydrates (between 55-75%), although this recommendation was modified in 2007 to establish a new lower limit of 50% of TEI, indicating that a wide range of each of the nutrients in the energy intake is compatible with a low risk of chronic disease, although excess intake of any of these has the potential to lead to obesity. Meanwhile, the EFSA has declared that a minimum level of carbohydrate consumption cannot be established, as while intervention studies provide evidence that diets which are high in fat (> 35% of TEI) and low in carbohydrates (< 50% of TEI) are linked to adverse effects on body weight in the short-and long-term, there is insufficient scientific evidence to prove this (1). Equally, diets which are high in carbohydrates tend to produce adverse effects on the blood lipid profile, although there is insufficient scientific evidence to establish a Tolerable Upper Intake Level (UL) for total carbohydrates. Therefore, the EFSA has reached the conclusion that it is only possible to provide a range of reference intakes for carbohydrates, from 45-60%, based in part on practical considerations (current intake levels and dietary patterns). Following national recommendations, the SENC (5) suggests that the proportion of carbohydrates should be > 50% of TEI. With this in mind, the average proportion of carbohydrates in energy intake in the ANIBES study was 41.1% (185.4 ± 60.9 g/person/day), with none of the population groups by either age or gender reaching the aforementioned recommended levels. It is known that developed societies consume high levels of foods of animal origin and of convenience and sweetened products, which consequently reduces the total carbohydrate content of the diet and increases levels of lipids and proteins, leading to an unbalanced caloric profile, with a potential increase in sugar intake and a reduction in starch and dietary fiber.
As noted previously, the terminology used to describe sugar has given rise to difficulties in the ability to compare intake against recommendations and to undertake comparisons across countries or surveys, or simply to reach clear conclusions in studies (10). In its recent directive on sugar intake in adults and children, the WHO defines free sugars as monosaccharides and disaccharides added to foods by manufacturers, cooks or consumers, as well as sugars which are naturally present in honey, syrups, fruit juices and fruit juice concentrates. The WHO recommends reducing consumption of free sugars throughout the life course, declaring that for both adults and children, the consumption of free sugars should be reduced to under 10% of TEI. A further reduction to less than 5% of TEI would produce additional health benefits. Free sugars are differentiated from intrinsic sugars, which are derived from whole fresh fruit and vegetables, and to which recommendations are not applied as there is no proof that their consumption provokes adverse effects on health. In terms of compliance with the aforementioned WHO recommendations, the results presented are pioneering in Spain, and must serve to sharpen efforts to educate the population as a whole, with a particular focus on younger people, among whom added sugar consumption is considerably higher than in older people.
With regard to the effect of excess added sugar consumption on health, the EFSA (1) has declared that it may increase the risk of tooth decay, particularly in cases of insufficient dental hygiene and fluoride prophylaxis. However, the available data does not allow an upper limit for added sugar intake to be established on the basis of a reduction in the risk of tooth decay. A similar situation occurs in the case of obesity, with the EFSA declaring that the scientific evidence linked to high sugar intake (primarily as added sugars) in comparison with high starch intake is inconsistent for solid foods. However, there is some evidence that high sugar intake in the form of sugar-sweetened drinks may contribute to weight gain. Despite this, the evidence continues to be considered insufficient to establish an upper limit. Nonetheless, it is important to consider the negative association between added sugar intake and the density of micronutrients in the diet, which is primarily linked to dietary patterns and not to the intake of added sugar per se, although the latter may contribute to an inadequate nutritional model in case of abuse (17). Meanwhile, there is also evidence that high sugar intakes (> 20% of TEI) may increase serum triglyceride (TG) and cholesterol levels, and that intakes > 20-25% of TEI can negatively affect glucose levels and insulin response, ultimately impacting upon the risk of suffering from so-called metabolic syndrome.
To our knowledge, no national representative study has been carried out to date in Spain using new technologies to estimate total sugar consumption, as well as added and intrinsic sugar intake, as presented in this study. Moreover, the study also provides detailed analysis of food and drink sources by consumer age and gender, revealing significant differences among the different population groups. It is also important to highlight that most food composition tables do not include information on the added and intrinsic sugar content of foods, and that few countries have reported on sugar intake, whether total or added, due largely to this lack of information. Recently, a review of current sugar intake using representative national dietary surveys from around the world was conducted by Newens & Walton (18). It is relevant to note that added sugar intake in adults was only reported in 9 of the 18 countries studied (none reported on intrinsic sugars), and that it oscillated between 7.2% of total energy intake among 10 year old Brazilians and 7.3% in Norwegian adults, to 16.3% among adults aged 18-34 in the United States. Although these data may be insufficient, it is all we have had to work with to analyze the situation until now. In the ANIBES study, total sugar intake was 17% of TEI; intrinsic sugar intake was 9.6% and added sugar intake was 7.3% of TEI.
According to the ANIBES study, the main dietary sources of intrinsic sugar among the Spanish population were fruit, milk, juices and nectars, vegetables, yoghurt and fermented milk, low-alcohol-content drinks, bread, and sugar-sweetened drinks, which make up 90% of the diet. The foods which make the largest contribution to added sugar intake are sugar-sweetened drinks, sugar, pastries and cakes, chocolate, yoghurt and fermented milk, other dairy products, jams, juices and nectars, and breakfast cereal and cereal bars, which make up 90% of the intake. Approximately 70% of the added sugars consumed by the total ANIBES sample come from foods and drinks which tend to be nutrient-poor and energy-dense, such as sugar-sweetened drinks, sugar, pastries and cakes, and chocolate. However, marked differences were observed between age groups in terms of added sugar intake: among children, the chocolate group was in first place, while sugar itself was the main source among the older group (65-75 years old); sugar-sweetened drinks are the main contributors for both adolescents and adults.
In conclusion, in line with market and consumer trends, it seems increasingly important to obtain up-to-date information based on scientific evidence, such as that derived from the ANIBES study, to enable and promote specific education and awareness-raising actions tailored to the different age groups, which display marked differences in terms of total intake of sugar and its subtypes, as well as in terms of dietary sources.
REFERENCES
1. European Food Safety Authority (EFSA). Scientific opinion on dietary reference values for carbohydrates and dietary fibre. EFSA Journal 2010;8(3):1462.
2. Scientific Advisory Committee on Nutrition (SACN). Carbohydrates and Health; Public Health England: London, UK; 2015.
3. Quiles, J. [Consumption patterns and recommended intakes of sugars]. Nutr Hosp 2013;28(Suppl 4):32-9.
4. World Health Organization (WHO). Guideline: Sugars Intake for Adults and Children; World Health Organization (WHO): Geneva, Switzerland; 2015.
5. Grupo Colaborativo de la Sociedad Española de Nutrición Comunitaria (SENC). Guías alimentarias para la población española; la nueva pirámide de la alimentación saludable. Nutr Hosp 2016;33(Supl 8):1-48.
6. Te Morenga L, Mallard S, Mann J. Dietary sugars and body weight: Systematic review and meta-analyses of randomised controlled trials and cohort studies. BMJ 2012;346:e7492.
7. Rippe JM, Angelopoulos TJ. Sugars and health controversies. What does the science say?. Adv Nutr 2015;6:493S-503S.
8. Erickson J, Slavin J. Total, added, and free sugars: are restrictive guidelines science-based or achievable?. Nutrients 2015;7(4):2866-78.
9. Aranceta-Bartrina J, Varela-Moreiras G, Serra-Majem LL, Pérez-Rodrigo C, Abellana R, Ara I, et al. Consensus document and conclusions. Methodology of dietary surveys, studies on nutrition, physical activity and other lifestyles. Nutr Hosp 2015;31(Supp 3):9-11.
10. Hess J, Latulippe ME, Ayoob K, Slavin J. The confusing world of dietary sugars: Definitions, intakes, food sources and international dietary recommendations. Food Funct 2012;3(5):477-86.
11. Ruiz E, Ávila JM, Castillo A, Valero T, del Pozo S, Rodriguez P, et al. The ANIBES Study on Energy Balance in Spain: Design, protocol and methodology. Nutrients 2015;7(2):970-98.
12. Varela Moreiras G, Ávila JM, Ruiz E. Energy balance, a new paradigm and methodological issues: The ANIBES study in Spain. Nutr Hosp 2015;31(Suppl 3):101-12.
13. Moreiras O, Carbajal A, Cabrera L, Cuadrado C. Tablas de Composición de Alimentos/Guía de Prácticas, 15th ed. Ediciones Pirámide: Madrid, 2011.
14. Agencia Española de Seguridad Alimentaria y Nutrición (AESAN). Encuesta Nacional de Ingesta Dietética Española 2011. Available online: http://www.aesan.msc.es/AESAN/docs/docs/notas_prensa/Presentacion_ENIDE.pdf (accessed on 15 April 2015).
15. Wittekind A, Walton J. Worldwide trends in dietary sugars intake. Nutr Res Rev 2014;27(2):330-45.
16. Hu FB. Resolved: there is sufficient scientific evidence that decreasing sugar-sweetened beverage consumption will reduce the prevalence of obesity and obesity-related diseases. Obes Rev 2013;14(8):606-19.
17. Louie JC, Tapsell LC. Association between intake of total vs. added sugar on diet quality: A systematic review. Nutr Rev 2015;73(12):837-57.
18. Newens KJ, Walton J. A review of sugar consumption from nationally representative dietary surveys across the world. J Hum Nutr Diet 2016;29(2):225-40.
 Correspondence:
Gregorio Varela-Moreiras
Faculty of Pharmacy
CEU San Pablo University
Urb. Montepríncipe
Ctra. Boadilla, km 5.3
28668 Boadilla del Monte, Madrid. Spain
e-mail: gvarela@ceu.es; gvarela@fen.org.es

