


 Custom services
 English (pdf)
 Article in xml format
 Article references
 Send this article by e-mail
 Cited by SciELO
  Cited by Google
  Similars in
SciELO
Similars in
SciELO  Similars in Google
 Permalink
INTRODUCTION
Environmental and genetic factors are implicated in the development of obesity and metabolic disorders, which can cause dyslipidemia, insulin resistance, and arterial hypertension (AHT), which it is considered will affect approximately 1.56 billion persons in the world by 2025 1. Furthermore, these conditions increase the risk of developing cancer, cardiovascular diseases and diabetes 2. Insulin resistance (IR) is involved in the development of AHT, highlighting the importance of further exploring the effects of glycemic tolerance and IR on health and its possible treatments 3. The aforementioned disorders are controllable through pharmaceutical drugs, yet represent a high cost to health services worldwide. Currently, distinct research studies have focused on formulating food ingredients with therapeutic benefits for human health 4. In this respect, certain studies demonstrate that slowly digestible starch (SDS) and resistant starch (RS) offer beneficial physiological effects 5,6. For instance, SDS is not completely digestible in the small intestine and provides sustained and prolonged release of glucose. Meanwhile, RS is a starch fraction that is not digested in the small intestine; therefore, it acts as a dietary fiber, aids in the reduction of body weight and caloric intake, improves energy balance, and decreases levels of serum lipids. In addition, RS can decrease insulin secretion and postprandial glucose control, preventing the development of diabetes 7, and is partially fermented in the colon, leading to the production of short-chain fatty acids (SCFA) 8). Native starch (NS) can present limitations for industrial use resulting from its retrogradation, syneresis, instability at an acidic pH, and unstable textures, among others 9. For this reason, the modification of NS has received attention as one means of creating functional ingredients for use in the food industry.
One modification of starch is enzymatically resistant maltodextrin (ERM), which is obtained by sequentially performing pyroconversion and enzymatic hydrolysis. ERM are low-molecular-weight compounds that reduce to sugars and that contain the α-1,4 and α-1,6 linkages and the β-1,2 and β-1,3 linkages of NS, enabling them to be partially digested 10. These compounds have low viscosity and high solubility; thus, they are used as additives in milk, juice, soups, enteral formulas, and sports and carbonated drinks 11. In addition, they act as soluble fiber, slowing the absorption of carbohydrates, as observed in postprandial glucose 12, cholesterol, and triglyceride (TG) levels in blood following intake 13. Supplementation with resistant dextrins in patients with type 2 diabetes was shown to improve IR and to reduce oxidative stress and inflammatory biomarkers. Therefore, modified starches could potentially be utilized as supplements in the food industry and as substitutes for sugar and fat 14.
Dietary supplementation with native Musa cavendish starch has demonstrated beneficial effects in rats through decreasing glycemia and dyslipidemia 15. In subjects with type 2 diabetes and obesity, this product induced body weight reduction and improved insulin response 16. Acute supplementation improved the mean blood glucose (MBG) and total glucose area under the curve (AUC) over a 48-h period in both subjects with obesity and in those with normal weight 17.
Food-industry applications require starches with certain functional and nutritional properties that meet specific needs. Unmodified NS often does not meet these needs, therefore requiring modification through chemical, physical, and biochemical methods.
The objective of the present study was to evaluate the effects of modified banana starch produced by pyroconversion and enzymatic hydrolysis on glycemic response and blood pressure (BP) in obese rats.
MATERIALS AND METHODS
CHEMICALS
Green bananas were purchased in Teapa, Tabasco, Mexico. The chemical reagents employed were of analytical grade (J. T. Baker; Phillipsburg, NJ, USA), and the enzymes were obtained from Sigma Chemical Co. (St. Louis, MO. USA). Megazyme (K-RSTAR 05/2008 Megazyme(c) International Ireland Ltd. 2008) was also used, in addition to a glucometer and reactive strips for glucose testing from Roche (Mannheim, Germany) and rat/mouse insulin Enzyme-Linked ImmunoSorbent Assay (ELISA) kits from Millipore TM (Cat. # EZRMI-13K).
STARCH ISOLATION
Bananas without peels were ground, washed (water at 40 °C with 0.3% citric acid) and sieved (no. 100 mesh). Sediments were separated and dried in an air furnace at 50 °C under atmospheric pressure for 24 h. The resulting starch was sieved (no. 100 mesh) and stored 18.
MODIFIED STARCH: PYRODEXTRINIZATION AND ENZYMATIC HYDROLYSIS
Both starch modifications were previously described 19. To modify starches, a proportion of 160:1 (w/v) starch:acid (2.2 M HCl) was used. The acid was dispersed following its reaction with starches for 16 h at ambient temperature (HAT), and the products were subsequently placed in a convection oven for one hour at 90 °C. Color was analyzed using a Chroma-meter photoelectric colorimeter and the Hunter classification system 20.
For enzymatic hydrolysis, the pyrodextrin was hydrolyzed employing the thermostable α-amylase EC. 3.2.1.1 (Sigma A-3306). The pyrodextrin was suspended in water at 30% (w/v), and the pH was adjusted to 6. The mixture was heated to 95 °C in a water bath under constant agitation. Then, 0.01% α-amylase (4,000 activity units/mL) was added based on the weight of the pyrodextrin, and the mixture was allowed to react for ten minutes. Dextrose equivalents (DE) were measured according to the Lane-Eynon method and expressed as a percentage of total starch content on a dry basis 21. The RS (pyrodextrin and maltodextrin) content was determined using a test kit (Megazyme(c) International, Ireland), following AOAC International (2002.02) and AACC International (32-40.01) guidelines.
SCANNING ELECTRON MICROSCOPY
Images of the starches were examined under a JEOL electron microscope model JSM-7610F (FESEM, USA), with 1 nm resolution, 500x magnification, a micrograph of 10.3 mm, a voltage accelerator of 5 kV, and a probe current of up to 200 nA 22.
DIFFERENTIAL SCANNING CALORIMETRY
The gelatinization temperature was determined utilizing a differential scanning calorimeter (DSC6, Perkin Elmer(tm)), with a heating rate of 10 °C min-1 for NS and 5 °C min-1 for the pyrodextrin and maltodextrin selected; heat flow ranged from 30 to 120 °C 23.
CRYSTALLINITY
The x-ray diffraction of starches was performed with a diffractometer (Bruker D8-Advance, USA) equipped with a copper source producing CuKα radiation (λ = 1.5418 Å) and operated at 40 kV and 30 mA. Measurements were taken at an angular range (2-θ) of 3° to 60°, and scan speed was 0.02° s-1. The crystallinity of the starches was determined and directly measured by plotting a curve that connected the peak baselines of the diffractograms. The ratio of the AUC was taken as the degree of crystallinity according to the following equation 24:

Where AC = crystalline area under the x-ray diffractogram
Aa = amorphous area under the x-ray diffractogram
ANIMAL ASSAY
All experimental protocols were approved by the Institutional Animal Care and Use Committee of the School of Medicine of the Autonomous University of the State of Morelos (UAEM) (approval number: 006/2015) and comply with the applicable Mexican Official Norm (NOM-062-ZOO-1999), "Technical Specifications for the Care and Use of Laboratory Animals," and with all applicable federal and institutional regulations. Twenty-five male Wistar rats were used. The production, management, and care of the rats was performed in the Animal Production, Care, and Experimental Unit (UPCEA) located in the Health Sciences Academic Department (DACS) of the Autonomous Juarez University of Tabasco (UJAT). The rats weighing 250-280 g were placed under controlled conditions of temperature (21 ± 1 °C), relative humidity (55%), and 12-h light/darkness, with free access to purified water (PW) and food, and were fed on demand a commercial 18% protein rodent diet (Harlan Teklad) throughout the experimental phase.
EXPERIMENTAL DEVELOPMENT
The experimental phase comprised two periods: a period of induction of obesity with a high sucrose diet (HSD) (for eight weeks), and a period of treatments with NS and its modified products (for four weeks). Twenty-five male Wistar rats were individually housed in cages. Following one week of adaptation, five rats received Harlan Teklad diet ad libitum and PW (negative control [NC]), and 20 rats were offered the same diet ad libitum and had 20% sucrose solution in PW (HSD) throughout the experimental period 2. After finishing the first phase (eight weeks), the 20 rats that consumed HSD were randomly divided into four groups of five animals each and were randomly assigned to one of the following experimental groups: positive control (PC), native starch (NS), pyrodextrin (PI), and enzymatically resistant maltodextrin (ERM). Rats under starch treatments (NS, PI, and ERM) were administered a corresponding dose of 0.43 g/kg of body weight, based on the dietary fiber recommendation (14 g/1,000 kcal, 20-38 g/day) for humans by gavage for four weeks 25. Both controls, that is, the NC and PC groups received only PW as placebo by the same route during this period. All of the animals received the Harlan-Teklad diet mentioned previously and the respective PW (NC) or 20% sucrose solution (PC, NS, PI, and ERM) during the last four weeks. Weight gain was monitored weekly and the water and feed consumption, daily.
PHYSIOLOGICAL TESTS
At the end of weeks 8 and 12, an oral glucose tolerance test (GTT) was performed on the rats, and their BP was measured.
For the GTT, rats were fasted for 12 h. Then, the animals were intragastrically (i.g.) administered a dose of 1 g glucose/kg body weight using a feeding needle, and blood samples were then drawn from the animal's tail at time intervals of 0, 15, 30, 60, 90, and 120 minutes. Glucose levels were determined using a glucometer. The glucose AUC curve was calculated using the trapezoidal rule, according to the following formula:

Where:

ABCG = AUC of the oral glucose tolerance test;
G0, G15, G30, G60 and G120 are the measured glucose levels.
To measure BP, a pressure sensor connected to a non-invasive blood pressure monitor (CODA(tm) Monitor, Kent Scientific Co., Torrington, CT, USA) was placed at the base of the tail. Systolic blood pressure (SBP) and diastolic blood pressure (DBP) were obtained in mmHg 26).
BLOOD SERUM ANALYSIS
At the end of the experimental treatments, the rats were anesthetized (ketamine [50 mg/kg] + xylazine [10 mg/kg], injected intraperitoneally [i.p.]) following 12 h of fasting. A cardiac puncture was performed to collect blood, and the insulin levels of the blood sera were determined using a rat/mouse kit (Millipore(tm)). Total cholesterol (TC), high-density lipoproteins (HDL), and TG were determined with a clinical chemistry system (Advia(r) 1200 Chemistry Analyzer, Bayer).
The homeostatic model assessment (HOMA) was used to quantify IR according to the following formula 27:

STATISTICAL ANALYSIS OF THE RESULTS
The resulting data for the HOMA index, BP, TC, HDL, and TG were analyzed in the Statgraphics plus ver. 5.1 statistical software package. The results were expressed as arithmetic means ± standard errors of the mean. The in vivo study was based on a randomized block design, wherein the blocks were the weights and the treatments were the diets. A one-way analysis of variance (ANOVA) was conducted for this model at a significance level of p < 0.05, and a Duncan test was applied to determine the significant differences among the treatment averages.
RESULTS
PYRODEXTRINIZATION AND ENZYMATIC HYDROLYSIS OF M. CAVENDISH STARCH
The NS yield of M. cavendish was 5.5% and the resulting RS content was 70.51%. The pyrodextrin yielded 63.84% RS and showed a minimal color difference (∆E = 7.66) with respect to NS. The ERM presented 11.04% RS and 8.90% DE.
SCANNING ELECTRON MICROSCOPY
The NS granules (Fig. 1A) were irregular in form, elongated and, in some cases, spheroidal, with a size of 11-71 μm. Figure 1B depicts the pyrodextrin: some granules were resistant to pyrodextrinization, yet the size of the granules did not change. Figure 1C reveals the loss of granular structures in ERM resulting from enzymatic treatment with α-amylase.

DIFFERENTIAL SCANNING CALORIMETRY AND CRYSTALLINITY
The thermograms of NS after pyrodextrinization and its modification into ERM are illustrated in Figure 2. The recorded gelatinization enthalpy was 12.67 J/g, while the initial, peak, and final gelatinization temperatures for native M. cavendish starch were 67.84, 73.58, and 81.59 °C, respectively. Initial (68.49 °C), peak (72.38 °C), and final (76.21 °C) temperatures slightly changed after the pyrodextrinization treatment. Following the α-amylase treatment, the ERM obtained did not demonstrate an endothermic peak identifying the gelatinization transition. This indicates a loss of granular and crystalline structure, as observed in the scanning electron microscopy (SEM) image. Crystallinity for NS was 29.12%, for pyrodextrin this was 14.72%, and for ERM, crystallinity was 8.12%.

EXPERIMENTAL MODEL
No differences were observed in food and water consumption between the HSD and NC groups during the 8-week period; however, the HSD induced higher blood glucose levels in rats in comparison with NC (p < 0.05). Glucose AUC (0-120 min) value was higher in the HSD group in comparison with the NC group (p < 0.05) (787.1 ± 1.11 vs 583.7 ± 1.5). The 2-h post-load glucose value was higher in the HSD group in comparison with NC group (118.66 ± 2.84 mg/dl vs 91.0 ± 1.23 mg/dl; p < 0.05). Also, SBP and DBP values were increased in the HSD group (p < 0.05) compared to the NC.
EFFECT OF TREATMENTS ON BLOOD SERUM PARAMETERS
Table I presents the effects of the different treatments on biochemical parameters related to glycemic and lipidic metabolism. The three starch treatments led to a decrease in the HOMA-IR index (p < 0.05) with respect to the PC, with the values of the PI and ERM groups similar to those of the NC (p > 0.05). All treatments decreased fasting glucose and insulin concentrations in comparison with PC (p < 0.05); in particular, the ERM treatment led to a glucose level comparable to that of the NC. Fasting glucose concentrations decreased by 10.0% following ingestion of PI and by 19.80% following ingestion of ERM.
Table I. Effect of native, pyrodextrinized and enzymatic hydrolyzed M. cavendish starch on biochemical parameters in serum of rats with high-sucrose diet

Data are mean ± standard error (n = 5). *,†,‡,§Different symbols mean statistical difference (p < 0.05). NC: negative control; PC: positive control; NS: native starch; PI: pyrodextrin; ERM: enzimatically resistant maltodextrin; AUC: area under the curve; TC = total cholesterol; HDL-C: high-density lipoprotein-cholesterol; TG: triglycerides.
The results obtained for lipid concentrations are also detailed in Table I. With respect to TC and HDL, differences were not observed between treatments (p > 0.05). However, in the TG serum level, a decrease (p < 0.05) was observed in the three starch treatments with respect to the PC and NC treatments (p < 0.05). In particular, the ERM group presented a lower TG concentration (p < 0.05) in comparison with the NS and PI groups.
The results of the GTT performed at the end of the experimental period are shown in Figure 3. Over the course of the tested interval, the glucose excursions of the starch-treatment groups estimated as AUC were reduced in comparison with the PC (p < 0.05). The glucose AUC (0-120 min) value in the ERM group was similar to that of the NC (p > 0.05).
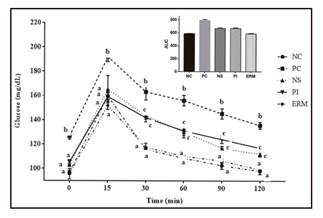
Figure 3. Effect of native, pyrodextrinized and enzymatically hydrolyzed Musa cavendish starch on glucose tolerance test in rats with high-sucrose diet. Data are mean ± standard error (n = 5). A-C. Different letters mean statistical difference (p < 0.05). NC: negative control; PC: positive control; NS: native starch; PI: pyrodextrin; ERM: enzymatically resistant maltodextrin; AUC: area under the curve.
EFFECT OF THE TREATMENTS ON BLOOD PRESSURE
The starch treatments led to lower DBP and SBP (p < 0.05) with respect to the PC (Table II). SBP decreased 61.40% in the ERM group, 60.40% in the NS group, and 59.60% in the PI group. DBP decreased 59.40% in the NS group, 50.60% in the PI group, and 42.20% in the ERM group.
Table II. Effect of native, pyrodextrinized and enzymatic hydrolyzed Musa cavendish starch on the blood pressure of rats with high-sucrose diet
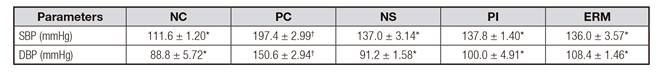
Data are mean ± standard error (n = 5). *,†Different symbols in the same rows mean statistical difference (p < 0.05). NC: negative control; PC: positive control; NS: native starch, PI: pyrodextrin; ERM: enzymatically resistant maltodextrin; SBP: systolic blood pressure; DBP: diastolic blood pressure.
DISCUSSION
Several studies have shown that native Musa cavendish starch consumption favors a decrease in glucose and lipid levels in animals and humans 15,16,17. These effects can be due to the quantity of the RS present. Even so, the use of NS in industrial and food applications presents limitations. Therefore, the modification of NS is recommendable in order to maintain the properties of its RS and for its use in practical applications 9. For these reasons, the NS of M. cavendish was pyrodextrinized and enzymatically hydrolyzed in this study to evaluate its effects on glycemia and BP in rats fed with a HSD. High sucrose intake is related to the accumulation of body fat and the development of obesity, AHT and diabetes 28. In the present study, the HSD produced an increase in DBP, SDP, and glycemia levels in rats. Similar behavior was observed in another study wherein rats undergoing the same dose and periodic administration of HSD developed IR and experienced an increase in SBP 2.
Although the pyroconversion of starch represents a promising strategy for increasing the RS fraction 29, the pyrodextrin and the ERM produced in the present study did not increase the RS content. Contrariwise, this value decreased. In this line, on employing the same conditions of the present study, 48.76% RS was reported for a pyrodextrin of Musa esculenta starch 19. In another study, native banana starch (Musa cavendish) treated with HCl (2.2 M) was reported to be resistant to acid hydrolysis. Even so, a loss of granular structure was observed, and the residues formed could have contained amorphous material, rendering the starch enzymatically hydrolyze and possibly increasing the digestion time of starch through increasing the amount of SDS. Concretely, the proportion of RS was reduced more than 70%, and the SDS increased more than 30% (30). In the present study, the amount of SDS could have similarly increased, explaining the decrease in RS. The pyrodextrinization treatment weakened the granule, although hydrolysis might not have occurred completely at the molecular level. In contrast, a granular structure did not exist in the ERM, as observed in the SEM images (Fig. 1) and thermograms (Fig. 2). Native green banana starch has a smooth and dense surface, which might partially explain its resistance to digestion. The thick outer layer of the granule likely limits enzymatic action and reduces the rate of hydrolysis, as indicated by electron transmission microscopy (ETM) studies 31. In this regard, the crystallinity of starch granules influences the RS fraction 32. A reduction in the crystallinity of modified starches indicates a loss of structural organization in a lateral direction to the semicrystalline lamellae via dextrinization. In dextrins of native maize starch, crystallinity has been found reduced, although the crystalline region of the starch was not completely destroyed; instead, the crystallites became smaller during dextrinization 33. The same effect could be taking place in the present study, as the crystallinity of the modified starches was reduced. The ERM did not exhibit an endothermic peak identifying the gelatinization transition, therefore indicating a loss of granular and crystalline structure, as observed in the SEM results. The same behavior was found for potato starch treated with diluted acids and heat (50 °C) 21.
The experimental starch treatments in rats fed a HSD led to a decrease in the HOMA-IR index. In another study in male Wistar rats fed a high-fat diet during nine weeks, the use of RS (Hi Maize(r) 260) as a carbohydrate substitute in the diet (41.6%) led to a decrease in the HOMA-IR index of treated rats with respect to the control group 34. To the contrary, the ingestion of different doses of RS type II (16% daily) in male Sprague-Dawley rats along with a moderate-fat diet (for four weeks) did not lead to changes in the HOMA-IR index. These differences may partially be explained by the different structure and administered doses of RS. In the present study, NS and its modified products decreased the hyperglycemic effect of the HSD, and the consumption of ERM even led to glucose levels similar to the NC. An exact explanation for these findings was not found; however, the dextrinization process may have produced a molecular reorganization and these indigestible polymers (maltodextrins) could have functioned as inhibitors of α-glucosidase enzymes 35. The mechanisms of how RS works remain unclear. The effect of dietary fiber in reducing energy intake and glycemic load is thought to be achieved by energy dilution and food expansion through traditional mechanisms. Energy dilution reduces the energy density of the food intake, and food expansion prevents further food intake 36. However, there are some evidences indicating that the mechanism of regulation of the blood glucose level by RS is likely related to RS fermentation in the large intestine and the production of short-chain fatty acids (SCFA). SCFA have been shown to stimulate enteroendocrine L-cells and to enhance the secretion of the anorectic hormone peptide YY (PYY, also denominated peptide tyrosine tyrosine) and the incretin glucagon-like peptide 1 (GLP-1) 37. Thus, gastrointestinal peptides are currently attracting increasing attention in terms of being the possible interpretation of the effect of RS in reducing the blood glucose level 36. The reduction in RS in the present study following pyrodextrinization and ERM formation can be attributed to the increase of SDS in the modified starches, as previously reported following the hydrolysis of native Musa cavendish with HCl (2.2 M) 30. SDS is totally absorbed in the intestine but is released slowly. At the same time, the atypical links that formed in this process might have been those that resisted enzymatic hydrolysis during the elaboration of the ERM.
A decrease in serum lipids following ingestion of RS has been reported in a previous study 38. In the present study, an increase in TG was observed following the administration of an HSD. Hypertriglyceridemia has been observed to inhibit the utilization and oxidation of glucose as a result of insulin action in peripheral tissue. The increase in TG is due to the increasing reesterification of fatty acids as a consequence of the hepatic metabolism of sucrose 39. In the present study, TG levels were reduced after the starch treatments, and those of the ERM group were even lower than those of the NC group, probably due to the atypical links formed.
In another study, the effects of ingesting native indica rice starch, as well as two physically and enzymatically modified starches, on the effects of blood glucose and TG serum levels were evaluated. In this case, the NS was hydrolyzed with α-amylase, resulting in a product with 15.3% RS and 20.2% crystallinity. The starch treatments were evaluated in streptozotocin-induced diabetic rats and were administered daily through a stomach tube at a dose of 2 g. The modified starches led to a greater hypoglycemic effect in comparison with the same proportion of NS, and the TG concentration of the group treated with RS was similar to that of the control 40. Similarly, in male Wistar rats fed non-digestible dextrin (35 g/kg of body weight) on demand during 28 days, decreases in TG serum (p < 0.05) and HDL (p < 0.001) concentrations were observed. The TG values reported in blood serum were lower than those of the present study, which may be due to the RS type and the higher administered dose 41. Thus, a relationship can be confirmed between the elevation of BP and the elevation of TC, TG and glucose levels, among others, in blood serum 42. Consequently, a decrease in these latter parameters occurred in the present study as a result of the dietary treatments, coinciding with the effects of decreasing BP.
In conclusion, the native banana starch and its modified products (pyrodextrin and enzymatically resistant maltodextrin) had beneficial effects on glycemic metabolism, insulin resistance, and blood pressure in obese rats fed a high sucrose diet. Although the modified starches presented lower resistance to digestion than the native starch, their expected properties were maintained. This is relevant because native starch must first be modified before being incorporated into foods during their processing. The changes in the structural reorganization of starch during its modification likely increase the proportion of slow digestible starch, which has favorable physiological effects. Thus, the incorporation of modified starches as ingredients in foods is a promising source of non-conventional fiber for use in special dietary regimes.

