


 Serviços customizados
 Inglês (pdf)
 Artigo em XML
 Referências do artigo
 Enviar este artigo por email
 Citado por SciELO
  Citado por Google
  Similares em
SciELO
Similares em
SciELO  Similares em Google
 Permalink
INTRODUCTION
Hospital malnutrition is a global public health problem, with a prevalence ranging from 20% to 50%, depending on the evaluation method used, the population evaluated, as well as the characteristics of the place and country where the evaluation is being performed 1,2-3. In general, malnutrition affects mainly patients with chronic non-transmissible diseases, due to the severity of the disease and the treatment used 4.
Malnutrition is related to loss of appetite, reduction of food intake, catabolism, and malabsorption of nutrients, with diverse consequences, such as decline in functional capacity and muscle function, reduction of bone mass and cognitive function, and dysfunction of the immune system, with consequent worsening of the clinical and nutritional prognosis, increased length of hospital stay, and morbidity and mortality 1,4,5. Therefore, evaluating and classifying nutritional status in patients hospitalized early can lead to a significant improvement in the previously presented conditions 6,7.
The nutritional status of the hospitalized patient can be identified by different subjective methods of nutritional screening and evaluation already validated and widely used in the hospital setting, the Patient-Generated Subjective Global Assessment (PG-SGA(r)) and the Mini Nutritional Assessment Short-Form (MNA-SF(r)), which will be highlighted here 8,9.
PG-SGA(r) is a tool used in patients with cancer or other chronic catabolic conditions and presents four sections for evaluation: nutritional screening, nutritional assessment, nutritional intervention, and monitoring of the intervention, among which it is possible to diagnose and follow-up nutritional status with accuracy and efficacy 10.
In the reduced version, the MNA-SF(r) is a nutritional screening tool that is quick, validated and sensitive, with diagnostic precision when compared to complete MNA and widely used in elderly hospitalized patients 8.
Graz Malnutrition Screening (GMS) is a new nutritional screening tool that is fast, easy to apply and encompasses a variety of pathologies. It was developed by researchers from a European university hospital, aiming to facilitate the classification of nutritional status, regardless of sex, age, and diagnosis, showing to be innovative when compared to other instruments 11.
This tool has not been validated or tested in Brazil yet, and this pilot study was based on the hypothesis that even in the original version, GMS would be able to identify the nutritional risk in the subpopulation studied. In this way, the objective was to evaluate the agreement of the GMS with subjective methods of nutritional evaluation in hospitalized patients.
MATERIALS AND METHODS
STUDY DESIGN AND SAMPLE
This is a cross-sectional descriptive study carried out at the Medical Clinic and General Surgery and Reparatory Units of a university hospital located in Vitoria, Espirito Santo, Brazil, from March to October 2017. The participants in the study were adult cancer patients (20-59.9 years) and elderly patients (≥ 60 years) regardless of diagnosis, of both sexes and who underwent nutritional status evaluation during the first 48 hours of hospital admission. Patients who were taking precautions against aerosols or those with associated cognitive or neurological changes were not included.
The independent variables such as clinical diagnosis, sex, and age (years) were consulted in the medical records and later information on nutritional status was obtained from the application of GMS, PG-SGA(r), and MNA-SF(r). Anthropometric variables such as weight (kg), height (m), and calf circumference (CC) were also measured. Weight was measured using a Tanita(r) BC533 scale with an accuracy of 100 g. Stature was obtained by means of the portable stadiometer of the brand AlturExata(r), with bilateral scale and 0.35 to 2.13 m of extension. CC was measured with an inelastic tape at the point of greatest perimeter with the individual sitting, with their leg forming a 90° angle and their feet resting on the floor 12.
The PG-SGA(r) has been applied only to cancer patients, adults, and the elderly. The MNA-SF(r) was applied only in the elderly regardless of clinical diagnosis. GMS was applied to all study participants. Thus, the PG-SGA(r) and GMS instruments simultaneously evaluated 60 patients, while the MNA-SF(r) and GMS evaluated 63 patients.
The study was approved by the Research Ethics Committee of the Federal University of Espirito Santo under the number CAAE 27954014.0.0000.5060. All patients signed the informed consent term.
NUTRITION SCREENING AND EVALUATION
Graz Malnutrition Screening (GMS)
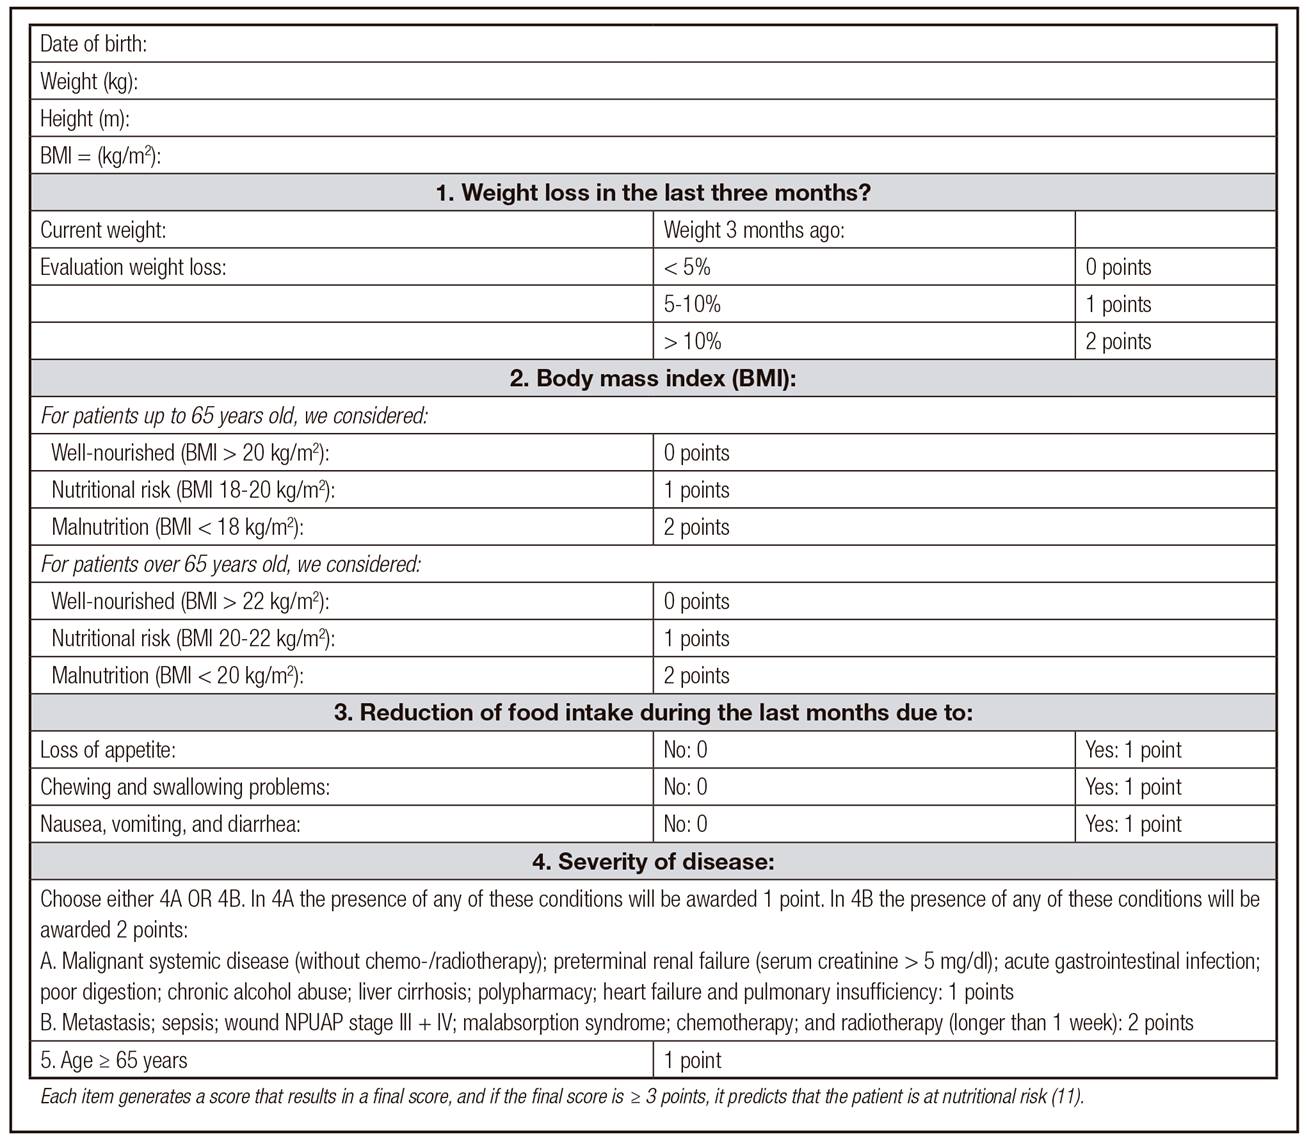
The GMS was developed to facilitate and expedite the evaluation of the patient's nutritional status, regardless of age, gender, or diagnosis. It is a new screening tool whose objective is to identify whether the individual is at nutritional risk 11. This instrument is composed of five items (Fig. 1).
Mini Nutritional Assessment Short-Form (MNA-SF(r))
MNA-SF(r) is limited to the nutritional screening process in the elderly and consists of the first part of the original version (full MNA) and contains six items of evaluation (low food intake, weight loss, psychological stress, mobility, neurological problems and CC) 8,13.
In this study, we chose to use CC measurement so that patients restricted to bed could be included. The total MNA-SF(r) score ranges from 0 to 14 points divided into three categories: well-nourished, ≥ 12 points; nutritional risk, between 8 and 11 points; and malnutrition, < 7 points.
Patient-Generated Subjective Global Assessment (PG-SGA(r))
PG-SGA(r) includes aspects of the clinical history, such as weight changes, changes in food intake, presence of gastrointestinal symptoms, changes in functional capacity, physical examination, loss of subcutaneous fat and muscle mass, presence of sacral or ankle edema, and ascites. The results are expressed in three stages: well-nourished patients (A), patients with suspected/moderate malnutrition (B), or patients with severe malnutrition ©. All the information was filled in by the researchers, due to the characteristics of the study population. In addition to the categorization of nutritional status, the PG-SGA(r) total score was also used in this study to identify the need for intervention and the nutritional risk of the patient. Patients were classified as having no nutritional risk (score 0-8 points) or with nutritional risk (score ≥ 9 points) 14. In this study, the Portuguese version of Brazil was translated and validated by Gonzalez et al. 15, with permission to use by PG-SGA/Pt-Global Platform (www.pt-global.org).
STATISTICAL ANALYSIS
A descriptive analysis was performed, expressed as means and standard deviations for the continuous variables and percentage for the categorical variables. The Kolmogorov-Smirnov test was used to verify the normality of the quantitative variables. Only the GMS score did not present normal distribution.
For data analysis, the results of the MNA-SF(r) and PG-SGA(r) were grouped into two categories. For MNA-SF(r), well-nourished patients had a score between 12 and 14 points and patients at nutritional risk and/or malnutrition had a score ≤ 11 points. Regarding PG-SGA(r), the patients were categorized as well-nourished (A) and with suspected moderate and/or severe malnutrition/malnutrition (B + C). The difference between the proportions was verified by the Fisher's exact test and Chi-square test. The kappa coefficient was calculated to verify the agreement between the nutritional diagnosis obtained by GMS when compared to MNA-SF(r) and PG-SGA(r). The categories proposed by Landis and Koch 16 were considered; according to the degree of agreement found: 0-0.1, without agreement; 0.11-0.40, weak agreement; 0.41-0.60, median; 0.61-0.80, moderate; and 0.81-1, excellent. The presence of correlation between the variables was analyzed by the Spearman correlation. The correlation coefficients may vary from -1 to +1 and be categorized as weak (r < 0.3), moderate
(r = 0.3-0.7) or strong (r > 0.7) 17. Taking the definition of MNA-SF(r) that evaluates elderly patients and the PG-SGA(r) that evaluates cancer patients, the GMS diagnostic performance measures (sensitivity, specificity, positive predictive value [PPV], and negative predictive value [NPV]). The data were analyzed with the SPSS 21.0 software, and a significance level of 5% was adopted for all tests.
RESULTS
The final sample consisted of 87 patients. The mean age of the studied population was 64.2 ± 12.0 years, 58.6% were males, and 73.6% were elderly. The most frequent clinical diagnoses were cancer and hepatobiliary diseases, which corresponded to 70% and 13.8% of the patients, respectively. The nutritional risk assessed and classified by the three screening tools applied (GMS, MNA-SF(r) and PG-SGA(r)) score was present in the majority of patients evaluated. Among the PG-SGA(r) categories, 47.1% presented suspected malnutrition or some degree of malnutrition (Table 1).
Table I. Characteristics of the sample studied
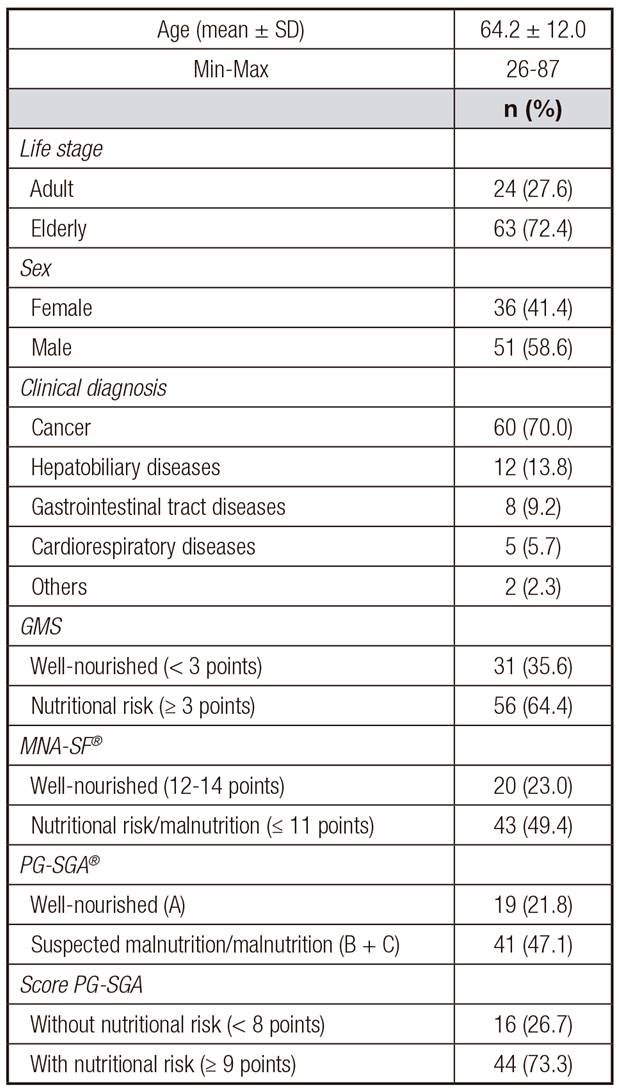
GMS: Graz Malnutrition Screening; MNA-SF®: Mini Nutrition Assessment Short Form; PG-SGAs: Patient-Generated Subjective Global Assessment.
Table 2 shows the distribution of the GMS assessment variables according to their evaluation categories. The variables weight loss in the last three months, BMI and decrease in dietary intake in the last month were associated with the nutritional risk defined by the final score of the instrument (p < 0.001).
Table II. Distribution of Graz Malnutrition Screening (GMS) evaluation variables according to their evaluation categories

BMI: body mass index.
*Chi-square test;
†Fisher Exact test.
Table III. Agreement between Graz Malnutrition Screening (GMS) and Patient-Generated Subjective Global Assessment (PG-SGA(r))
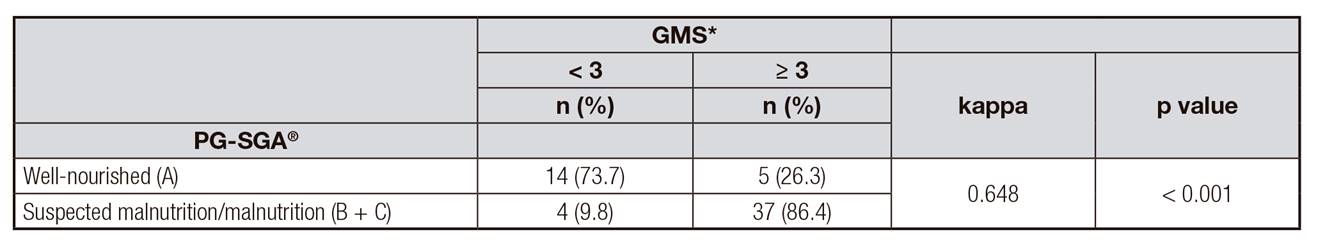
Kappa coefficient; PG-SGA(r): Patient-Generated Subjective Global Assessment.
*n = 60 patients with cancer independent of the age.
The agreement between GMS and PG-SGA(r) is described in Table 3. Moderate and significant agreement was observed between the instruments (p < 0.001). The diagnostic performance measures of GMS compared to PG-SGA(r) showed sensitivity of 90.0%, specificity of 73.0%, PPV of 88.0%, and NPV of 77.0%.
Table 4 shows the agreement between GMS and MNA-SF(r). A moderate and significant agreement between both instruments was also found (p < 0.001). In the comparison with MNA-SF(r), GMS presented sensitivity of 86.0%, specificity of 75.0%, PPV of 88.0%, and NPV of 71.0%.
Table IV. Agreement between Graz Malnutrition Screening (GMS) and Mini Nutrition Assessment Short Form (MNA-SF(r))

Kappa coefficient; MNA-SF(r): Mini Nutrition Assessment Short form.
*n = 60 elderly patients independent of the diagnosis.
The correlations between the GMS score with the MNA-SF(r) score and the PG-SGA(r) score were analyzed and are presented in Figure 2. The GMS score was inversely correlated with the MNA-SF score (r = -0.674, p < 0.001) and directly correlated with the PG-SGA score (r = 0.767, p < 0.001), respectively. Moderate and strong correlations were observed between both instruments.

DISCUSSION
Moderate concordances were found between GMS, MNA-SF(r), and PG-SGA(r), evidencing that GMS is able to predict the nutritional status of cancer patients and the elderly.
The high prevalence rates of nutritional risk and malnutrition found in this study, between 47.1% and 64.4%, are commonly observed in the hospital environment, especially for cancer patients and the elderly. A retrospective study by Kaiser et al. 18 showed that the prevalence of nutritional risk and malnutrition in hospitalized elderly patients was around 47.3% and 38.7%, respectively, according to MNA-SF(r) 18. Similar results were also observed in a study by Dent et al. 19, in which 39.0% of the elderly evaluated by MNA-SF(r) presented nutritional risk and 45.0% presented malnutrition.
The prevalence of malnutrition and nutritional risk found in this study corroborates data already available. Using the PG-SGA(r) and its score, 43.8% of the elderly with some degree of malnutrition (B or C) were classified according to the categories of PG-SGA(r) and 47.9% with nutritional risk (score ≥ 9 points) 20. Pereira et al. 21 identified 59.5% of the patients with suspected malnutrition or moderate and/or severe malnutrition and 97.6% with a score of ≥ 9 points. The diagnosis of suspected malnutrition or nutritional risk when discovered at the beginning of hospital admission is of paramount importance, since it can help patient care in improving the general picture and management of the disease and its symptoms, besides providing individualized early nutritional intervention 14.
The use of new methodologies and instruments that provide an early diagnosis of the nutritional status of hospitalized patients has been developed and used in order to avoid hospital malnutrition. Thus, GMS, proposed as a new nutritional screening tool, was able to identify more than half of the patients evaluated at nutritional risk (64.4%) when compared to PG-SGA(r) and MNA-SF(r). This result was mainly influenced by weight loss in the last three months, BMI, and decrease in food intake in the last month. These findings demonstrate the instrument's ability to assess acute changes in nutritional status and food consumption, often characteristic of cancer patients and the elderly.
The precise identification, management, and monitoring of malnutrition are essential steps in the nutritional care process, in which patient outcomes can be improved through the use of efficiently used resources 22. When compared to instruments translated and validated for the Brazilian population and widely applied in their respective target populations, PG-SGA(r) in cancer patients and MNA-SF(r) in the elderly, GMS presented moderate and significant agreement, in addition to high sensitivity, specificity, PPV, and NPV, corroborating the results found in their validation study 11.
The present study showed a correlation between the scores of the evaluated instruments, which indicates that, according to Roller et al. 11, GMS can be applied quickly, simply, and accurately by different trained health professionals. There is no single nutritional screening and screening tool recommended for both groups, although some are recognized to be more widely used. When choosing an instrument for nutritional assessment and screening, one should consider some characteristics, such as target population, site, illnesses, and size of the team responsible for this evaluation.
Although GMS has not been translated and validated for the Brazilian population as a limitation, its original version presented high sensitivity and specificity when compared to PG-SGA(r) and MNA-SF(r), proving to be a promising tool in screening for patients with nutritional risk (such as recent weight loss, altered food intake, BMI, disease severity, and age group) and the advantage of being able to be applied in the presence of several pathologies and in adults, adolescents, and the elderly 11.
Despite the small sample size, characteristic of a pilot study, and the difference in classification of the elderly population of GMS (≥ 65 years) and that used in Brazil (≥ 60 years) 23, the instrument was promising in nutritional screening in hospitalized patients. However, due to the methodological design, it is necessary to emphasize that the present work does not validate the scale for its application in clinical practice.
Thus, the inclusion of fast and practical nutritional screening tools, which will be used by the large majority of patients in a general hospital, should be tested and evaluated in order to accelerate and simplify the identification of nutritional risk in this population, to prevent and/or reduce the high rates of in-hospital malnutrition associated with increased hospital stay, morbidity and mortality, and reduced survival 24,25.
Thus, it is concluded that the results presented by this study show that GMS was sensitive in detecting nutritional risk in hospitalized patients when compared to other subjective nutritional assessment tools, besides being easily applicable in the hospital setting.

