


 Servicios personalizados
 Inglés (pdf)
 Articulo en XML
 Referencias del artículo
 Enviar articulo por email
 Citado por SciELO
  Citado por Google
  Similares en
SciELO
Similares en
SciELO  Similares en Google
 Permalink
INTRODUCTION
Obesity is a growing public health problem at a national and global level. The most recent analysis (2010) conducted by the International Association of the Study of Obesity (IASO) and the International Obesity Task Force (IOTF) reported that one billion adults worldwide are overweight and 475 million are obese 1. In Mexico, 72% of the adult population is overweight or obese 2,3. This problem has been classified as a disease that is caused by multiple factors (physiological, psychological, metabolic, genetic, socioeconomic and cultural). However, the imbalance resulting from an increase in energy intake and diminished usage is the most common cause of the accumulation of adipose body tissue 4,5,6.
Obesity is not only an accumulation of energy in the form of triglycerides that increases body fat (both subcutaneous and visceral), but also this accumulation of energy in itself, and especially at the level of the visceral adipose tissue (VAT), renders obesity a risk factor for various metabolic diseases and disease progression and mortality 6,7.
VAT is the most bioactive component that is related with the release of inflammatory mediators (resistin, tumor necrosis factor alpha [TNF-α], interleukin 1beta [IL-1β], and interleukin 6 [IL-6]), which gives rise to insulin resistance (IR), mainly local, and subsequently in liver and skeletal muscle 8,9. Resistin is a proinflammatory adipocytokine that, in humans with obesity with MS, has been reported to express contradictory results, manifesting both increased and reduced levels of concentration in blood 10.
On the other hand, it has been noted that the skeletal muscle mass (SMM) could play a central role in the development of systemic IR in obesity by reducing the effect of insulin on this, contributing to the development of the metabolic syndrome (MS) 8,11,12,13.
According to the above, in the present study we decided to address the relationship of body components with the concentration of resistin as an inflammatory marker in patients with overweight and obesity.
MATERIALS AND METHODS
STUDY POPULATION
An observational, cross-sectional and clinical study was performed with undergraduate students and adult workers from the Metropolitan Autonomous University (UAM) of Xochimilco, Mexico City, Mexico. Patients' ages ranged between 18 and 40 years, of both genders, and all were submitted to anthropometric measurements, body composition, and biochemical tests. Exclusion criteria comprised metabolic disease, infections and autoimmune disease, cancer, heart disease, and those who were pregnant or taking medications. Participants were previously informed concerning the objectives of the study and were asked to sign a letter of informed consent. All of the procedures adhered to were reviewed and approved by the Ethics Committee of the Metropolitan Autonomous University of Xochimilco.
ANTHROPOMETRIC ASSESSMENTS
The anthropometric measurements evaluated included weight, height and waist circumference (WC), following the standardized protocol of the International Society for the Advancement of Kinanthropometry (ISAK). A Seca(r) 213 stadiometer set at 0.1 cm precision was used for measurement of height. A Seca(r) Cursa Model 818 electronic scale was utilized, with an accuracy of 0.1 kg for measuring weight. WC was measured with a Seca(r) 201 fiberglass tape.
DEFINITION OF NUTRITIONAL STATUS
The formula employed to calculate body mass index (BMI) was the following: BMI (kg/m2) = weight (kg)/height (m2), for the first classification of the study participants' nutritional status, according to World Health Organization (WHO) criteria for adults. Additionally, the waist-height index (WHI) was calculated (WHI = waist circumference [cm]/height [cm]).
BODY COMPOSITION
Analysis of body composition was evaluated by electrical bioimpedance with InBody720 equipment to obtain VAT in square meters, in which ≥ 100 cm2 of fat was diagnosed in persons with visceral obesity, in addition to the percentage of subcutaneous adipose tissue (ST) and kilograms (kg) of SMM.
LABORATORY ANALYSIS AND DEFINITION OF METABOLIC SYNDROME
For biochemical tests, the participants were fasted during the previous 12 hours. Automated Institute for Clinical Experimental Medicine (IKEM) clinical chemistry was utilized for the measurement of triglycerides (TG), high-density cholesterol (HDL-c), and glucose (Glu) from a sample of peripheral blood. Blood pressure measurement was performed according to the guidelines of Mexican Official Norm (NOM-030-SSA2-1999) for the prevention, treatment, and control of hypertension, twice in each patient 14.
The definition of the Cholesterol Education National Program (ATP III), modified for Hispanics, was taken into account for the diagnosis of MS. Accordingly, the presence of three or more of the following conditions is sufficient to diagnose MS: blood pressure ≥ 130/85 mmHg; fasting glucose ≥ 100 mg/dl; triglycerides ≥ 150 mg/dl; HDL-c < 40 mg/dl for men and women; and waist circumferences ≥ 80 cm for women and ≥ 90 cm for men.
ASSAY
From each participant, a second blood sample was obtained and it was centrifuged at 1,500 rpm. Plasma was obtained and the resistin concentration was determined using a commercial Enzyme-Linked Immunosorbent Assay (ELISA) kit (Peprotech, Inc., Rocky Hill, NJ, USA).
STATISTICAL ANALYSIS
The Kolmogorov-Smirnov test was employed to explore the distribution of each variable. Logarithmic transformation was performed to approximate normality in variables exhibiting a nonparametric distribution. The results were analyzed by calculating the mean ± standard deviation (SD) and the median using confidence intervals (CI) for the values that were transformed. Comparison between two groups was performed using the Student's t-test. The one-way analysis of variance (ANOVA) and Bonferroni post-hoc test were applied to determine differences among > 2 groups. Correlation coefficients by performing step-wise forward linear and logistic regressions were obtained among variables utilizing the Pearson test. A p value of < 0.05 was considered as significant, employing SPSS statistical software program (version 21).
We do not have a large number of study subjects, however, it is enough to detect differences between increased and normal VAT according to resistin, with a power of 93.3%.
RESULTS
GENERAL INFORMATION ON THE STUDY POPULATION
The study-group population comprised 40 persons, with an average age of 27.3 ± 6.8 years. Overall, 60% (n = 24) of participants were female and 40% (n = 16) were male.
Association between nutritional status and VAT with MS and body composition
Normal BMI was observed in 28% (n = 11) of individuals, 35% demonstrated overweight (n = 14), and 37% had obesity (n = 15). On the other hand, 53% of participants had visceral obesity and 47% did not. It was observed that an increase in BMI was related with an increase in VAT; high VAT was observed in 9% of individuals with normal BMI, in 36% of people with overweight, and in 100% of participants with obesity.
An increase in anthropometric measurements (WC and WHI), body composition (ST, VAT, and SMM), biochemical indicators (Glu, TG) and systolic (SBP) and diastolic blood pressure (DBP) was observed in persons with obesity in relation to individuals with normal weight. HDL-c did not exhibit this behavior, because it decreased as BMI values increased. Regarding resistin as an inflammatory parameter, blood concentration demonstrated no statistical difference in relation to BMI (Table 1).
Table I Distribution of the anthropometric variables, body composition, biochemical parameters and resistin of the study groups according to BMI

BMI: body mass index; WC: waist circumference; WHI: waist-height index; ST: subcutaneous adipose tissue; VAT: visceral adipose tissue; SMM: skeletal muscle mass; TG: triglycerides; HDL-c: high-density lipoprotein cholesterol; Glu: glucose; SBP: systolic blood pressure; DBP: diastolic blood pressure. p (post hoc): p value adjusted with Bonferroni test. Data are presented in media ± SD or median and CI. *Statistically significant difference vs normal. †Statistically significant difference vs overweight.
When anthropometric measurements, body composition, and biochemical parameters were analyzed in relation to the presence of visceral obesity, it was found that in persons with normal VAT all variables were lower than in individuals with increased VAT. HDL-c concentration was again the exception, because persons with increased VAT had lower values compared with those with normal VAT. No modifications were found in SBP and DPB in relation to VAT. According to blood levels of resistin, people with increased VAT had higher concentrations (405.2 ± 56.6, p < 0.022) than persons with normal VAT (257.6 ± 23.2) (Table 2).
Relation between metabolic syndrome, BMI and visceral obesity
Table II Characteristics of the anthropometric variables, body composition, biochemical indicators and resistin of the groups according to visceral obesity
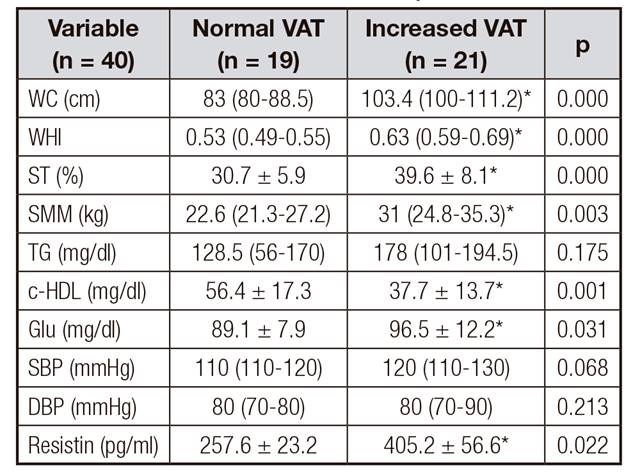
WC: waist circumference; WHI: waist-height index; ST: subcutaneous adipose tissue; VAT: visceral adipose tissue; SMM: skeletal muscle mass; TG: triglycerides; HDL-c: high-density lipoprotein cholesterol, Glu: glucose; SBP: systolic blood pressure; DBP: diastolic blood pressure. p (post hoc): p value adjusted with Bonferroni test. Data are presented in media ± SD or median CI. *Statistically significant difference vs normal VAT (p < 0.05).
According to the ATP III criteria for Hispanics, 35% (n = 13) of the individuals studied had MS, and 65% (n = 27) did not. On the other hand, according to BMI, a higher percentage of individuals with MS had obesity (60%, p < 0.012). Individuals without MS were mostly persons who demonstrated normal BMI (91%)
(Fig. 1).

Figure 1 Metabolic syndrome in relation to BMI (Dx of BMI: diagnosis according to body mass index; Dx of MS: diagnosis according to metabolic syndrome; N: normal; Ow: overweight; Ob: obesity). *Statistical difference between presence and absence of MS according to BMI. p < 0.012.
With respect to VAT, it was observed that a higher percentage (77%) of individuals with MS exhibited increased VAT and a lower proportion of normal VAT (23%, p < 0.031). The higher percentage of adults without MS demonstrated normal VAT (59%) (data not shown).
Relation between MS, anthropometric assessments and body composition
The relationship between MS diagnosis and anthropometric measurements and body composition was analyzed. This analysis revealed that MS is related to increases in all measurements; thus, individuals without MS had lowest values and persons with MS, highest values. Nevertheless, no changes were found in blood levels of resistin according to the MS (Table 3).
Table III Characteristics of anthropometric variables, body composition and resistin in the study groups according to metabolic syndrome
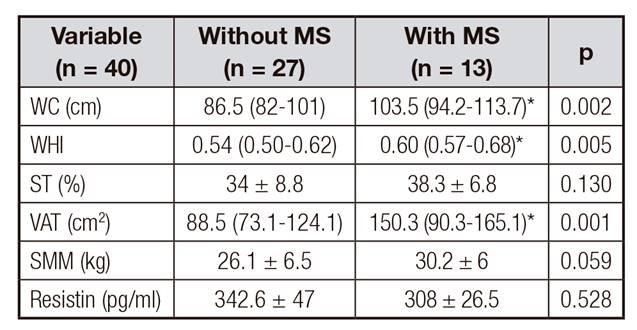
MS: metabolic syndrome; WC: waist circumference; WHI: waist-height index; ST: subcutaneous tissue; VAT: visceral adipose tissue; SMM: skeletal muscle mass. Data are presented in media ± SD or median and CI. *Statistically significant difference (p < 0.05).
Additionally, increased VAT was related to changes in anthropometric variables and body composition (WC, WHI, ST, and SMM) in patients with or without MS. All of these differences were statistically significant, except for SMM in persons who did not have MS, and for ST in persons who did present MS (Table IV).
When the resistin concentration was analyzed with respect to the presence or absence of MS and according to VAT, we observed that resistin showed a significant increase in individuals without MS and with increased VAT (p < 0.012) as compared to those with normal VAT (Table 4).
Table IV Distribution of anthropometric variables, body composition and resistin in presence or absence of metabolic syndrome and the normal and increased VAT in the study groups

MS: metabolic syndrome; N VAT: normal visceral adipose tissue; I VAT: increased visceral adipose tissue; WC: waist circumference; WHI: waist-height index; ST: subcutaneous tissue; SMM: skeletal muscle mass. Values are presented in media ± SD or median and CI. *Statistically significant difference among normal vs. increased VAT p < 0.05.
Lineal regression between VAT and SMM considering metabolic syndrome
Based on the aforementioned results, higher SMM was perceived in individuals with MS and increased VAT, compared with individuals with MS but normal VAT. We decided to conduct a correlation between VAT and SMM in general population, where we observed that increased VAT correlated with greater SMM. A positive correlation between VAT and SMM in patients with MS was also found; however, when these same parameters were analyzed in individuals without MS, no correlation was found (Fig. 2).

Figure 2 Correlation between VAT and SMM in the study groups (VAT: visceral adipose tissue; MS: metabolic syndrome; SMM: skeletal muscle mass).
In addition, to observe the relationship between VAT and SMM, a linear regression in general population (n = 40) and in participants with MS (n = 12) was performed, and a statistical significance was observed in both regressions. Taking the entire population into account, we perceived that an increase of 1 kg of SMM was associated with an increase of 3 cm2 (range, 1.1-5) of VAT (p < 0.002) and, in persons with MS, an increase of 1 kg of SMM was associated with an increase in VAT of 4 cm2 (range, 1-7) (data not shown).
Logistic regression between MS and SMM with VAT and resistin
A logistic regression was also estimated to establish the relationship between MS (dependent variable) and SMM, and VAT and resistin (independent variables). We observed, in a first model, that a 1-cm2 increase of VAT was related with higher odds (2.7, range: 0.4-5) for acquiring MS (p < 0.023) for different values of SMM. In a second model, VAT, SMM and resistin were analyzed, and the results showed that a 1-cm2 increase of VAT contributed higher odds (3.3, range: 0.7-5.9) for developing MS (p < 0.013) for different values of SMM and resistin (data not shown).
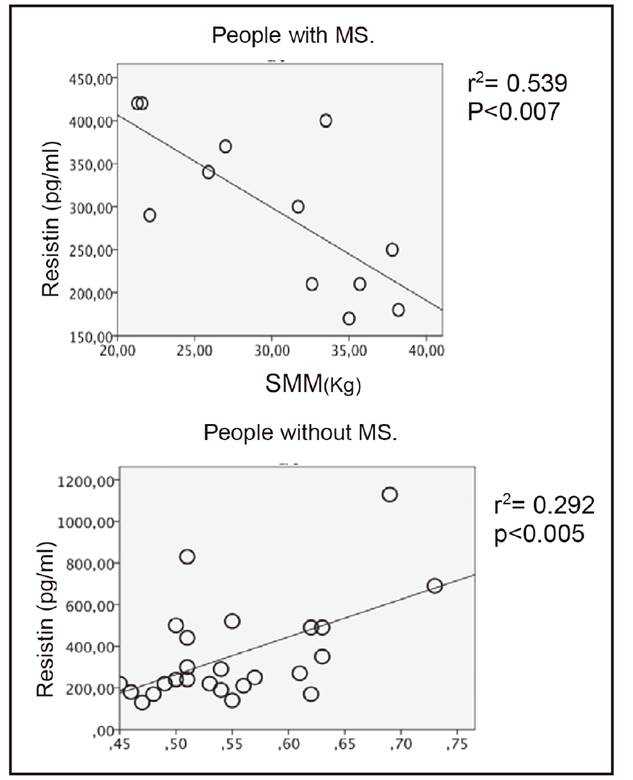
When examining this adipocytokine in terms of anthropometric measurements in individuals with and without MS, we found that the blood concentration of resistin in individuals without MS had a statistically significant positive correlation with WHI. Additionally, resistin had a statistically significant negative correlation with SMM in patients with MS (Fig. 3).
DISCUSSION
Obesity is the main risk factor for developing comorbidities such as dyslipidemia, hyperglycemia, hypertension and IR, among others, as well as presenting anthropometric and body composition changes, mainly VAT distribution. The latter is categorized as the trigger factor of the aforementioned diseases 15,16,17.
According to our results, we observed that, as BMI and VAT increased, anthropometric measurements, body composition, and biochemical indicators were altered. It was also noteworthy that persons with obesity and increased VAT had the highest proportions of MS. These data were, to a certain degree, expected, as it has been reported that obesity involves increased VAT, negatively affecting biochemical, anthropometric, and body composition indicators, which are all-important for diagnosing a person with MS. This demonstrated an association between visceral obesity and the presence of MS 17.
In the present investigation, important findings were obtained in which an increase in SMM is related with increased BMI and with the presence of increased VAT. When SMM was analyzed according to the presence or absence of MS and, in turn, it was stratified according to normal and increased VAT, it was observed that individuals with MS and increased VAT demonstrated more kg of SMM, this indicating that increased VAT is an important factor for the presence of SMM in persons with MS.
Some authors support the notion that not only abdominal obesity plays an important role in the development of MS and that, in general terms, obesity may perhaps not be expressed in terms of BMI, but that SMM also comprises an important component 11. SMM is the main contributor to glucose uptake (about 75%) from insulin 18, displaying the importance of this tissue in the presence of IR and subsequent morbidities. In this regard, it has been proposed that the proportion of skeletal muscle could possess an important role in the progression of MS 19.
In the population of the present study, we found that a 1-kg increase of SMM is associated with an increase of 3 cm2 (range, 1.1-5) of VAT, and that in individuals with MS, a 1-kg increase of SMM is associated with an increase of 4 cm2 (range, 1-7) of VAT. This demonstrated the close relationship between SMM and VAT and the development of MS, considering SMM as a factor that goes hand-in-hand with VAT for the development of MS. In this respect, it has been observed that inflammatory mediators such as the TNF-α, IL-1β, and IL-6 that are released by VAT, and other cells, as well as free fatty acids, contribute to local IR, but can escape from the circulation and contribute to systemic IR through reducing the insulin signal in various organs such as skeletal muscle 12,19,20. The latter is damage that precedes the development of MS, and these two tissues could represent a risk factor for metabolic diseases.
It was mentioned that muscle is a site of cytokine release in obesity, also called miokines 13,20. In a proteomic in vitro study in muscle fibers (C2C12 myotubes) in which IR was induced, it was found that the muscle is capable of releasing about 1,073 putative proteins (32 growth factors, 25 cytokines, and 29 metalloproteinases), of which approximately 40% were regulated under conditions of IR 13.
In addition, in this study, we decided to study the blood concentration of resistin. A tendency toward increased concentrations related to the BMI was detected, but this was significantly elevated in persons with increased VAT. Data analysis, according to the presence or absence of MS and stratified with normal and increased VAT, revealed a significant increase in resistin concentration in individuals without MS and increased VAT compared to those without MS and normal VAT. Resistin is a proinflammatory cytokine associated with inflammatory markers (TNF-α and IL-6) that affect metabolism 21,22,23,24,25,26,27. Several authors have suggested that increased levels of serum resistin are linked with visceral fat, IR, inflammatory markers (TNF-α and IL-6), myocardial infarction, and atherosclerosis. These authors suggest that resistin levels could serve as a surrogate marker for metabolic diseases in humans 22,27,28. However, in the present study this was associated in individuals with VAT and increased VAT without MS. This could mean that in our patients, resistin should be taken as a predictor of metabolic damage. Further studies are needed for monitoring and to confirm its role.
In addition, a significant positive correlation between WHI and resistin in individuals without MS was observed. Some authors have linked this index with cardiovascular and metabolic risk 29,30,31. It is probable that this finding could also be a predictor of metabolic disorders and cardiovascular disease.
Some studies have suggested a proinflammatory role of resistin, and a positive relationship has been found between blood concentrations of resistin with body weight, fat mass, blood lipids, as well as inflammation markers, both in obese patients and in obese morbid patients 32,33. However, there are others who do not relate this adipocytokine with the presence of metabolic disorders, or obesity, or IR, or the MS 25,26,34,35,36. In the present study, a high concentration of resistin in persons without MS, and a positive correlation with increased VAT and WHI were found. This, in a certain manner, confirms the previous results of several studies, indicating the presence of controversy among levels of resistin in obesity, IR and MS 21,26,34,37.
CONCLUSION
With these results, we can state that increased VAT in patients with obesity is probably the most important factor for the development MS, moreover highlighting the importance of SMM in the presence of MS.
We also observed an association between resistin and increased VAT, SMM and MS. These results support the notion that resistin might be acting as an inflammatory adipocytokine, contributing to the increase in frequency of MS in those persons who present increased levels of this cytokine.
However, this finding emphasizes the need to conduct further studies related to the presence of SMM, resistin, and other inflammation markers in a greater number of individuals with obesity in order to corroborate the results presented herein.

