


 Custom services
 English (pdf)
 Article in xml format
 Article references
 Send this article by e-mail
 Cited by SciELO
  Cited by Google
  Similars in
SciELO
Similars in
SciELO  Similars in Google
 Permalink
INTRODUCTION
Glucose levels are tightly controlled through a complex pathway of regulatory mechanisms involving multiple tissues and organs. Alteration of normal glucose homeostasis and substantial elevations of fasting glucose are hallmarks of diabetes mellitus type 2 (DM2) and result from a sustained reduction in pancreatic beta-cell function and insulin secretion. Insulin resistance is another situation that is involved in the elevation of blood glucose levels. However, there is important variation in fasting glucose levels even within healthy populations, and one third of this variation is genetic 1.
Melatonin is related to the development of diabetes mellitus type 2 by influencing endogenous glucose production and insulin secretion 2. The effect of melatonin is mediated by two membrane receptors, including melatonin receptor 1 (MT1, encoded by MTNR1A) and melatonin receptor 2 (MT2, encoded by MTNR1B). MTNR1B is expressed in diencephalon, human retin, pancreatic islets and beta cells 3. Common genetic variants within MTNR1B were associated with higher fasting glucose levels or increased risk of diabetes mellitus 4. The single nucleotide polymorphism (SNP) rs10830963 is the variant with the strongest association; it is located in the single intron (11.5 kb) of MTNR1B. A meta-analysis revealed that rs10830963 3 is associated with an increased risk to develop diabetes. The association with fasting glucose levels was replicated in three studies on European populations 5,6,7. Moreover, in non-diabetics subjects an association of rs10830693 with impaired insulin secretion stimulated by glucose has been identified 5. The risk allele G was also associated to impaired early insulin secretion and beta cell dysfunction that might produce the increase risk of DM2.
On the other hand, adipose tissue is considered as an endocrine organ. Many proteins produced by adipose tissue, named adipokines, have been described (leptin, adiponectin and resistin). Besides, adipose tissue plays a major role in the development of metabolic syndrome (MetS) 8. As far as we know, there are no studies evaluating the relationship of this polymorphism with serum adipocytokine levels, total body fat mass and different components of MetS.
The lack of information about the relationship between this rs10830693, MetS and serumadipokine levels in Caucasian populations gave us the aim of the present investigation: describing the association of this SNP with serum adipokine levels, fasting glucose levels, diabetes mellitus and components of MetS.
MATERIALS AND METHODS
SUBJECTS
One thousand and two obese subjects (body mass index ≥ 30) were recruited consecutively from Primary Care physicians from the urban area of Valladolid (northwest of Spain). None of the subjects was taking glucocorticoids or antineoplasic drugs nor had had a history of cardiovascular disease, thyroid disease, malignant tumor or major surgery during the previous six months. The Institutional Review Board (HCUVA Committee) approved the study and it was performed according to the guidelines laid down in the Declaration of Helsinki. All participants provided written informed consent.
PROCEDURES
Weight, height, body mass index (BMI), fat mass by bio impedance and waist and hip circumference were included as anthropometric parameters. Resting blood pressure was measured.
Venous blood samples were collected in EDTA-treated and plain tubes after a 12-hour overnight fast for analysis of insulin, total cholesterol, LDL-cholesterol, HDL-cholesterol, triglycerides and adipokines (leptin, total adiponectin and resistin). To estimate the prevalence of metabolic syndrome, the definitions of the ATPIII were considered 9, and the American Diabetes Association criteria were considered 10 for the estimation of the prevalence of diabetes mellitus. The genotype of MTNR1B gene polymorphism (rs10830693) was studied.
BLOOD PRESSURE AND ANTHROPOMETRIC PARAMETERS
Mean systolic and diastolic blood pressures were calculated by averaging three measurements (Omrom, LA, CA). Body weight and height were measured in the morning while the subjects were unclothed. They were measured to an accuracy of 0.1 kg with a calibrated weight (Omrom, LA, CA) and a stadiometer 1 mm (Omrom, LA, CA), respectively. BMI was calculated as body weight (in kg) divided by height (in m2). Circumferences of waist (narrowest diameter between xiphoid process and iliac crest) and hip (widest diameter over greater trochanters) were measured while the subjects were standing after normal expiration, and waist-to-hip ratio (WHR) was calculated, too. Bio impedance was used to determine body composition with an accuracy of 5 g 11 (EFG, Akern, It).
BIOCHEMICAL PROCEDURES
Fasting venous blood samples were taken for measurements of fasting glucose, total cholesterol, triglyceride, low density lipoprotein cholesterol (LDL) and high density lipoprotein cholesterol (HDL) using a biochemical auto-analyzer (Hitachi 7060, Tokyo, Japan). LDL cholesterol was calculated using the Friedewald formula 12. Fasting insulin was determined by radio-immunoassay method (RIA) (RIA Diagnostic Corporation, Los Angeles, CA) with a sensitivity of 0.5 mUI/l (normal range 0.5-30 mUI/l) 13. We calculated the homeostasis model assessment of insulin resistance (HOMA-IR) (HOMAIR = [insulin x glucose]/22.5) 14 and the homeostasis model assessment of pancreatic beta cell function (HOMA-B) by using HOMA calculator version 2.2 15. C-reactive protein (CRP) was measured by immunoturbimetry (Roche Diagnostics GmbH, Mannheim, Germany), with a normal range of 0-7 mg/dl and analytical sensitivity 0.5 mg/dl.
ADIPOKINES PROCEDURES
Resistin was measured by ELISA (BioVendor Laboratory, Inc., Brno, Czech Republic) (RD191016100) with a sensitivity of 0.2 ng/ml, a normal range of 4-12 ng/ml 16 and a CV% of 3.2%. Leptin was measured by ELISA (Diagnostic Systems Laboratories, Inc., Texas, USA) (DSL1023100) with a sensitivity of 0.05 ng/ml, a normal range of 10-100 ng/ml and a CV% of 3.5% 17. Adiponectin was measured by ELISA (R&D systems, Inc., Mineapolis, USA) (DRP300) with a sensitivity of 0.246 ng/ml, a normal range of 8.65-21.43 ng/ml and a CV% of 3.8% 18.
GENOTYPING OF MTNR1B GENE POLYMORPHISM
Genomic DNA was extracted from 5 ml whole blood by using commercial kit extraction (Biorad, LA, CA) according to the manufacturer's protocol. Primers were designed with the Sequenom Assay Design v4 (SEQUENOM, Inc., San Diego, California CA). Genotyping for the rs10830963 polymorphism was performed by polymerase chain reaction real time analysis. This polymerase chain reaction (PCR) was carried out with 20-25 ng of genomic DNA, 0.1-0.15 µl each of oligonucleotide primer for rs10830963 (primer forward: 5?- ACGTTGGATGCCCCCAGTGATGCTAAGAAT -3? and reverse 5?- ACGTTGGATGGCATAGGCAGAATATTCCC -3?) in a 2-µl final volume (Thermal Cycler Life Technologies, LA, CA). DNA was denatured at 85 °C for five minutes; this was followed by 45 cycles of denaturation at 95 °C for 15 seconds, and annealing at 58.1 °C for 45 seconds. The PCRs were run in a 2-µl final volume containing 0.1 µl of iPLEx Termination mix (Bio-Rad(r), San Diego, CA) with hot start Taq DNA polymerase. The Hardy-Weinberg equilibrium was calculated with a statistical test (Chi-square). The variant of the MTNR1B gene was in the Hardy-Weinberg equilibrium (p = 0.28).
STATISTICAL ANALYSIS
All data were analyzed using SPSS for Windows, version 15.0 software package (SPSS Inc. Chicago, IL). Sample size was calculated to detect differences over 3 mg/dl of fasting glucose levels with 90% power and 5% significance (n = 1,000). The results were expressed as average ± standard deviation. Variables were analyzed with the ANOVA test (for normally-distributed variable) or Kruskal-Wallis test (for non-normally-distributed variable). Logistic regression analyses adjusted by age, gender and BMI were used to calculated odds ratio (OR) and 95% confidence interval (CI) to estimate the association of the rs10830963 SNP with the risk of metabolic syndrome and diabetes mellitus. All analyses were performed under an additive genetic model with rs10830963 G-allele as the risk allele. A p-value under 0.05 was considered as statistically significant.
RESULTS
One thousand and two obese subjects were enrolled in the study. The mean age was 46.8 ± 10.1 years (range: 26-66) and the mean BMI was 36.5 ± 5.1 kg/m2 (range: 31.1-41.2). Gender distribution was 731 women (73.0%) and 271 men (27.0%). In total, 512 patients (51.1%) had the genotype CC, 417 patients had genotype CG (41.6%) and 73 patients, genotype GG (7.3%). Age was similar in the three genotype groups (CC; 46.1 ± 9.2 years vs CG; 46.9 ± 10.8 years vs GG; 46.6 ± 9.1 years: ns). Gender distribution was similar in all genotype groups (CC; 31.8% males vs 68.2% females vs CG; 29.4% males vs 70.6% females vs GG; 27.0% males vs 73.0% females: ns).
Applying and additive genetic model, no significant association was found between rs10830693 G-allele and fat mass, weight, waist circumference, hip to waist ratio and BMI. Systolic pressures and diastolic pressures were similar in all genotype groups (Table 1).
Table I Anthropometric variables and blood pressure
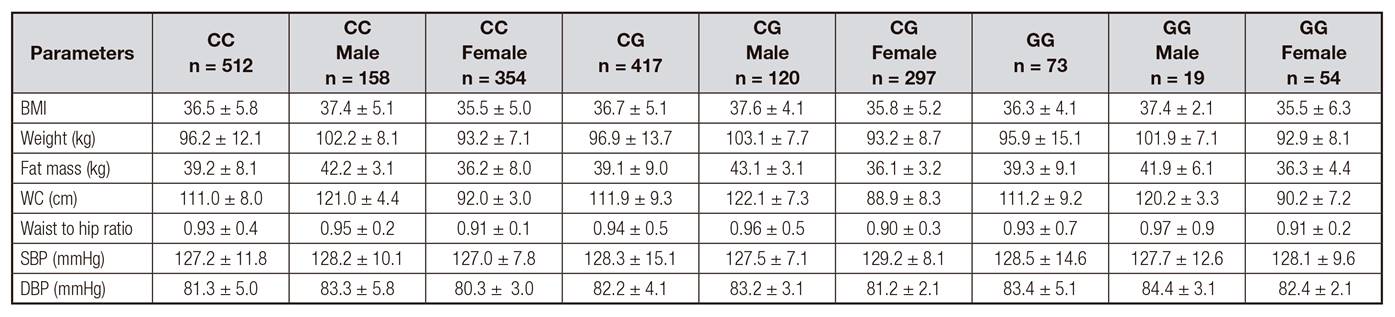
BMI: body mass index; DBP: diastolic blood pressure; SBP: systolic blood pressure; WC: waist circumference. No statistical differences among genotypes.
Biochemical characteristics according to genotype are shown in table 2. Fasting glucose levels (GG: 101.5 genotype ± 19.1 mg/dl vs GT: 103.5 ± 8.1 units vs TT: 107.2 ± 8.0 mg/dl; p = 0.01) and HOMA-IR (GG: 3.1 ± 1.6 units vs GT: 3.4 ± 1.1 units vs TT: 3.7 ± 1.0 units; p = 0.02) were higher in subjects with GG genotype than GC or CC genotypes. Serum adipokine levels and C reactive protein are shown in table 3. Total adiponectin levels (CC: 20.5 ± 8.4 ng/dl vs CG: 21.8 ± 5.4 ng/dl vs GG: 15.4 ± 1.4 ng/dl; p = 0.02) and HOMA-B (CC: 2.3 ± 0.8 units vs CG: 2.2 ± 1.1 units vs GG: 1.9 ± 0.9 units; p = 0.01) were lower in subjects with GG genotype than in GC or CC genotypes.
Table II Biochemical parameters (mean ± SD)
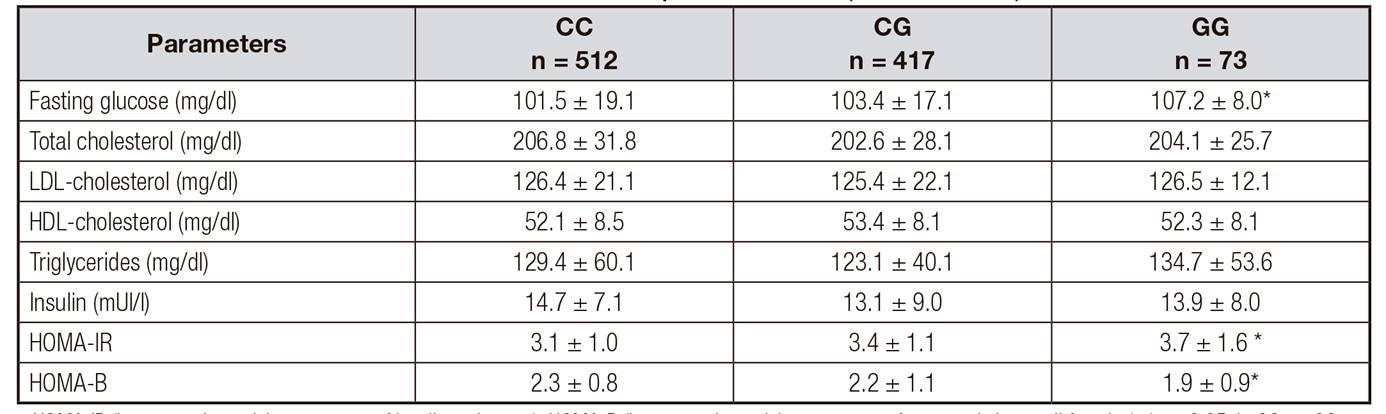
HOMA-IR (homeostasis model assessment of insulin resistance); HOMA-B (homeostasis model assessment of pancreatic beta cell function); *p < 0.05, in GG vs. CG genotype and GG vs. CC.
Table III Serum adipokine levels and C reactive protein (mean ± SD)

C reactive protein. p < 0.05 in GG vs. CG genotype and GC vs. CC.
According to the results of demographic and metabolic characteristics, the percentage of individuals who had metabolic syndrome (MetS) was 46.2% (462 patients) and of patients without MetS, 53.8% (n = 540 patients). The percentage of subjects with metabolic syndrome or some components of MetS (central obesity, hypertriglyceridemia, hypertension or hyperglycemia) is shown in table 4. Logistic regression analysis indicated that subjects with GG genotype were not associated with an increased risk of MetS (OR = 0.96, 95% CI = 0.75-1.36, p = 0.13). However, logistic regression analysis showed an increased risk of hyperglycemia (OR = 1.31, 95% CI = 1.12-2.78, p = 0.03) after adjusting by BMI, age and sex. The association of other metabolic syndrome criteria was no significant (central obesity [OR = 1.38, 95% CI = 0.96-2.12, p = 0.38], hypertriglyceridemia [OR = 1.26, 95% CI = 0.83-3.25, p = 0.51], low HDL cholesterol [OR = 1.69, 95% CI = 0.75-3.18, p = 0.48] and hypertension [OR = 2.12, 95% CI = 0.48-4.55, p = 0.67]).
Table IV Metabolic syndrome, components of MetS and diabetes mellitus

The cutoff points for the criteria of; central obesity (waist circumference > 88 cm in female and > 102 in male), hypertension (systolic BP > 130 mmHg or diastolic BP > 85 mmHg or specific treatment), hypertriglyceridemia (triglycerides > 150 mg/dl or specific treatment) or hyperglycemia (fasting plasma glucose > 110 mg/dl or drug treatment for elevated blood glucose). Diabetes mellitus by American diabetes Association (ref 10).*p < 0.05, in GT vs. GG genotype. *p < 0.05, in GG vs. CG genotype and GG vs. CC.
Hyperglycemia criteria in the ATPIII definition was defined as fasting plasma glucose ≥ 110 mg/dl or drug treatment for elevated blood glucose. The relationship of diabetes mellitus as defined by the ADA criteria 10 with this SNP was analysed with a logistic regression model. This logistic regression analysis showed an increased risk of diabetes mellitus (OR = 1.37, 95% CI = 1.14-2.86, p = 0.04) after adjusting by BMI, age and sex.
DISCUSSION
The main result of this study was the finding that the GG genotype of SNP (rs10830963) of the MTNR1B gene was associated with higher fasting glucose levels, HOMA-IR, HOMA-B, total adiponectin levels and risk of diabetes mellitus in obese subjects.
This common genetic variant of melatonin receptor has been reported to be associated with increased fasting glucose levels in several populations 7,19. Melatonin is produced by the pineal gland, but it is also released from the gastrointestinal cells 20. Melatonin reaches and penetrates in cells and, in addition controlling circadian rhythm 21. Several studies have reported a link between disturbances of circadian rhythm and metabolic diseases, including diabetes mellitus 22, as well as an important relationship between insulin and melatonin levels 23. Two melatonin subtype receptors (MTNR1A and MTNR1B) mediate the effects of melatonin and these receptors are located in human pancreatic cells 24. A negative correlation between MTNR1B mRNA levels and insulin secretion has been reported, and mRNA levels are increased in carriers of rs10830963 25. The fact that MTNR1B is expressed in the Beta-cells implies that the gene variant might affect insulin release and/or glucose sensing 3. Consequently, this impaired glucose regulation could induce increased fasting glucose levels. This prediabetes situation, characterized by high blood glucose levels, impaired insulin secretion and insulin resistance, could develop diabetes. Here, in our study, we have described that rs10830963 of MTNR1B that are associated with type 2 diabetes mellitus produced an increased risk of hyperglycemia as a component of the metabolic syndrome.
Our work has many points that differentiate it from previous studies existing in the literature. For example, we found that the association between rs10830963 G-allele and fasting glucose levels remained after adjustment for BMI. Our results indicated that this genetic variant contributes to elevated fasting glucose levels independently of degree of adiposity, as it had been reported in some European populations 3. Secondly, it was also found that GG genotype of rs10830963 was associated with increased insulin resistance (HOMA-IR) and reduced beta cell function (HOMA-B). Some previous studies observed that the G-allele of rs10830963 that leads to increased glucose level was associated with reduced pancreatic cell function (HOMA-B) as shown in our study 26. However, in our study the polymorphism had a significant effect on insulin resistance (HOMA-IR) and adiponectin levels, too. Since the MTNR1B gene is expressed in pancreatic beta cells, the direct regulation of beta cell function was involved to be an important pathway for the increased fasting glucose effect of this SNP. However, the role of rs10830963 in insulin resistance and adiponectin remained unknown. Sparso et al. 7 demonstrated, in subjects with the MTNR1B risk allele, a reduced suppression of hepatic glucose production during a hyperinsulinemic-euglycemic clamp documenting hepatic insulin resistance. The extent to which hepatic insulin resistance contributes to the elevated FPG level in carriers of the risk alleles is uncertain. Perhaps, circulating adiponectin modulates hepatic insulin resistance 27 and G allele risk could be related to the secretion or action of adiponectin. A clinical study supported a similar view and showed that an increased adiponectin level could help restore hepatic insulin resistance in obese women 28. In other animal study, secretion of wild type adiponectin was employed 29 and caused insulin sensitization when expressed in either liver 29 or adipose tissue 30. The associ ation of this risk allele of rs10830963 with some typical insulin resistance clinical entities has been also described in pregnancy. Increased adiposity and increased insulin resistance characterize pregnancy. Rosta et al. 31 observed a statistical association between risk G allele of rs10830963 and prevalence of gestational diabetes. Finally, Ling et al. 32 reported that other SNP of the MTNR1B gene (rs3781637) is associated with total cholesterol and LDL-cholesterol. Taking into account all these data, the genetic variant of the receptor seems to be involved not only in the control of basal glycaemia, but also in other metabolic components related to type 2 diabetes mellitus. In order to explain all these physiological relationships, Garaulet et al. 33 have recently described that the effect of melatonin on glucose tolerance depends on the genotype. MTNR1B risk allele worsens the effect of melatonin on glucose tolerance (basal glucose and glucose under the curve). These data situate this receptor and its variants in an interesting situation to explain metabolic alterations in patients with obesity.
Our study has certain limitations. Firstly, many uncontrolled non-genetic factors such as exercise and diet could influence the relationships found with our design. Secondly, we only analysed one SNP of MTNR1B gene, so other genetic variants could be related with all these parameters. Finally, our population comprised a sample of adult obese patients and the age and BMI range could modulate the relation of this genetic variant; specific ethnicity relationships of this SNP has been previously described.
To conclude, this study showed that the MTNR1B rs10830963 polymorphism was associated with increased fasting glucose levels, HOMA-IR, and risk of DM2. In addition, this SNP was associated with decreased adiponectin levels and HOMA-B. Further studies are needed to elucidate this complex relationship among G allele of rs10830963, insulin secretion, insulin resistance and adiponectin.

