


 Custom services
 English (pdf)
 Article in xml format
 Article references
 Send this article by e-mail
 Cited by SciELO
  Cited by Google
  Similars in
SciELO
Similars in
SciELO  Similars in Google
 Permalink
INTRODUCTION
According to the World Health Organization (WHO), all breast-fed and small children can reach an optimal height, weight and degree of development to satisfy their genetic potential as long as favorable conditions exist 1. To reach these objectives, it is essential to offer adequate complementary feeding at this point in life. Complementary foods are beverages and foods that are rich in nutrients that must be introduced after the first six months of a child's life 2 with the aim of facing the changing needs of nutrients that a breastfed child has (iron, zinc, and others) and to prepare them for eventual weaning 3. Despite its importance, it is estimated that few children receive complementary foods that are nutritionally adequate and safe. In many countries, less than a quarter of breastfed children of six to 23 months of age meet the criteria of diversity and frequency of adequate nutrition that they should receive 4. Evidence shows that children who do not receive sufficient dietary diversity and who do not follow an adequate feeding frequency after six months of age have stunting 5,6.
In Mexico, in the last National Health Survey, 75% of the people surveyed introduced foods before six months, particularly urban families with better living conditions, while families with less resources and who live in rural areas more commonly introduced foods after six months 7. A study carried out in 2016 in rural communities of Hidalgo, which included 189 children of one to 24 months of age, reported inadequate child feeding practices such as the introduction of foods at three months of age and a non-diverse diet in children of six to 24 months of age. The greatest proportion of low diversity was seen in the seven to 12 months of age group (57.1%). In addition, a trend of stunting with increasing age (6.3% in children of one to six months of age, 13.3% in children of seven to 12 months of age, and 17.2% in children 13 to 24 months of age) was discovered 8.
On the other hand, the inadequate perception of a child's weight and health can condition the type and amount of foods that are introduced. A study carried out in 486 Mexican children of less than one year of age reported that mothers tend to underestimate their child's weight. This underestimation is more notable when the child is obese. This study also found that the image of an overweight child is an image that the mother perceives as that of a healthy child and this is the image that they prefer 9.
Another study in Mexico reported that 84 out of 100 mothers of children with overweight-obesity were not able to adequately perceive their child's weight; however, 97.5% were able to do this in children who were not related 10. According to a study carried out in 2,840 mother-child dyads of children of two to 17 years of age 11, adequately perceiving the child's weight can influence the mother to begin changes oriented towards preventing or treating weight problems as well as optimizing positive aspects and stopping the development of negative attitudes and behaviors in the child's nutrition. The objective of this study was to evaluate the impact of an intervention on complementary feeding (CF) and the mother's perceptions of child weight status (MPCW) with the growth indicators length-for-age (L/A) and weight-for-length (W/L) in a community of Hidalgo, Mexico.
METHODS
This was a quasi-experimental interventional study of a convenience sample of 19 mother-child dyads carried out between April and September 2017 in the community of Yolotepec, Hidalgo. Exclusion criteria were diseases that condition special nutrition, not being a resident of the community, and not being the child's caregiver. The project was approved by the Ethics and Research Committees of the Health Services of Hidalgo and written informed consent was obtained from each child's guardian.
The sample was divided into two groups: an intervention group (IG) and a control group (CG); the mothers could choose in which group to participate based on the group that was more convenient for them because of time.
DIETARY INDICATORS
Before and after the intervention, a 24-hour recall (R24) was applied to obtain: a) percentage of children breastfed the day or night before; b) number of breastfeeding times (number of times the child was breastfed per day during the previous day); c) number of feeding times (number of times the child received solid, semi-solid or soft foods during the previous day). The minimal dietary diversity (MDD) in children of 6 to 24 months of age was calculated only in the defined as the diet that includes at least four of the following seven groups: a) cereals/tubers; b) legumes/oleaginous seeds; c) milk products (cheese, yogurt or breast milk substitutes); d) foods of animal origin (red meat, fish, chicken, organ meat); e) eggs; f) fruits/vegetables rich in vitamin A; and g) other fruits and vegetables 12.
ANTHROPOMETRIC MEASURES
With trained personnel and standardized measurements, each child was weighed and measured at the start and end of the intervention. A Seca(r) model 874 platform scale with a mother-baby function (Seca GmbH & Co. KG, Hamburg, Germany) and a Seca(r) model 217 stadiometer were used. With the data obtained, the World Health Organization (WHO) growth indicators Z-score length-for-age (ZLA) and Z-score weight-for-length (ZWL) were constructed. The Anthro version 3.2.2 software was used to evaluate growth and development.
Mothers' perceptions of child weight status (MPCW)
Both at the beginning and at the end of the intervention, the MPCW was measured using the question "Do I believe my child is...?", according to the methodology proposed by Flores-Peña 9,13, modified to four answer choices: a) "a little underweight or underweight"; b) "more or less at a normal weight"; c) "a little overweight"; and d) "definitely overweight". The MPCW was considered as adequate when: a) the mothers with underweight children referred to the choices "a little underweight or underweight"; b) when mothers of children at a normal weight referred to "normal weight"; c) when the mothers of overweight children referred to "a little overweight"; and d) when mothers of children with obesity referred to "overweight". Any other combination of answers between the weight-for-length indicator categories was considered as inadequate, as an underestimation by the mother if she selected one or more categories below the true one, or as an overestimation when the mother chose one or more categories above the true one.
The diagnostic of true weight was determined by the weight-for-length indicator grouped into four options: "underweight" (grouping together the categories severely wasted [< -3 SD] and wasted [< -2 SD]); "normal weight" (< +1 SD to > -2 SD); "overweight", (grouping together the categories possible risk of overweight [> +1 SD to +2 SD] and overweight [> +2 SD to +3 SD]); and "obese" (> +3 SD) 1.
Additionally, at the beginning of the project, sociodemographic data from each dyad was obtained (age, number of family members, the mother's age, education and occupation, and the child's type of birth). The mother was also asked when and how she included foods other than milk by food group (meat, vegetables, fruits, legumes, milk products, and citrus fruits) according to her beliefs and experience and according to the Food Introduction Scheme of the Official Mexican Standard (Norma Oficial Mexicana NOM-043-SSA2-2012) 14.
Intervention
The intervention group consisted of seven 50-minute sessions. The topics covered were:
Complementary feeding (two sessions), amounts, and the consistency of foods to be introduced according to food groups and month of age 14. Commercial didactic material, the Complementary Feeding Wheel and the Feeding Book 0-5 years from NutriEdu(r) (Aguascalientes, Mexico) were used.
Continued breastfeeding, with the purpose of promoting breastfeeding for a year or longer; children should continue to be breastfed while receiving appropriate complementary food for up to two years or beyond.
Adequate perception of the child's weight, where the mother is taught to use the WHO growth curves (ZLA and ZWL) and follow-up visits in order to avoid inadequate perception.
Dietary diversity and use of accessible and available foods in the zone.
Nutrition for a child ≥ 12 months of age. For this, commercial didactic material from Nutrikit(r) (Mexico City) was used.
The same anthropometric (ZLE and ZWL) and dietary indicators (percentage of children breastfed the day or night before, number of maternal milk feeds, number of feeding and MDD score) were taken of the participants in the CG. The MPCW was evaluated in a first and a final measurement. Each one of them attended the follow-up visits at the health center. At the end of the project, a brief nutritional and MPCW orientation was given to this group.
DATA ANALYSIS
Collected data was captured and analyzed with IBM SPSS for Windows version 23.0. For qualitative variables, the Chi-square test was used (p < 0.05). For quantitative variables, the Mann-Whitney U test, the Student's t-test for independent samples and the paired samples (with 95% confidence intervals) were used.
RESULTS
The mean age of the mothers and fathers was 25.3 ± 5.6 and 26.4 ± 4.7, respectively. Regarding education, most of the mothers had a preparatory school level (53.4%) followed by a secondary school level (38.1%); 90.5% were housewives and the rest were employed (9.5%). In relation to the fathers, the largest proportion had a secondary school level (57.9%). The general sample had 4.8 ± 1.1 members per home; among children, 81% were delivered vaginally and 19% by cesarean section (Table 1).
Table I Sociodemographic characteristics of the population

CG: control group; IG: intervention group. All values are percentages (%) unless otherwise noted.
*Mann-Whitney U test. †Pearson's Chi-square.
The mean age of the children was 5.1 ± 1.8 months. At the final measurement, mean age was 11.5 ± 1.9 months. In the general sample, the first measurement indicated that 89.0% was breastfed during the day or at night, with a mean number of breastfed times of 5.8 (SD ± 3.2) and a mean number of feeding times of 3.4 in IG (SD ± 2.0).
In the group comparison (Table 2), none of the dietary indicators variables in the study showed significant changes, percentage of children breastfed the day or night before (p < 0.39), number of breastfed times (p < 0.40), or number of feeding times (p < 0.90). According to the results or MDD, 40.0% in the IG and 33.3% in CG (p < 0.76) received a diverse diet that included at least four of the seven groups described in the methodology.
Table II Food patterns in the study population

CG: control group; IG: intervention group; MDD: minimal dietary diversity; N/A: not applicable. All values are mean ± SD unless otherwise noted. *Mann-Whitney U test. †Pearson Chi-square.
A total of 78.5% of the mothers knew that the introduction of complementary foods should be at six months. The food introduction pattern was evaluated according to the belief and/or experience of the mother at the beginning of the project before group assignment. In Table 3, the average months at which the surveyed mothers thought of beginning food introduction by food groups were observed. Also, the distribution percentage of answers is presented. Mean age to introduce the "meat" group was 9.5 ± 3.1 months and the highest percentage was 52.6% between 8-12 months. For the group "vegetables" and "fruits", the highest percentage for introduction was at 6-7 months (73.7% and 63.1%, respectively), with a mean age of introduction of 6.0 months. "Legumes", "milk products" and "citrus fruit" presented a similar mean of ten months.
Table III Maternal knowledge about food introduction
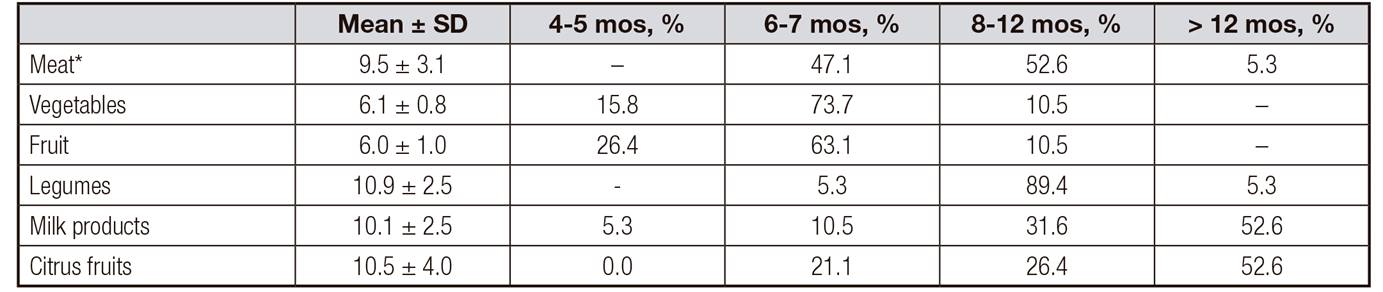
mos: months. *Veal, chicken, turkey, beef, pork and liver.
The mean number of food groups known and identified by the mothers was 2.7 (SD ± 1.6), with five being the maximum number reported; 15% said they did not know of any group, 21.1% knew between one and two groups, 26.3% knew three groups and 36.9% knew 4-5 groups.
Finally, the age at which the child was ready to eat all kinds of foods, according to the experience and knowledge of the mother, was < 12 months in 5.3%, exactly at one year in 36.6%, at 18 months in 5.3%, and up to two years in more than half (52.6%).
For both the ZLA as well as the ZWL, no statistically significant differences were observed between the groups (intervention and control) (Table 4). While in the IG a significant change was observed about their own growth in both indicators. ZLA went from -0.05 ± 0.5 to -0.73 ± 1.0 Z-score (p < 0.03), and the ZWL indicator went from 0.74 ± 0.9 in the first measurement and 0.29 ± 0.5 in the final measurement (p < 0.05).
Table IV Mean Z-score of the anthropometric indicators length-for-age and weight-for-length
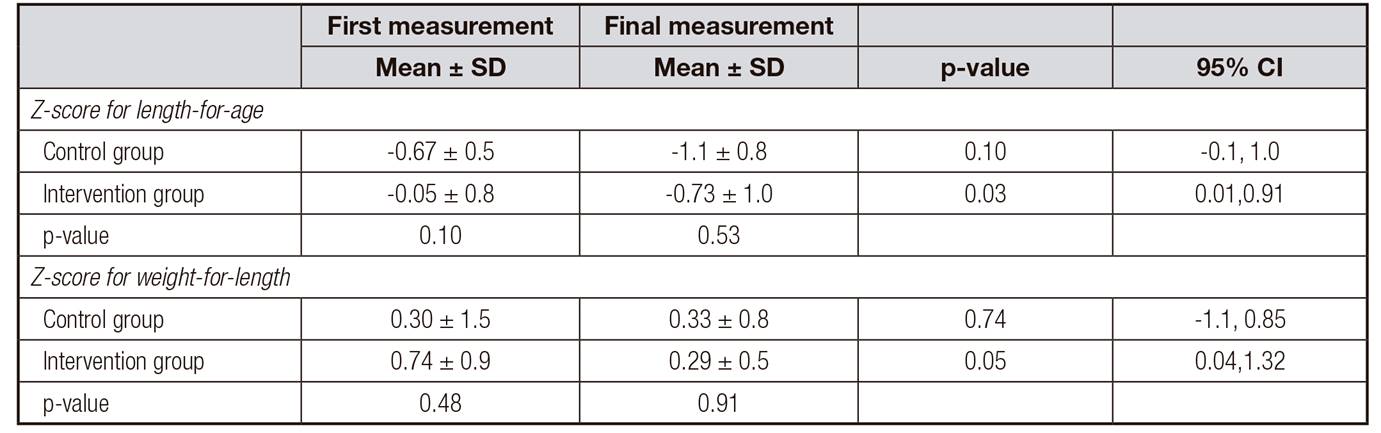
Student's t-test, with 95% confidence intervals.
To verify the MPCW, the ZWL indicator was used classified into four categories described in the methodology. The first measurement results were 60.0% in children classified at a normal weight and 40.0% at overweight in the IG; no children were registered as underweight or as obese. In the CG, the distribution percentage was 57.1% at a normal weight, 28.6% at overweight and 14.3% at underweight; no case of obesity was registered (p < 0.45). In the final measurement, 90.0% of children from the IG were classified at a normal weight and 10.0% were overweight, while in the CG 55.6% were at a normal weight and 44.4% were overweight. No one was registered as underweight or obese in either group.
In the MPCW analysis (Table 5), in the first measurement no differences were observed between the intervention and control groups (p < 0.67). In the final measurement, the percentage of mothers with an adequate MPCW was 80% in the IG and 33.3% in the CG (p< 0.04). In the same table, an analysis of the MPCW is observed by classification of the ZWL indicator in both measurements. For the final measurement, a statistic significance was observed in the overweight category (p < 0.02), 100% of the IG with adequate MPCW and 100.0% of the CG inadequate by underestimation.

DISCUSSION
The objective of this study was to evaluate the impact of a CF intervention on MPCW and ZLA and ZWL. In regard to the CF, at the first measurement, most of the mothers (80%) knew about the recommendation of introducing foods at six months of age; however, only 40% could identify three to four food groups. This is important to easily understand the food introduction scheme 14.
In many low-income countries, inadequate introduction of complementary foods is one of the reasons for malnutrition and low protein intake is the most common, despite international recommendations to introduce these foods at six months of age. In Ethiopia, for example, only 26.4% of a sample of 352 participants thought that six- to 23-month-old children "could" eat meat and organs such as liver 15. Another study in children of six to 35 months of age in six low-income countries found that in five of these countries there was a high prevalence of inadequate protein intake in infants of six to eight months of age which decreased at nine to 12 months and which was very low after 12 months of age. The authors concluded that the low protein intake in breastfed children was due to insufficient complimentary foods (at six to eight months of age) 16. In this study, we identified that the mean time for introduction of meat was 9.5 months. A pattern of low protein intake increases the risk that the diet become highly dependent on basic cereals 17, which have less digestible protein and low quantities of some essential amino acids, particularly lysine (in cereals) and sulfur (in legumes), a situation that favors malnutrition. On the other hand, the protein in maternal milk and foods of animal origin are highly digestible and are composed of adequate amounts of essential amino acids 18. Therefore, the recommendation not to wean the child is a good choice.
Half of the mothers evaluated (52.6%) thought that children should eat all foods when they reach two years of age. This belief is not an isolated pattern since in Mexico a deficient intake of nutrients, such as iron, vitamin D, vitamin E, folic acid and fiber has been reported in children under two years of age. Also, excessive energy consumption, added sugar, saturated fats and sodium, has been reported; this occurs more frequently in people with low and average income and in rural areas 19,20.
Regarding the ZLA in this study, the initial measurement of both groups at the start of the intervention was within the range of adequate length (Z score < +1 to < -1) with a mean age of 4.8 ± 1.1 months. However, in the final measurement, the difference between groups was not significant (p < 0.53). An interesting discovery was that both groups showed a tendency leaning towards the classification at risk of underweight, slightly higher in the CG (-1.1 ± 0.8) than in the IG (-0.73 ± 1.0). If we classify these values, the IG would result in adequate height, and the CG in at risk of stunting. From national reports, we know that chronic malnutrition is the most common nutritional deficit in Mexico; this occurs because of a constant and inefficient consumption of energy and nutrients. 21
In our study, the results of the MDD show similar evidences as more than half of the children in both groups did not have a diverse diet (60.0% in the IG and 66.7% in the CG). Although there was no significant difference (p < 0.76), the percentage of children that had a diversified diet was greater in the IG than in the CG (40.0% and 33.3%, respectively) at the end of the intervention. Ideally, children should be consuming almost all food groups by 12 months of age, 22 and according to international MDD recommendations, children younger than two years of age should be fed a minimum of four food groups 12. The last national report in Mexico in 2012 showed that 53.7% of children of 6-23 months of age in rural communities had a food diversity of three to four groups, while 14.6% had between one and two groups and 31.8% had a diversity of five to seven groups 23. A study of children from Nepal with an elevated prevalence of severe acute malnutrition 24 found that by adding only one more food group to the diet, they gained 0.09 cm in length. This demonstrates that a good nutrition is fundamental for normal growth and development.
With regard to the evaluation of the ZWL indicator, in the final measurement of our study, 90.0% of children from the IG were classified as at a normal weight and 10.0% as overweight, in contrast to the CG (p < 0.08), with 55.6% as at a normal weight and 44.4% as overweight. Even though in small children the weight change can be explained for various reasons, in the sessions that mothers from the IG participated in, one of the main topics was the correct introduction of complementary foods (what, how and how much food was recommended for children under two years of age). Likewise, one session was devoted to giving a detailed explanation about the importance of growth indicators and the mothers themselves were the ones to measure the weights and lengths of their children in the growth curve percentile of the WHO.
According to this same indicator (ZWL), but now relevant to the MPCW, the IG showed an improvement passing from 60% to 80% of mothers who adequately perceived their child's weight. Likewise, at the end of the intervention, the inadequate MPCW from underestimation decreased from 30% to 20%, while the overestimation (10%) vanished.
In contrast, children in the CG had an increase in overweight (from 29% to 44.4%) and the proportion of mothers that showed an adequate MPCW decreased from 71.4% to 33.0% in regards to the first measurement. Concerning IG, the values of the inadequate MPCW, both by underestimation and overestimation, were significantly higher. These results suggest a tendency where the mother's perception of the weight of her child becomes detached from their true weight as the child grows and it worsens if there is no intervention. According to the Clinical Practice Guide for Control and Follow-up for girls and boys under five years of age in Primary Care, the supervision of growth through somatometry is ideal in 1-12-month-old children at once a month check-up appointment and in children of 1-3 years every three months. 25 It is suggested that either the mothers did not comply with the follow-up appointments or there was a failure in the explanation or comprehension of the diagnosis. On the other hand, scientific evidence shows that mothers can identify overweight children that are not related to them but have greater difficulty in identifying their own child as overweight. 9 Another study that was carried out in Northeast Mexico in 2,874 mothers and children concluded that if the doctor reports overweight in the child, this would help the mother to better manage the situation. 26 Thus, pediatric growth charts are fundamental tools for following the child's development. Parents should be convinced of this and health institutions should support this action 27. During the intervention, the researchers insisted that the participant's perception or that of other persons, such as relatives or friends, could be wrong and that this should not be a reason for changing anything until the indicated personnel evaluated the child.
According to scientific evidence, inadequate MPCW leans more towards underestimation than overestimation 28, and our results confirm this tendency. Besides, it was the overweight children from the CG that were classified as an underestimation in its majority (100% of those classified as overweight). When there is an underestimation, there is a risk of providing supplementation and favoring weight gain in children who do not need it. In children that are overweight and obese, underestimation of MPCW conditions the possibility of not carrying out any action to stop weight gain, such as calorie restriction 29. In 2014, a study performed in 2,840 mother-child dyads, two to 17 years of age, in five states in Mexico, proposed evaluating if the actions of problems of managing the child's weight were different according to the nutritional status and the mother's perception and if the actions and problems were different according to the child's weight. The most relevant results showed that when the child's mother adequately perceives overweight-obesity, they carry out actions related to the diet, such as reducing the consumption of fast food or junk food, which is high in fat, increasing the consumption of fruits and vegetables and preparing less food 11.
On the other hand, although less frequent, overestimation is not less important especially in children that have an adequate weight for their age and length and who could suffer from calorie restriction without even needing it. All interventions try to provide mothers with tools to detect mistakes and correct them, as well as nutritional orientation about how, what and when to offer food to children and the possibility that their perception was driving the way that they fed their child and not their real needs. For that reason, it is considered as important to continue providing scientific evidence with regards to this variable and perfect the way that this concept is approached by health workers and mothers.
CONCLUSIONS
It was possible to determine that the intervention had an effect on the mother's perception, attaining higher proportions of adequate perceptions in the intervention group. The tendency in the CG was the increase in the proportion of mothers with inadequate perception both by underestimation and overestimation. It was also possible to observe in this group an increase in the proportion of overweight.
In this study it was confirmed that, in general, underestimation of weight is greater than overestimation and this happens more with overweight children. It should be noted that overweight and obesity are already a serious public health issue in Mexico.
On the other hand, there was not enough statistical evidence to indicate that the intervention made a difference in dietary indicators, number of breastfed times, number of feeding times and minimal dietary diversity between both groups. Nevertheless, the ZWL indicator showed that children participating in the intervention group presented better results.
This research shows evidence of the importance of clear food orientation about the introduction of foods, as well as the need to continue researching about the behavior of the MPCW in the population of Hidalgo.
LIMITATIONS
The MPCW is a concept that is still under study and the perfection of instruments continues. For this reason, the results of the study should be considered with care. However, it represents the first evaluation of this variable in the population from Hidalgo, Mexico. On the other hand, scientific evidence suggests that as a growth up, there is a greater probability that weight will be perceived adequately; therefore, the possibility of improvement in MPCW is due to this situation and not to the intervention. Likewise, the decrease in overweight observed in the control group could be due to situations that escape this study as infectious processes. The size of our sample was small and there is a risk of not detecting a statistically significant difference when it truly exists.

