


 Custom services
 English (pdf)
 Article in xml format
 Article references
 Send this article by e-mail
 Cited by SciELO
  Cited by Google
  Similars in
SciELO
Similars in
SciELO  Similars in Google
 Permalink
INTRODUCTION
Spinocerebellar ataxia is part of a group of neurodegenerative disorders of autosomal dominant inheritance. Their clinical manifestation includes progressive changes in balance, gait and hypotonia, among others. Their reported prevalence ranges from one to five cases per 100,000 1,2.
The severity of SCA is measured by the Scale for the Assessment and Rating of Ataxia (SARA), which is based on a semi-quantitative assessment to determine the impairment level of the patient's condition 3. Its progression results in difficulties maintaining upright posture and changes in balance and gait due to muscle atrophy and reduced muscle tone 4. Hence, assessing and monitoring body composition is essential in order to detect potential reductions in body tissues, particularly muscle mass.
Currently, a variety of methods are available for assessing body composition, each with its methodological principles, cost, accuracy, ease of use and transport. The most sophisticated methods, such as magnetic resonance imaging (MRI) and computerized tomography (CT) produce more detailed assessments of body composition. Hydrostatic weighing and dual X-ray absorptiometry (DXA) quantify the body's main components, namely fat mass and fat free mass. Due to their high cost and the high complexity of their use; however, these methods have limited field applicability, and are thus more commonly used in the assessment of specific population groups and in research settings 5.
For clinical purposes and for population assessments, lower complexity and lower cost tools are generally preferred. Bioelectrical impedance analysis (BIA) and anthropometric assessments are validated methods for use in diverse populations, are easy to apply and are broadly employed for both these purposes 6.
BIA is frequently used for body composition assessments. It is a low-cost, non-invasive and easily applied method 5. It is based on the two-compartment model of body composition. Fat mass and fat free mass are assessed by the flow of a low-intensity electric current through the body and the resistance exerted by the different body compartments 6. Several studies have found a strong correlation between muscle mass and BIA assessments. Although the cost of using BIA is lower compared to methods that employ higher technology (e.g., DXA), it is not always available for clinical use in health services. Moreover, as several conditions must be met for a BIA assessment to produce accurate results, this requirement may restrict the feasibility of its use.
Anthropometry, on the other hand, is one of the most commonly used methods for assessing body composition. It is of relatively simple use, and estimates the size and proportions of body compartments through the measurement of an individual's weight, height, circumferences, lengths and skinfolds 7,8. It can be applied in clinical, field and research settings. The equipment used is portable, non-invasive, easy to handle, low-cost and available in most health services.
More than 100 predictive equations for estimating body fat using anthropometric measurements have been found in the literature 6. The number available for estimating muscle mass, however, is much lower. Some equations were developed using cadavers of seniors as their study sample, in relatively small numbers, and estimated muscle mass by tissue dissection (9,10). Other studies used different anatomical sites and proposed regression equations validated through magnetic resonance imaging 11,12.
Given the potential effects of SCA on muscle trophism, and the importance of muscle mass as a metabolically active tissue that can be used as a clinical indicator of health and disease, it is necessary to monitor changes in this body compartment. To our knowledge, this is the first study to investigate this question in patients with SCA. For this purpose, it is essential to identify the most accurate methods for use in this patient population.
In light of the challenges of employing more sophisticated methods for body composition assessment in clinical practice, the use of predictive equations can be a feasible alternative for estimating muscle mass. To this end, the objective of this study was to compare the results of different predictive equations that use anthropometric measurements or BIA for determining muscle mass in patients with SCA.
MATERIALS AND METHODS
Patients aged 18 or older with a diagnosis of SCA and who were attending the Outpatient Clinic for Movement Disorders at a public hospital in the south of the country were included in the study. The study sample was selected through screening assessments conducted between April of 2011 and January of 2013. Exclusion criteria included any type of amputation, use of a pacemaker, a defibrillator or any metallic device in the body, and pregnancy.
This is a cross-sectional, prospective, analytic study, and was approved by the Ethics in Research Committee under registration number 2379.273/2010-11. The study procedures were described to each patient and/or their caregivers. Those who agreed to participate in the study then signed a free and informed consent form.
Patients were first assessed by a neurologist, using a standardized protocol to diagnose SCA, and to determine the SARA level. Body composition assessments occurred on a single day, and were conducted by trained personnel, in a climatized room at 25 °C. During the entire assessment, patients wore their underclothes only.
BIA assessments were performed using a Biodynamics device, model 310. During the examination, study participants were lying down in the supine position, on a non-conducting surface, with their arms positioned at a 45° angle in relation to their body, and with their legs apart. Measurements were taken on the right side of the body in accordance with the methods described by Heyward and Stolarcyk 8.
Body weight (BW) was measured using a 300-kg capacity MP 4200 digital scale, adapted for a hospital bed, with a four-cell charge and a hydraulic system for lifting the bed. Height was measured using a wall-mounted stadiometer with 0.1 cm increments following the protocol described by Gordon et al. 13. Patients unable to stand had their recumbent height measured as per the same protocol.
Mid-upper arm circumference, forearm, mid-thigh and calf measurements were taken by the same assessor using a 150-cm non-stretch measuring tape with 1 mm increments, as per the techniques described by Callaway et al. 14.
Three skinfold measurements were taken at the triceps, biceps, suprailiac, subscapular, thigh and calf sites. The average value was recorded and when the highest and lowest values differed by more than 5%, a new set of measurements was taken. Skinfold measurements were performed using a Lang(r) scientific caliper, following the techniques described by Harrison et al. 15.
Muscle mass (MM) was estimated based on the reference standard proposed by Janssen et al. 16, which uses BIA resistance values for its prediction. MM readings obtained through BIA were then compared with those of Martin et al. 9 (B) and Doupe et al. 10 (C) classical equations, which were proposed based on the direct dissection of cadavers; the equations proposed by Lee et al. 11 (D, E), which were developed based on multi-compartment methods; and the of use anthropometric measures, as well as the equation proposed by Heymsfield et al. 12 (F), which uses height and corrected mid-upper arm muscle area (Table 1).
Table I Predictive equations for muscle mass

MM: muscle mass; BW: body weight; H: height; R: resistance; CTG: corrected thigh girth; FC: forearm circumference; CCG: corrected calf girth; MTG: modified thigh girth; CMAC: corrected mid-upper arm circumference; CMMA: corrected mid-arm muscle area; Ag: age; S: sex: 1 for men and 0 for women; Ra: -2.0 for Asian descent, 1.1 for African descent and 0 for Caucasians; Rb: -1.2 for Asian descent, 1.4 for African descent and 0 for Caucasians.
Statistical analyses were performed using R statistical software package, version 2.15.3 (R Core Team, 2014), based on the comparison of muscle mass values obtained through Janssen et al. equation and the results produced by each of the other equations. In order to quantify the strength of linear correlation and agreement between the results produced by each equation, Pearson's correlation coefficients and intraclass correlation coefficients were calculated, and their respective 95% confidence intervals were obtained through simulation according to Shrout and Fleiss 17 and Zar 18. Moreover, the differences between the results produced by each pair of equations (with equation A always used as the reference) were calculated. The graph proposed by Bland and Altman 19 was used to analyze the distribution of the differences and to identify potential outliers. For each of the equations being examined, the mean and the standard deviation of the differences were calculated, and the paired t-test was used to detect potential bias in obtaining muscle mass measurements.
RESULTS
A total of 76 patients aged between 22 and 72 years, 54% of them female and 46% male, were assessed. Mean body weight was 64.2 kg and mean muscle mass estimated by equation A was 22.8 kg (Table 2). Table 3 contains muscle mass estimates obtained from each predictive equation. Estimated mean muscle mass values were highest with Martin et al. 9 (B) equation (29.7 kg), and lowest with Heymsfield et al. 12 (F) (21.8 kg).
Table II Descriptive characteristics of patients with spinocerebellar ataxia (n = 76)

SD: standard deviation; BMI: body mass index; SARA: Scale for the Assessment and Rating of Ataxia.
Table III Muscle mass estimates obtained from predictive equations in patients with SCA (n = 76)

SD: standard deviation; Equation A: Janssen et al. (2000) (16); Equation B: Martin et al. (1990) (9); Equation C: Doupe et al. (1997) (10); Equation D, E: Lee et al. (2000) (11); Equation F: Heymisfield et al. (1982) 12.
Table 4 presents the correlation between Janssen et al. 16 (A), which was the reference standard for muscle mass in our study, with the other five predictive equations. The strongest correlation was found for Lee et al. 11 (E) equation (r = 0.94), while that of Heymsfield et al. 12 (F) was the weakest (r = 0.69). The intraclass correlation analysis revealed that, once again, Lee et al. 11 (E) equation produced the highest result (r = 0.93), while the lowest was found for equation B (r = 0.46), thus suggesting that these two equations produced the highest and lowest levels of agreement in relation to muscle mass values obtained by equation A.
Table IV Coefficient of correlation (r), intraclass correlation (ICC) and Bland and Altman plot values obtained by five different equations to estimate muscle mass in patients with spinocerebellar ataxia (n = 76)
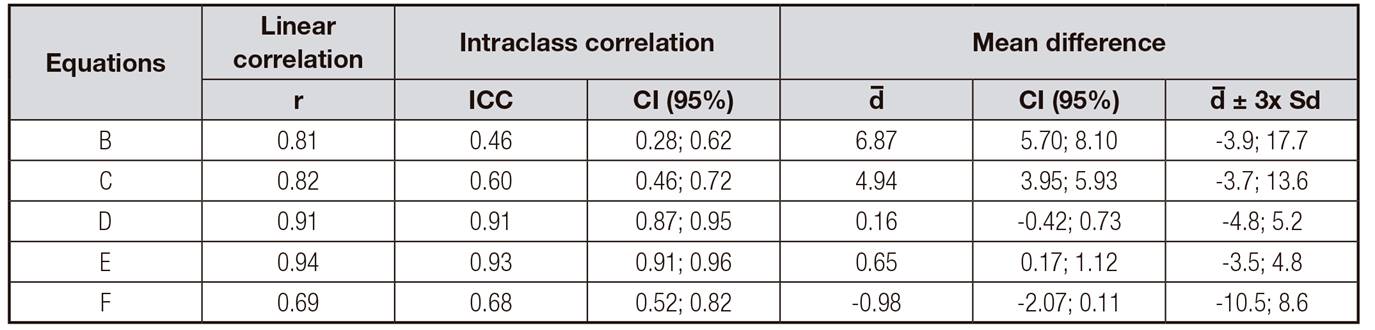
Equation B: Martin et al. (1990) (9); Equation C: Doupe et al. (1997) (10); Equation D, E: Lee et al. (2000) 11; Equation F: Heymisfield et al. (1982) 12; r: linear correlation; ICC: intraclass correlation coefficient; CI: 95% confidence intervals; d: mean difference; d ± 3x SD: standard deviation of the mean difference.
Equations D, E and F produced non-significant bias values in muscle mass measurements, as indicated by the mean difference compared to equation A, whereas the lowest bias was found for equation D (d = 0.16). Moreover, equations B and C were found to overestimate patients' mean muscle mass. All other equations were found to produce significant bias values at the 5% significance level.
Figure 1 depicts the Bland and Altman 19 plot distribution of the differences in muscle mass obtained between equation A and the other five predictive equations. Overall, these equations tended to overestimate muscle mass when compared to equation A, with the exception of equation F. A high degree of measurement bias is also noticeable, as indicated by the lines depicting the mean differences for equations B and C. Finally, the amplitude of the limits of the respective graphs indicate a high degree of heterogeneity in the differences found.
A higher number of differences close to zero was found for equation E, followed by equation D. However, the variation in the differences produced by equation D increases as the patient's muscle mass increases. This trend is less evident for equation E except in three individuals with a higher muscle mass than the other study participants, where a high measurement bias (underestimating it by four units) was found.

Figure 1 Bland and Altman plot for the comparison of the differences between muscle mass values produced by equation A and the other predictive equations (n = 76).
Although a significant bias value was not detected, method F produced higher variation in the differences between results obtained from equation A compared to methods D and E. Overall, we found that, with the exception of equation F, the anthropometric predictive equations we analyzed overestimated muscle mass when compared to the equation which uses bioelectric impedance readings.
DISCUSSION
Body composition assessment has become an important component in monitoring an individual's health status. Obtaining accurate estimates of muscle mass is therefore essential both in research and in clinical settings, given its role in human health. The high cost of obtaining these estimates using available methods such as DXA, CT and BIA, however, limits the feasibility of their routine use in practice.
Patients with SCA may have reduced muscle mass in their lower limbs as a result of disease progression. To our knowledge, this is the first research study to compare the results of anthropometric prediction equations for muscle mass in patients with SCA.
The age range in our study population was similar to that of the population samples used to generate most other predictive equations for muscle mass, thus capturing body composition changes associated with aging. The study by Janssen et al. (2000) 16 included individuals aged between 18 and 86 years. The studies by Lee et al. (2000) 11 (D and E) assessed individuals aged 20 to 81 years, and similarly, Heymsfield et al. (1982) 12 (F) study population included individuals aged between 20 and 70 years.
The equation developed by Martin et al. (B) (1990) 9 and the model subsequently developed by Doupe et al. (1997) 10 were based on a small sample of 12 male cadavers, aged between 50 and 94 years. The low agreement between equations B and C compared to equation A may be a result of the age and gender differences in these two study populations. The first two equations were derived from a sample of predominantly older males, which may explain the difference in body composition between these groups. These differences are evidenced by the low ICC and the larger bias values even after the exclusion of outliers. Moreover, equation B tended to produce larger differences in muscle mass, which can negatively influence the assessment of individuals with higher muscle mass. The exclusion of outliers for equation C produced lower bias value and lower confidence interval limits. This adjustment is thus important for comparing the agreement between these methods, as it generates improved results.
In addition to considering the body composition changes associated with aging, it is also important to analyze the different body sites assessed and their influence in estimating muscle mass. Patients with SCA may have reduced muscle mass in their lower limbs, thus affecting their gait, balance and muscle trophism. Hence, it is important to understand which variables were employed in the different predictive equations for muscle mass.
Out of the five equations, equation D, which employs measurements from both the lower and upper body, had the lowest bias value and the second best ICC compared with equation A, even before the log transformation. Equation C resulted in different findings from equation A, even though it employs the same body sites as equation D.
When comparing equations C and D, a small difference in the corrected thigh circumference is detected. This adjustment may explain the differences in findings from equation A. Moreover, these equations differed with regard to their respective validation methods, where equation A was validated through magnetic resonance imaging, and equation C, through cadaver dissection.
Equation E, which had the highest ICC and the highest linear correlation with equation A, uses total body weight and height to measure muscle mass. The Bland-Altman plot 19, however, which assesses the agreement between methods, found significant bias values, which indicates that there are differences in the means of the two methods. This finding may be explained by potential changes in lower limb muscle composition in patients with SCA. One of the advantages of using this equation is that its variables can be easily obtained.
Even though upper body measurements such as mid-upper arm circumference and mid-upper arm muscle area are frequently used as indicators of muscle mass, we found that equation F, which uses height and mid-arm muscle area only, produced low correlation and low ICC results compared to equation A. Hence, its use in this patient group is not recommended. The differences in estimated muscle mass may be attributed to the potential decrease in lower limb muscle mass in patients with ataxia. The anthropometric equations analyzed in this study produced variable results and tended to overestimate MM values. We found that equation E generated the best results among the five equations for the established criteria. The use of this predictive equation will enable health professionals to monitor changes in body composition in patients with SCA, as well as disease progression, and the effectiveness of therapeutic interventions, thus contributing to maintaining or improving these patients' health status.

