


 Servicios personalizados
 Inglés (pdf)
 Articulo en XML
 Referencias del artículo
 Enviar articulo por email
 Citado por SciELO
  Citado por Google
  Similares en
SciELO
Similares en
SciELO  Similares en Google
 Permalink
INTRODUCTION
Cerebral palsy (CP) is a group of disorders of the development of movement and posture, causing limitation of activity, which is attributed to non-progressive damage of the developing brain, in the fetal period or in the first years of life 1. Children with CP have multiple risk factors for low bone mineral density (BMD) or osteoporosis, including the degree of gross motor impairment, protein-energy malnutrition (PEM), the method of feeding and the use of anticonvulsants 2,3,4,5,6.
Anticonvulsant drugs affect BMD due to their adverse effects on the serum concentration of calcium, phosphorus, vitamin D, parathyroid hormone, alkaline phosphatase and thyroid hormones causing hypocalcemia, hypophosphatemia, elevated alkaline phosphatase concentration, decreased vitamin D concentration, alterations in thyroid profile and increase in PTH concentration 4,6,7.
The biochemical markers related to bone metabolism in children and adolescents are involved in bone formation, skeletal growth, and bone resorption. In addition, they are influenced by multiple factors, such as age, pubertal stage, growth rate, hormonal regulation, and nutritional status 8. There is increasing evidence reporting the relationship of BMD with these biochemical markers of bone metabolism in children with CP 9,10,11,12,13. Nevertheless, some studies have reported that the decrease of serum concentrations of phosphorus, calcium, vitamin D, alkaline phosphatase and PTH may not be associated with low BMD 3,12.
The purpose of this study was to explore the association between BMD and biochemical and hormonal indicators of bone metabolism in children with quadriplegic CP treated at a University Hospital in the metropolitan area of Guadalajara, Mexico.
METHODS
Analytical cross-sectional study including 62 participants from six to 18 years of age with quadriplegic CP with or without spasticity who attended the Pediatric Neurology Outpatient Clinic of the Nuevo Hospital Civil de Guadalajara. The results of the present study are part of a study conducted in the same population of children and adolescents with quadriplegic cerebral palsy 2. The sample size was calculated in 58 participants with an alpha level of 0.05, power of 0.80, an expected frequency of low bone mineral density in children with CP of 42% 14, and a type II error of 0.20. We did not include patients with diagnoses unrelated to CP (autism, Down syndrome, degenerative disorders, hypothyroidism), moderate or severe congenital malformations, CP of postnatal origin and/or other diseases that affect bone mineral metabolism.
ETHICAL CONSIDERATIONS
The protocol did not expose participants to risk and adhered to the guidelines of the Declaration of Helsinki in its last correction made during the 64th Annual Assembly organized by the World Medical Association (2013). The persons legally responsible for the participants signed the informed consent and the research protocol was approved by the Bioethics and Research Committee of the Nuevo Hospital Civil de Guadalajara with registration number 66/HCJIM-JAL/2016.
DETERMINATION OF BONE MINERAL DENSITY
The measurement of BMD expressed in g/cm2 and age-adjusted Z-score was performed by dual-energy X-ray absorptiometry (DXA) using the GE Medical Systems Lunar software by a certified technician. The lumbar spine (L1-L4) was used as the region of interest, with the following criteria: low BMD for age, a Z-score defined as bone mass reduction (< -2 Z-score), and osteoporosis defined as bone mass reduction plus the alteration of bone architecture (< -2 Z-score plus a significant fracture history: two or more long bone fractures before ten years of age or three or more long bone fractures before 19 years of age) 15,16,17.
LABORATORY ANALYSIS
We obtained 5 ml of peripheral blood for the determination of serum concentrations of biochemical indicators and hormones with standardized methods. The 25OHD metabolite and PTH were determined by the chemiluminescence immunoassay method LIAISON® 25OH Vitamin D Total and LIAISON® 1-84 PTH Assay, DiaSorin (USA). The cut-off points for 25OHD metabolite were as follows: deficiency (< 30 nmol/l), insufficiency (30-50 nmol/l), sufficiency (51-75 nmol/l) and optimal (> 75 nmol/l) 14,18; the PTH reference values were 9 to 52 pg/ml.
The serum concentrations of phosphorus, calcium and alkaline phosphatase were determined by spectrophotometry (SYNCHRON®, Beckman Coulter, USA), with the following reference values: calcium 8.7-10.7 mg/dl, phosphorus 2.4-5.6 mg/dl and alkaline phosphatase 30-400 IU/l. TSH, triiodothyronine (T3) and thyroxine (T4) were determined by the chemiluminescence immunoassay method using the Access Immunoassay System (Beckman Coulter, USA) with the following reference values: TSH 0.27-3.1 uIU/ml, T3 0.26-0.62 ng/ml, and T4 4.5-10.8 g/ml.
NUTRITIONAL STATUS
The weight/age (W/A) and BMI anthropometric indexes were calculated using the Brooks reference 19. Those participants whose BMI and W/A scores were between the 10th and 90th percentiles were considered as normal and those who were located < 10th percentile were considered as malnourished.
STATISTICAL ANALYSIS
The normality of data distribution was determined with the Kolmogorov-Smirnov test. The unpaired Student's t-test was used for quantitative variables with normal distribution. The Chi-square test was used for qualitative variables. Odds ratios were used to identify the probability of association and its epidemiological significance. The Pearson's correlation test and the coefficient of determination (R2) were used to explain the variability of BMD in relation to the biochemical indicators studied. The multiple linear regressions were used to explain the variability between BMD and several independent variables. A p value ≤ 0.05 was considered as significant. Data capture and analysis was done with the SPSS program version 20 (SPSS, Inc., Chicago, IL, USA).
RESULTS
We included 62 participants from six to 18 years of age (11 ± 4 years) with quadriplegic CP; three were excluded because they presented BMD < 0.208 g/cm² (< -7 SD). Of the 59 participants, 25 (42.4%) were female and 34 (57.6%) were male. By age groups, 61% were school children (six to eleven years old) and 39% were adolescents (12 to 18 years old). According to the Gross Motor Function Classification System (GMFCS), in the total population, 6.8% belong to level III, 20.3% to level IV and 72.9% to level V. Most of the participants with low and normal BMD received anticonvulsants (98% and 90%, respectively).
Biochemical and hormonal indicators according to BMD. The nutritional status of vitamin D was deficient in 27.1% of children with low BMD and 10% of children with normal BMD, while it was insufficient in 35.4% of children with low BMD and 30% in children with normal BMD. Serum calcium and phosphorus concentration were normal in most children with normal and low BMD; only 14.9% of children with low BMD presented hypocalcemia and 10.6% had low serum concentrations of phosphorus. In children with low BMD, 11.4% had elevated PTH concentrations while 4.5% had low PTH concentrations; 13% of children with low BMD had elevated concentrations of T4. In contrast, 11.1% of children with normal BMD had low concentrations of T4. Serum T3 concentrations were elevated in all the children with low BMD and normal in all the children with normal BMD. Elevated TSH serum concentrations were found in children with low and normal BMD (Table 1).
Table I. Serum concentrations of calcium, vitamin D, alkaline phosphatase, phosphorus, PTH and thyroid hormones in participants with quadriplegic CP according to BMD

BMD: bone mineral density; PTH: parathyroid hormone; T3: triiodothyronine; T4 thyroxine; TSH: thyroid-stimulating hormone.
The serum calcium concentration was lower in children with low BMD vs children with normal BMD (p = 0.02). Similarly, there was a trend towards lower concentrations of phosphorus and alkaline phosphatase in children with low BMD (p < 0.1) (Table 2).
Table II. Serum concentrations between participants with low BMD vs normal BMD
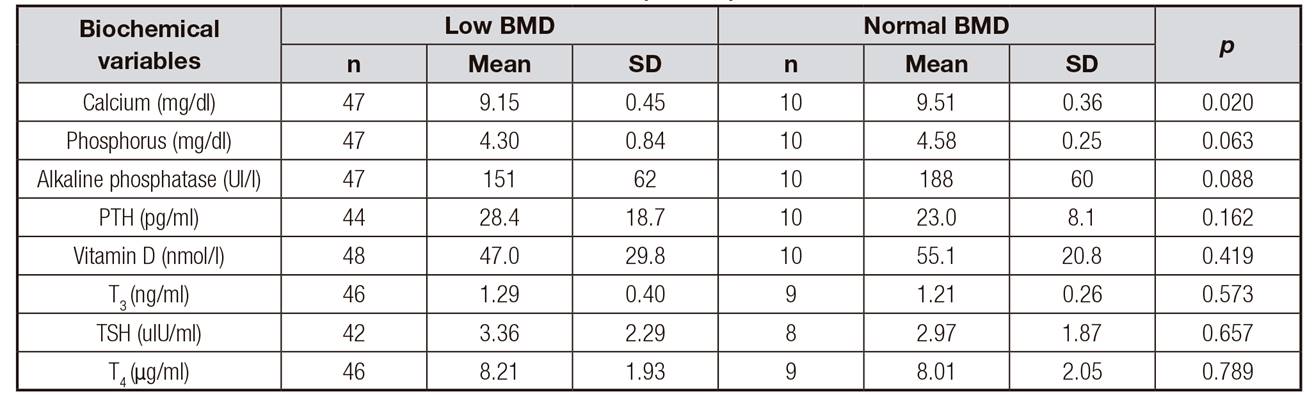
Statistics: unpaired Student's t-test. BMD: bone mineral density; PTH: parathyroid hormone; T3: triiodothyronine; TSH: thyroid-stimulating hormone; T4: thyroxin.
Biochemical and hormonal indicators and malnutrition. According to the BMI, 43% of the total sample had malnutrition and 57% had normal nutritional status. Similarly, using the W/A index, 48% of the children had malnutrition and 52% presented a normal nutritional status. Children with malnutrition, according to BMI, had significantly lower serum concentrations of calcium, phosphorus, and alkaline phosphatase vs non-malnourished children. With the W/A index, the serum concentrations of phosphorus and alkaline phosphatase were significantly lower in children with malnutrition (Table 3).
Table III. Serum concentrations of biochemical indicators in participants with quadriplegic CP according to nutritional status

Statistic: unpaired Student's t-test. Malnourished: percentile < 10th. Non-malnourished percentile 10-90th. PTH: parathyroid hormone; T3: triiodothyronine; TSH: thyroid-stimulating hormone; T4: thyroxin.
The odds of alterations of biochemical and hormonal indicators according to sex, age group, motor impairment, use of anticonvulsants, feeding method and nutritional status are described in Table 4. No significant differences in the biochemical and hormonal indicators by sex, GMFCS, use of anticonvulsants, type of therapy and feeding methods were found. Nevertheless, adolescents had lower serum concentration of phosphorus than school children (p = 0.004). According to the GMFCS, 62% children from level V and 44% of children from levels III and IV had lower concentrations than the average of 25OHD metabolite. Males were more likely to have higher than the average serum concentrations of alkaline phosphatase. By age group, the likelihood of lower than the average of serum phosphorus concentrations was higher in adolescents than in school children. With the W/A index, malnourished children were found to have a higher likelihood of lower than the average serum phosphorus concentrations. In contrast, children without malnutrition were more likely to have higher than the average serum alkaline phosphatase concentrations. With BMI, children with malnutrition were more likely to have lower than the average of serum calcium concentrations.
Table IV. Serum concentrations of biochemical indicators by sex, age group, use of anticonvulsants and nutritional status: probability of higher or lower values than average
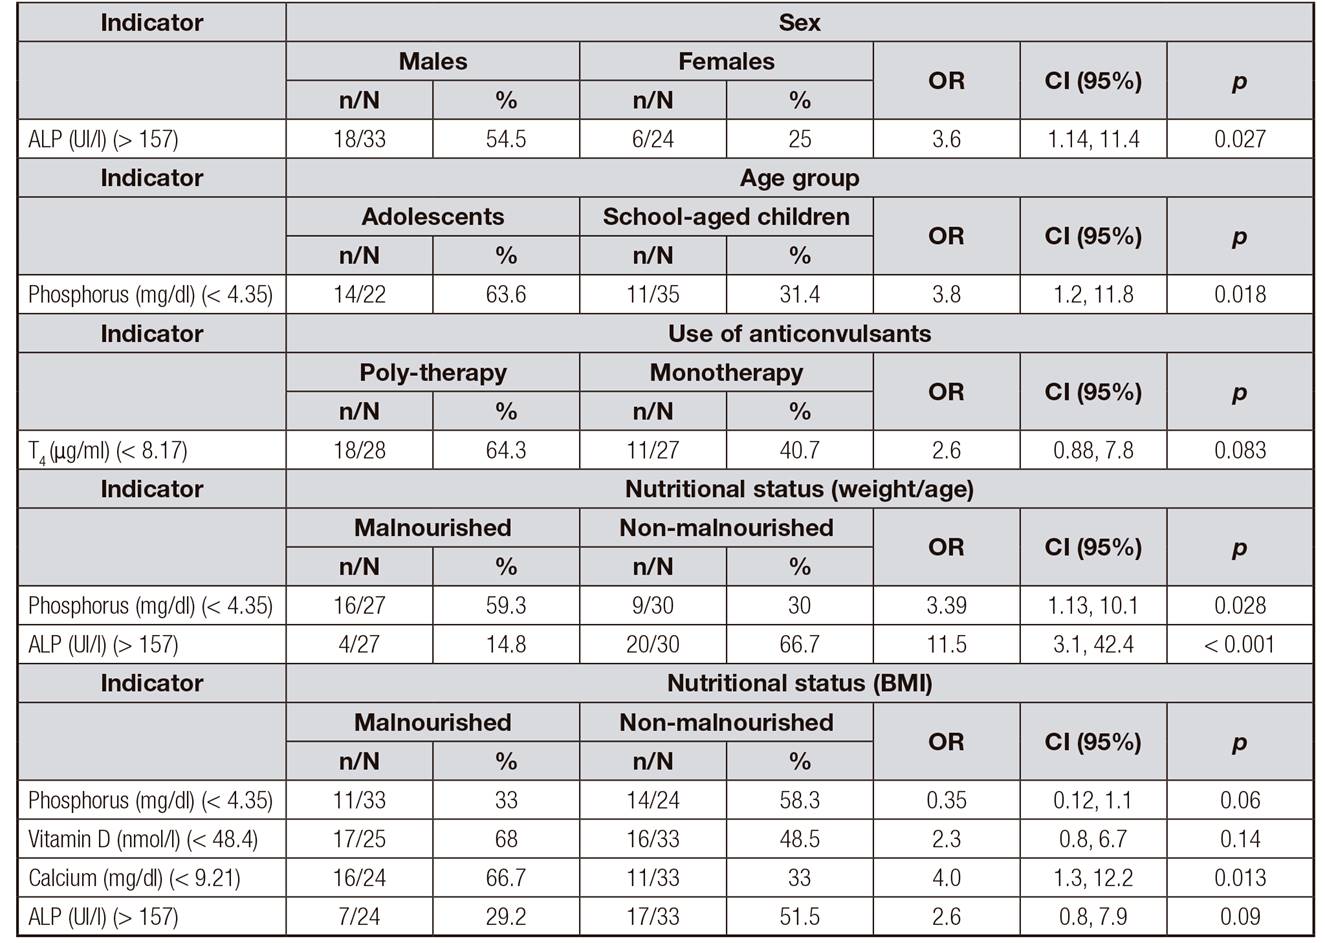
ALP: alkaline phosphatase; T4: thyroxin. Almost all biochemical indicators had serum concentrations lower than average among different variables. ALP serum concentration was higher than average among variables as sex, weight/age and BMI.
CORRELATIONS BETWEEN BMD AND BIOCHEMICAL INDICATORS
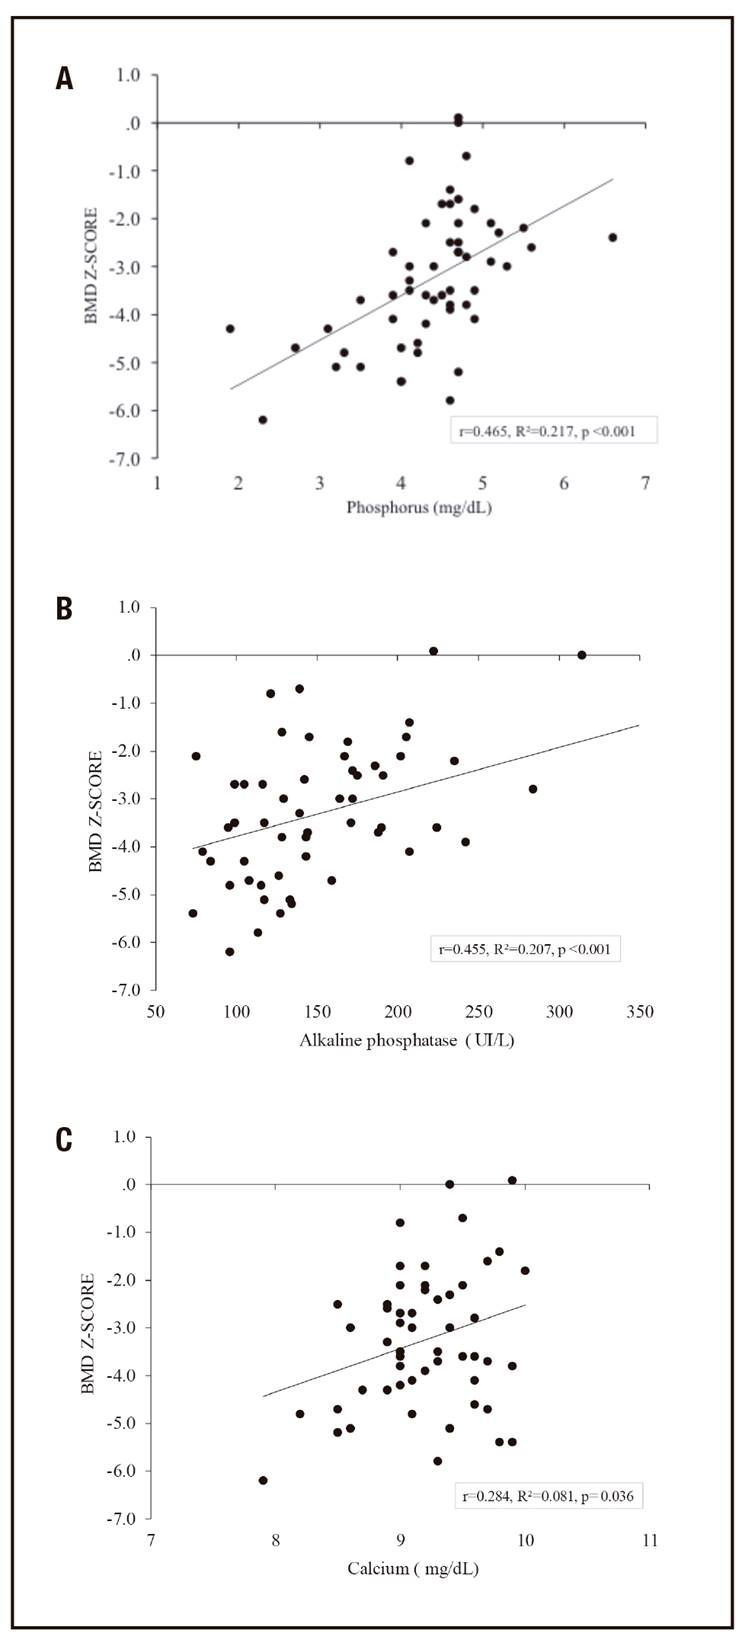
The association between biochemical and hormonal indicators was analyzed and there were no significant associations. There were significant correlations between BMD (g/cm2) and serum phosphorus concentrations (r = 0.310, R2 = 0.096, p = 0.019) and alkaline phosphatase (r = 0.327, R2 = 0.107, p = 0.013). The linear regression between BMD (g/cm2) and TSH was inverse (r = -0.316, R2 = 0.099, p = 0.030). There was a direct and potentially significant correlation between the serum concentrations of vitamin D and BMD (p = 0.056). No correlations were observed between BMD (g/cm2) and calcium, T3, T4 and PTH. The linear regressions between BMD expressed in Z-score and the biochemical indicators showed some different findings; 22% of the variance in BMD was explained by phosphorus (p < 0.001), 20% by alkaline phosphatase (p < 0.001) and 8% by calcium (p = 0.036) (Fig. 1A-C), respectively. No correlations were observed between BMD (Z-score) with vitamin D, T3, T4, TSH, and PTH.
MULTIPLE LINEAR REGRESSIONS WITH BMD AS DEPENDENT VARIABLE
Four multiple regression models were performed with BMD expressed in g/cm2 and in Z-score as dependent variable. The first multiple regression model with BMD (g/cm2), with the stepwise method, accepted the variables phosphorus concentration, alkaline phosphatase and TSH, which explained 17% of the variability in BMD. The second model accepted the variables weight and serum phosphorus concentration, which explained 54% of the variability in BMD. Contrary, when Z-score was used, the variables phosphorus and alkaline phosphatase explained 28% of the variability in BMD and the last model accepted the variables BMI, age and serum phosphorus concentration, which explained 41% of the variability (Table 5).
Table V. Multiple linear regressions with BMD expressed in g/cm2 and Z-score as dependent variable and phosphorus, alkaline phosphatase, TSH, weight, age and BMI as independent variables

VIF: variance inflation factor.
*VIF: 1.015; Durbin-Watson: 1.608.
†VIF: 1.000; Durbin-Watson: 2.061.
‡VIF: 1.189; Durbin-Watson: 1.952.
§VIF: 1.164; Durbin-Watson: 1.998.
DISCUSSION
Children with CP have been found to have decreased BMD due to various factors, such as the degree of motor impairment, malnutrition, the use of anticonvulsants, and feeding problems 2,3. In the present study, it was observed that 8.5% of the participants had osteoporosis (BMD < -2 Z-score + history of fractures) and 74.6% had low BMD for age (< -2 SD). This finding is consistent with other studies that have shown a similar frequency of low BMD in these patients. Tosun 13 reported that 63% of children with motor impairment had low BMD; likewise, Jacob 20 and Coppola 21 found that 80.7% and 70.2% of their participants had low BMD, respectively. Children with CP and acute malnutrition (BMI < 10th percentile) showed lower serum concentrations of calcium, phosphorus, and alkaline phosphatase. With the W/A index (composite indicator whose deficit reflects a chronic and acute malnutrition), lower phosphorus and alkaline phosphatase serum concentrations were also observed. The probability of serum concentrations lower than the average of phosphorus, calcium and alkaline phosphatase was higher in malnourished versus non-malnourished children. It is known that malnourished children, especially those with severe grade malnutrition, have hypocalcemia, probably because the total calcium concentration must be adjusted to the concentration of albumin 22. In addition, it is common for the serum concentration of alkaline phosphatase to be decreased in these patients 23.
Adolescents had lower serum phosphorus concentrations than school children. This finding may be explained because at puberty the BMD increases significantly and reaches its maximum peak of calcium accumulation in the bone (40 to 60%) 24. It has also been observed that the serum concentration of phosphorus is higher in school children and progressively decreases at the concentrations observed in adults during the late phase of puberty 25. There were no significant differences in the serum concentrations of calcium, phosphorus, alkaline phosphatase, thyroid hormones, and PTH between the different GMFCS levels. Chen 9 found differences in serum calcium concentrations between children belonging to level I-II vs III vs IV-V of GMFCS (p = 0.042). Children belonging to levels IV and V had lower serum calcium concentration vs children belonging to level III. Finbraten 14 did not found differences in serum concentrations of calcium, phosphorus, alkaline phosphatase and PTH between children belonging to levels I-III vs IV-V of GMFCS.
The 25OHD concentration below the average was 62% in level V and 44% in levels III and IV. It is likely that children belonging to level V, with greater motor impairment, would have been less exposed to the sun's rays. In addition, they would have greater problems in their feeding; consequently, an insufficient intake of vitamin D 26. Most participants with low BMD and normal BMD had deficiency (27.1% and 10%) and insufficiency (35.4% and 30%), respectively, of vitamin D. It has been shown that vitamin D deficiency causes less absorption of dietary calcium and increases the secretion of PTH, which activates the renal hydroxylation of calcidiol and increases the renal reabsorption of calcium. In addition, this deficiency induces osteoclastic activity that could increase the risk of BMD loss 27. Henderson et al. 10 showed that 33% of children studied with CP have vitamin D deficiency. Fong et al. 28 and Shellhaas et al. 11 found a similar frequency of vitamin D deficiency (22% and 25%, respectively). Tosun et al. 13 observed that 33.3% and 26.7% of their patients with CP had vitamin D deficiency and insufficiency, respectively. These findings confirm that children with CP, regardless of BMD, are at potential risk of vitamin D deficiency and require periodic monitoring and eventual substitution treatment. The serum calcium concentrations were lower in children with CP with low BMD, and there was a tendency toward lower serum concentrations of phosphorus and alkaline phosphatase. It is known that calcium normal limits are narrow; therefore, when the serum calcium concentration is 1-2 mg/dl lower than normal, hypocalcemia symptoms occur. This situation is infrequent due to the great capacity of redistribution and exchange of calcium from bone to serum and vice versa 29. It is possible that this physiological phenomenon is less effective in children with CP and low BMD. Conversely, Esen et al. 12 reported that decreased serum concentrations of phosphorus, alkaline phosphatase and PTH were not associated with a decrease in BMD. Similarly, Akhter et al. 3 reported that there were no differences in BMD among children with lower serum calcium, phosphorus, vitamin D, and alkaline phosphatase concentrations versus those with normal serum concentrations.
The majority of children with CP with low BMD (98%) and normal BMD (90%) received anticonvulsants. It has been shown that anticonvulsants have a negative impact on BMD 30, probably due to the adverse effects that they produce on bone mineral metabolism. These anticonvulsant drugs can produce hypocalcemia, hypophosphatemia, elevated alkaline phosphatase concentration, decreased vitamin D concentration, alterations in thyroid profile, and increased PTH concentration 7,13,31. It should be noted that in the present study, no significant association was observed between these medications and BMD, probably because the majority of participants were receiving anticonvulsant treatment. In addition, these biochemical alterations were not observed in children who received antiepileptic drugs and in children who did not receive them. Similar findings have been reported in previous studies. Cheng et al. 4 reported that there were no significant differences in biochemical parameters of bone metabolism between children who received anticonvulsants vs children who did not. Similarly, Chen et al. 9 conclude that there were no significant differences in bone turnover or other related to biochemical indicators of bone metabolism between children with CP and healthy children.
Valproic acid was the most commonly used drug in all participants with low BMD (77.3%) and normal BMD (83.3%). This drug is widely used in the pediatric population and causes metabolic acidosis, which damages the bone matrix and causes tubular renal dysfunction with greater urinary loss of calcium and phosphorus. Consequently, it could affect BMD 30,32.
The serum concentration of phosphorus and alkaline phosphatase explained 9.6% and 10% of the variability in bone mineral density (g/cm2), respectively, while the inverse relationship of TSH with BMD explained 9.9% of its variability. This finding could be explained by the fact that TSH inhibits the differentiation and function of osteoclasts by mechanisms independent of T3 and suppresses the activity of osteoblasts 6. Chen et al. 9 and Sharawat et al. 33 did not find a correlation between BMD and serum calcium, phosphorus and alkaline phosphatase concentrations. However, in the present study, 21% of the variability in BMD (Z-score) was explained by the serum concentration of phosphorus (p < 0.001), 20% by alkaline phosphatase (p < 0.001) and 8% by calcium (p = 0.036).
There was a clear trend in the correlation between the serum concentration of vitamin D and BMD (p = 0.056). Vitamin D, through its active metabolite 1,25(OH)2D3, exerts a double action at the bone level, mobilizes calcium and phosphorus toward the extracellular fluid to maintain an adequate serum concentration of these inorganic nutrients, normalizes the blood calcium and favors the mineral deposit in the bone 17. However, several authors have not found this correlation between BMD and serum vitamin D concentrations 10,1213-14,33.
We observed that the BMD in Z-score would be more oriented to the variables related to changes in BMD. This conclusion is based on the multivariate models designed in which it was observed that, with BMD in Z-score instead of g/cm2, the variables BMI, age and serum phosphorus explained 41% of the variability. On the other hand, with the BMD in g/cm2, only weight and serum phosphorus were included in the model that explains 54% of the variability.
A limitation of the study was due to the cross-sectional study design because we could not establish causality between exposure and effect. Another limitation was related to the sample size; in the analysis of some variables, a type II error was probably made. For example, in the association of greater serum concentration of phosphorus and alkaline phosphatase in non-malnourished children, in the association between malnutrition and lower serum concentration of vitamin D, in the association of gross motor function with lower serum vitamin D concentration, and in the association of polytherapy with below average serum concentrations of T4. In all cases, by duplicating the values of each cell of the contingency table, the probability improved significantly. Another limitation was that BMD was only measured in the lumbar spine. However, the measurement of BMD in the lumbar spine is valid 34 and has been used in different studies 10,12,20,21. The last limitation was that we did not measure serum concentrations of biomarkers of bone resorption because it was not feasible for the laboratory of the hospital to do it.
The main strength of the study was the demonstration of the association between biochemical indicators and hormonal biomarkers of bone metabolism and BMD in pediatric patients with quadriplegic CP in the Mexican population.
In conclusion, the present study demonstrated the direct correlation of BMD with serum concentrations of calcium, phosphorus, alkaline phosphatase, vitamin D and the inverse correlation with TSH in children with quadriplegic CP. BMD in Z-score would be more oriented to the variables related to changes in BMD, the variables BMI, age and serum phosphorus explained 41% of the variability.
The association of malnutrition, use of anticonvulsants and gross motor function impairment with biochemical indicators and hormonal biomarkers of bone metabolism was shown. Therefore, these variables should be monitored and controlled. For example, malnutrition may be prevented assuring a correct diet, an adequate use of anticonvulsants to prevent alteration of bone metabolism and optimized physical rehabilitation strategies to improve gross motor function. In this way, it would be possible to optimize the bone mineralization that could prevent the risk of osteoporosis and fractures in children with quadriplegic CP.
Further longitudinal studies are required to provide information about the association of BMD (measured at different skeletal regions) with biochemical and hormonal indicators of bone metabolism, as well as clinical assays to evaluate the effect of an integral treatment on those variables affecting the BMD in children with CP in medium and long terms.

