


 Servicios personalizados
 Inglés (pdf)
 Articulo en XML
 Referencias del artículo
 Enviar articulo por email
 Citado por SciELO
  Citado por Google
  Similares en
SciELO
Similares en
SciELO  Similares en Google
 Permalink
INTRODUCTION
Protein energy malnutrition (PEM) continues to be a public health problem worldwide, mainly in children under five years of age 1,2. In hospitalized pediatric patients, the prevalence of malnutrition ranges between 6% and 50%; this wide range of discrepant reported frequencies seems a consequence of the degree of development of the country analyzed 1,3,4,5,6. Some authors have described that, according to its severity, PEM can increase the morbidity and mortality of the hospitalized child 7. Several researchers have emphasized the importance of carrying out an adequate nutritional assessment of any child entering the hospital to identify any pediatric patients who are admitted with some degree of malnutrition 4,7,8,9 and those who are at risk of developing malnutrition during hospitalization 6,10. Several studies have shown that if an adequate assessment of a child's nutritional status is not carried out, no timely dietary management results and, as a consequence, the risk of complications and the length of the hospital stay increases 4,11,12.
Although there is some controversy about the usefulness of anthropometric indicators in the diagnosis of malnutrition 13, in general, there is a consensus that anthropometric indicators are adequate and accurate to assess nutritional status. In addition, they are noninvasive, low-cost, accessible, simple and practical 14,15. Particularly, the arm anthropometric indicators at the mid-upper-arm circumference (MUAC) and skin folds have been widely used in the hospital setting because they inform about body composition through the estimation of the total arm area (TAA), arm muscle area (AMA) and arm fat area (AFA) 15,16,17,18,19. Therefore, the purpose of this study was to estimate the indirect arm anthropometric indicators as an anthropometric expression of body composition and to explore its relationship with direct anthropometric indicators in hospitalized pediatric patients.
MATERIAL AND METHODS
An analytical cross-sectional study was carried out with 750 patients hospitalized in the Pediatric Division of the Nuevo Hospital Civil de Guadalajara during 2014. All patients admitted in the previous day in weekdays to any of the services of the Pediatric Division were included. Those who remained less than 72 hours in the Emergency Room, who were hospitalized in a clinical ward, and whose parents or legally responsible person signed the informed consent were included. We did not include patients in whom the anthropometric measurements could not be made and those who were re-hospitalized in a period of less than three months. Patients with incomplete records and/or data were excluded. For each participant (or relatives), a questionnaire was applied to the family member or legally responsible person that included general identification and sociodemographic data.
ANTHROPOMETRIC MEASUREMENTS
Previous standardization of two observers was performed using the Habitch method 20; the measurements of weight, length, and cephalic circumference with the techniques previously described were made upon admission 3. With the measurements taken, the Z-scores of the weight/length, weight/height, weight/age, length/age, height/age, head circumference/age, and BMI/age were estimated using the WHO Anthro version 3.2.2 and WHO Anthro Plus version 1.0.4 programs.
The World Health Organization (WHO) normal limits (± 2SD) were taken as a reference. The left mid-upper-arm circumference (MUAC) was obtained with a metallic metric tape (Rosscraft, USA). The triceps skinfold (TSF) was taken on the internal posterior surface of the previously marked middle part of the arm. The subscapular skin fold (SSF) was taken at the lower edge of the scapula. Both measurements were made with a Lange skinfold caliper (Michigan, USA). With MUAC and TSF arm areas were estimated with the Frisancho equations 21: total arm area (TAA): TAA (cm2) = MUAC (cm2)/(4 x π); arm muscle area (AMA): AMA (cm2) = [MUAC - (TSF (mm) x π]2 / (4 x π); arm fat area (AFA): AFA = TAA - AMA. Z-scores of these areas were estimated with the Sann reference values 22 for infants under 12 months and with the Frisancho reference (21) for children from one to 18 years. With the sum of the TSF and SSF, the percentage of body fat was calculated using the Slaughter equation 23 in a differentiated way by gender. For purpose of anthropometrical and statistical analyses, the total population was stratified into age groups according to the WHO: infants, toddlers, preschoolers, schoolchildren and adolescents 24.
STATISTICAL ANALYSIS
One-way ANOVA with post-hoc tests (Bonferroni, Dunne's T3) were used. The odds ratio was estimated to identify the probability of alteration of the nutritional status. Correlation matrices were made between the anthropometric indexes, arm areas and percentage of body fat. Finally, multiple regression models were designed with the anthropometric indices as dependent variables and the arm areas and fat percentage as independent variables. The outlier values that were considered due to measurement error or capture were excluded from the analysis. The software SPSS version 20 was used.
RESULTS
Of the 760 children included, 27% were infants (one to eleven months), 9% toddlers (12 to 23 months), 25% preschoolers (24 to 71 months), 21% schoolchildren (72 to 143 months) and 18% adolescents (144 to 216 months). The age average in months was 4.6 ± 3 in infants, 17.6 ± 3 in toddlers, 45 ± 14 in preschoolers, 104 ± 21 in schoolchildren and 172 ± 16 in adolescents.
Table 1 shows the raw data and Z-scores of the anthropometric indicators; significant differences were observed in the anthropometric indexes (Z) between age groups. Infants had a greater deficit compared to toddlers, preschoolers, schoolchildren and adolescents in almost all anthropometric indexes.
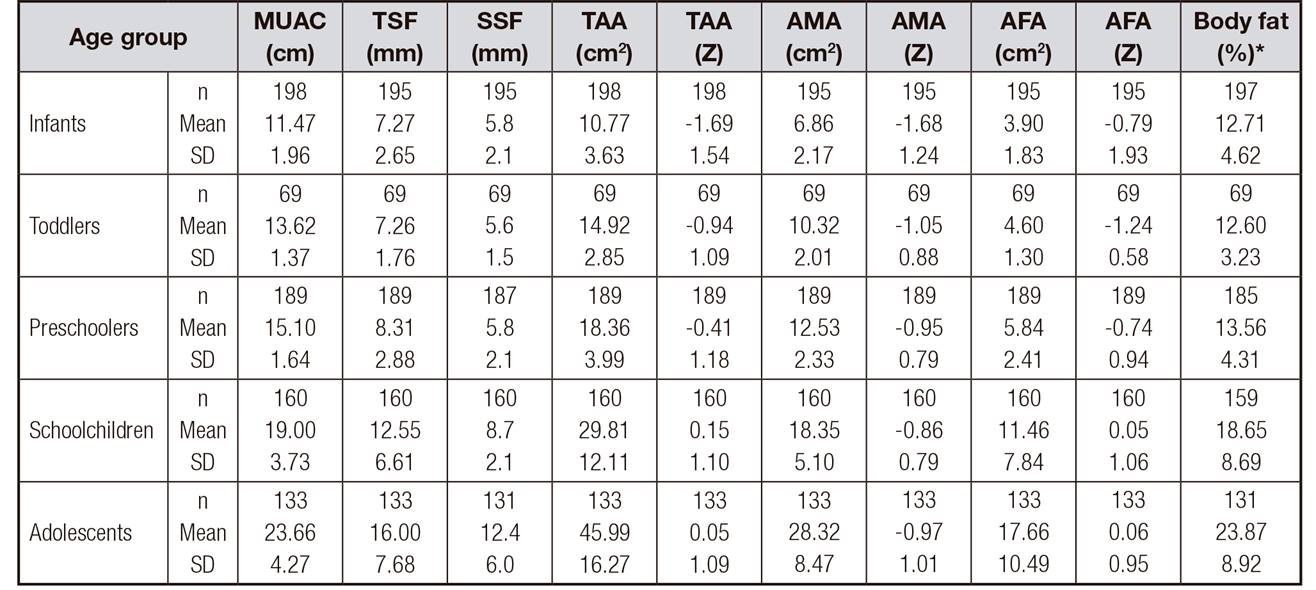
Table I. Raw data and Z-scores according to the age groups (n = 750). Comparison of values between groups

BMI: body mass index; Cephalic C: cephalic circumference.
*ANOVA differences between groups, p < 0.001; post-hoc tests; T3 by Dunnett and Bonferroni. Weight/age: infants vs toddlers p < 0.001; infants vs preschoolers p < 0.001. Height/age: infants vs toddlers p < 0.001; infants vs preschoolers p < 0.001; infants vs schoolchildren p < 0.001; infants vs adolescents p < 0.001; toddlers vs schoolchildren p = 0.001; preschoolers vs schoolchildren p = 0.001. Weight/height: infants vs toddlers p = 0.001; infants vs preschoolers p = 0.001. BMI/age: infants vs toddlers p < 0.001; infants vs preschoolers p < 0.001; infants vs schoolchildren p < 0.001; infants vs adolescents p < 0.001. Cephalic circumference: infants vs toddlers p < 0.001; infants vs preschoolers p < 0.001.
When analyzing the arm anthropometry, it was observed that the infants had a greater deficit in TAA (Z), AMA (Z) and AFA (Z) in comparison with the other age groups, and there was also a greater deficit in preschoolers versus schoolchildren and adolescents in TAA (Z) and AFA (Z) (Table 2).
Table II. Skinfolds and arm areas according to the age groups (n = 749). Comparison of arm areas between groups (Z-score)†
MUAC: mid-upper-arm circumference; TSF: tricipital skin fold; SSF: subscapular skin fold; TAA: total arm area; AMA: arm muscle area; AFA: arm fat area.
*Percentage of fat (Slaugther, 1988).
†ANOVA, differences between groups, p < 0.001; post-hoc tests; Dunnett's T3. TAA (Z): infants vs toddlers, preschoolers, schoolchildren and adolescents, p < 0.001; preschoolers vs schoolchildren and adolescents, p < 0.005. AMA (Z): infants vs toddlers, preschoolers, schoolchildren and adolescents, p < 0.001. AFA (Z): infants vs schoolchildren and adolescents, p < 0.001; toddlers vs preschoolers, schoolchildren and adolescents, p < 0.001; preschoolers vs schoolchildren and adolescents, p < 0.001.
There was a higher prevalence of acute malnutrition (BMI < -2 SD) in infants (31%) and in adolescents (13%); likewise, a higher prevalence of chronic malnutrition (height/age < -2 SD) was observed in infants (30%) and in toddlers (18%). It should be noted that the presence of overweight/obesity increased gradually with age, until it was noticeable in schoolchildren (11%) and adolescents (8%). With respect to arm areas (TAA, AMA, AFA), a higher deficit (≤ -2 SD) was observed in infants and toddlers. It should also be noted that there are differences between the indicators evaluated; for example, between the TAA and AMA against BMI, there were around 10% points of difference, with the TAA and AMA being more sensitive in the identification of acute malnutrition, especially in infants, toddlers and preschoolers (Table 3). There was an increased risk of deficit in TAA in infants, toddlers and preschoolers. In relation to the AMA and AFA, the risk of deficit was significantly higher in infants, and the same happened with the BMI. The risk of deficit of height/age index was higher in infants, toddlers and late preschoolers (Table 4).
Table III. Distribution of the frequency (%) of the anthropometric indexes and arm areas by age group in Z-score (n = 760)

TAA: total arm area; AMA: arm muscle area; AFA: arm fat area; BMI: body mass index.
Table IV. Probability of deficit (OR) in indicators of body composition by age group (< -2 Z) (n = 760)
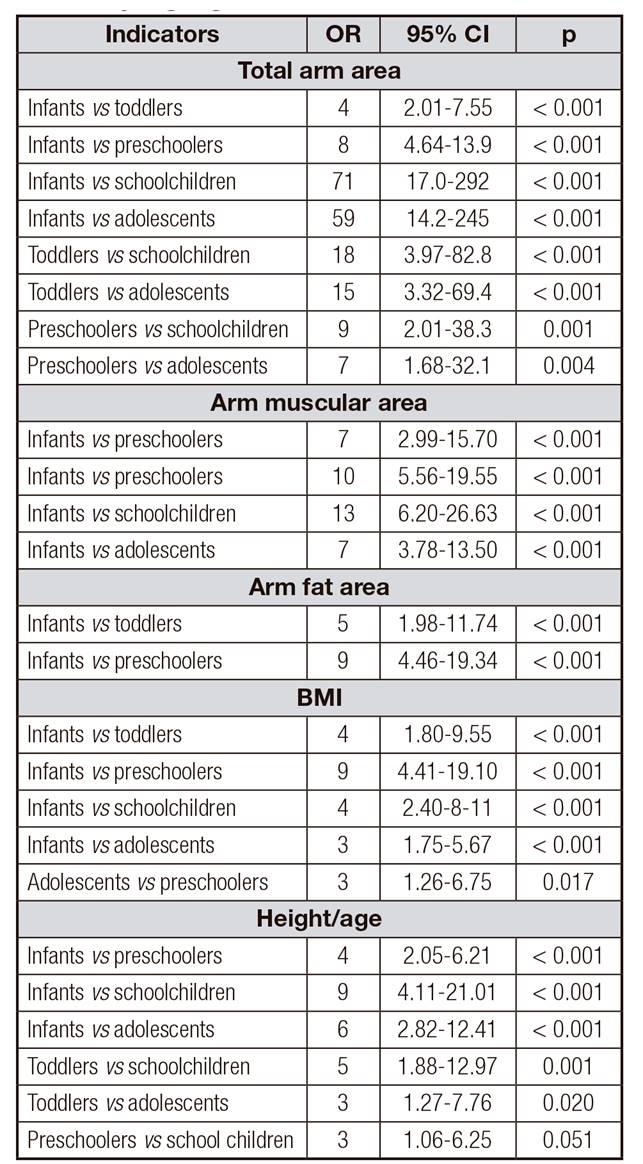
BMI: body mass index.
Table 5 shows the proportional direct correlations between the anthropometric indexes and the arm areas, which are directly proportional. When performing the linear regression, it was observed that the variability of the BMI is explained in 50% by the TAA, in 47% by the AMA, in 40% by the AFA, and in 46% by the percentage of fat. The variability of the weight/age index is explained in 53% by the TAA, in 51% by the AMA, and in 40% by the percentage of fat. The variability of the weight/height index is explained in 38% by the TAA, in 32% by the AMA, and in 42% by the percentage of fat. It should be noted that between the height/age index and the cephalic circumference, a positive correlation is maintained, where the height/age index predicts 46% of its variability.
Table V. Correlation and determination coefficients of Z-scores of indirect arm anthropometric indicators (independent variable) with Z-scores nutritional status and growth indicators (dependent variable) obtained in a sample of hospitalized pediatric patients

BMI: body mass index.
Table 6 shows the multiple linear regression models; it is observed that in children under 36 months of age, the variability of the BMI is explained in 67% by the AMA, AFA and percentage of fat; 31% of the variability of the cephalic circumference is explained by the AMA, AFA and percentage of fat. Likewise, the variability of the height/age index is explained in 35% by the AMA, AFA and percentage of fat. In patients older than 36 months, BMI variability is explained in 73% by the AFA and AMA; the variability of the height/age index is explained in 27% by the TAA, AMA and percentage of fat.
Table VI. Multiple Linear Regression Models*. Relationship between indirect anthropometric indicators (Z-score) and percentage of body fat† with direct indicators (Z score) (n = 749)

TAA: total arm area; AMA: arm muscle area; AFA: arm fat area; Cephalic C: cephalic circumference; BMI: body mass index.
*Stepwise method.
†Estimated fat percentage with Slaughter's equation (1988).
DISCUSSION
In the studied pediatric sample in hospitalized patients, it was observed that the prevalence of acute malnutrition (deficit in BMI) and chronic malnutrition (deficit in height/age) was higher in infants than in preschoolers, schoolchildren and adolescents. These findings do not differ from those observed by other researchers 4,5,6. The probability of deficit in arm areas was significantly higher in children under 24 months (infants and toddlers) than in the other age groups.
The frequency of deficit observed with these indirect anthropometric indicators of the arm coincided with the frequency of malnutrition described above with the anthropometric indexes of BMI and height/age. It is known that when there is an impairment in nutritional status, the reserves of fat and muscle (reflected in the areas of the arm) are significantly affected, particularly at early ages when growth and development are accelerated and there is greater metabolic activity. Therefore, any moderate or severe nutritional insult has a significant effect on nutritional status and body composition 3,15. These findings corroborate the hypothesis that arm areas are a useful tool in the diagnosis of malnutrition, especially acute malnutrition, regardless of the age group; it is also important to note that with the TAA and AMA, the identification of acute malnutrition increased by 10% points.
Another interesting finding refers to the positive correlations that occurred between the anthropometric indexes and body composition indicators. The correlation between BMI and TAA is noteworthy, since both indicators include fat and muscle mass; also, the correlation between BMI with the AMA and the AFA was observed previously 25,26. Hurtado-López et al. 17 mention that the anthropometry of the arm has a positive correlation with the indicators of body composition and, in turn, with linear growth. Their findings coincide with those observed in this study. As it has been observed, when the pediatric patient is undergoing a nutritional insult, the fat and muscle reserves are affected in the first instance; if the nutritional insult continues, linear growth is affected.
In the hospital setting, the prevalence of malnutrition is high, mainly in intermediate or intensive therapies 3,5,7. It should be noted that in these units of care for critically ill pediatric patients, a complete assessment of the nutritional status of the patient is not usually undertaken, due to the severity of the condition that prevents the patient from moving and/or the lack of adequate equipment to perform the proper anthropometric evaluation. Under these conditions, the evaluation of arm anthropometry is a good option, either as part of a comprehensive evaluation or as a specific alternative way of assessing nutritional status. This suggestion is based on the analysis of the multiple linear regression models, where it was observed that the anthropometric indexes are largely explained by the muscle and fat areas of the arm 16,25.
The arm anthropometry has been commonly used in the evaluation of patients with chronic kidney disease, chronic liver disease, and cystic fibrosis because the clinical conditions presented by these patients (visceromegaly, generalized edema, etc.) make it difficult to interpret weight/age, weight/height and BMI indexes 16,17,19.
There are several methods to evaluate body composition, such as dual energy X-ray absorptiometry (DXA) and bioelectrical impedance (IBE), among others 1. Among its advantages, the accuracy of the evaluation stands out; however, they are costly methods and are not always accessible in the hospital units that care for children, especially in less industrialized countries. In addition, the usefulness of these options in the hospitalized patient can be limited by the patient's clinical conditions, as is the case with IBE, which is affected by the patient's hydration conditions. Therefore, anthropometry of the arm would be an optimal, adequate, accessible and simple method for evaluating the body composition of the hospitalized patient, an opinion shared by other researchers 17,19,27,28,29.
One strength of the study is that the size of the sample was large and that different age groups with different pathologies were included. In addition, the length of the study period was a full year. One possible limitation was the outliers that had to be discarded in the statistical analysis.
In conclusion, the evaluation of arm anthropometry is a good option, either as part of a comprehensive evaluation or as a specific alternative way of assessing nutritional status. The measurement of the arm areas is a useful tool in the diagnosis of chronic-acute malnutrition, while the BMI only reflects an acute deficit in hospitalized pediatric patients.

