


 Custom services
 English (pdf)
 Article in xml format
 Article references
 Send this article by e-mail
 Cited by SciELO
  Cited by Google
  Similars in
SciELO
Similars in
SciELO  Similars in Google
 Permalink
INTRODUCTION
Chronic kidney disease (CKD) is considered as a global public health problem. Incidence has increased in the last 30 years, raising the number of patients requiring renal replacement therapy (RRT) 1. In Mexico, more than 12/million people have CKD, and around 55 thousand patients were on RRT according the Census of Patients with Chronic Renal Failure (CIRC) of the Mexican Institute of Social Security, that attends to 73% of the Mexican population 2.
RRT, although necessary, may promote adverse health outcomes, such as infections, greater risk of mortality, decreased quality of life and detriment in nutritional status. In CKD population, malnutrition is denominated protein energy wasting (PEW) 3. Some studies have documented a high prevalence of this condition, with ranges of 50-75% in pre-dialysis patients and 75% in patients on RRT 4,5. In peritoneal dialysis (PD) Mexican population, Yanowsky-Escatell described in 2017 a prevalence of 65% of this situation 6. The etiology of this complex condition is multifactorial. Uremia, low energy and protein intake, increase in basal energy expenditure, inflammation, metabolic acidosis and nutrient loss during RRT contribute to its development 3.
The diagnostic criteria of PEW proposed by the International Society of Renal Nutrition and Metabolism (ISRNM) require anthropometrical indicators (weight change, body mass index), biochemical (albumin, transthyretin, total cholesterol), body composition measurements (fat and muscle mass) and dietary intake parameters (protein and energy intake), which demands devices (skinfolds calipers) and software for nutrition analysis that sometimes are unavailable in clinical settings 7. Other nutritional assessment tools were studied to assess PEW identification, such as phase angle (PA) obtained by bioelectrical impedance analysis (BIA), which is a safe, inexpensive and noninvasive method. The PA is based on total body reactance and total body resistance, independently of weight, height and body fat, and has been proposed as a nutritional indicator in other clinical conditions (cirrhosis, cancer, surgery patients and others) 8,9,10,11. In CKD patients, a low PA is associated with nutritional risk and higher mortality 12. Overhydration (OH), defined as the fluid excess above the normally hydrated tissues can be assessed by BIA and predicts mortality in dialysis patients 13. However, body composition measurements and PA may be affected by OH, due to the fact that resistance and reactance are affected by total body water, and this measurements are incorporated into models to estimate body composition 13.
Mid arm muscle circumference, an indicator that involves mid arm circumference (MAC) and triceps skinfold, is recommended as a nutritional parameter by ISRMN criteria, however, no reference data for Latin-American population are available. MAC is a simple and reliable indicator that decreases in hemodialysis patients with advanced malnutrition 14. Data about PA and MAC as independent indicators to predict PEW in CKD patients on RRT are lacking.
In the present study, we examined the prevalence of PEW and the characteristics of PEW in CKD patients on RRT, and evaluate the predictive value of the PA and MAC forPEW risk detection.
MATERIALS AND METHODS
This is a cross-sectional analysis from a prospective cohort of patients with CKD on RRT. Data were collected between March 2014 and May 2017. The study was conducted in accordance with the Declaration of Helsinki. The procedures and measurements performed on the protocol are the conventional for patients on the same conditions in the hospital. It did not require an additional intervention that required authorization by the Ethics Committee. Written informed consent was obtained from all patients. We determined the power of the sample size assuming a type 1 error of 0.05 and a type 2 error of 0.2. Power obtained is 90% considering a difference in PA over 10% between patients with and without PEW.
All patients with CKD who are receiving outpatient hemodiafiltration (HDF) or automated peritoneal dialysis (PD) for ≥ 3 months at the Nephrology Department of the Instituto Nacional de Cardiología "Ignacio Chavez" in Mexico City were included in the study. Patients with pacemaker, age < 18 years, deteriorating general condition, severe edema or receiving continuous ambulatory peritoneal dialysis were excluded.
DATA COLLECTION
All demographic and clinical data (age, etiology of CKD, time on RRT and types of dialysis access) were collected from electronic medical records.
BLOOD SAMPLING
All blood samples were obtained using uniform techniques under fasting conditions before their scheduled dialysis sessions (HDF) or before the first dialysate exchange in PD patients. Cholesterol and albumin were determined.
BODY COMPOSITION
Weight and height were measured (Seca® model 700; Seca, Hamburg, Germany). MAC was measured with a metric tape (Seca® model 201; Seca, Hamburg, Germany) in the right arm except in patients with vascular access in that limb, in which case it was measured in the contralateral arm. Anthropometry was assessed using the standard procedures described by Lohman et al. 15.
Body composition was assessed by multifrequency BIA (InBody® model S10; Biospace, Seoul, South Korea). BIA measurements were obtained at a frequency of 50 Hz. Eight electrodes were placed on the surface of the thumb, fingers of the hand, and ball of the foot and heel with the patient in the supine position, after an overnight fasting and after drainage of PD fluids, or 30 min after HDF treatment ended. Metal objects were removed. Extracellular water (ECW), intracellular water (ICW), total bodywater (TBW), fat mass (%) and fat free mass (FFM) were estimated using formulated prediction equations in the manufacturer's software by measured impedance values in different frequencies. PA was recorded (the arc tangent of the Xc/R ratio). Fat free mass index (FFMI) (fat free mass / height2) and body mass index (BMI) (body weight / height2) were calculated. All anthropometrical and BIA measurements procedures were performed by trained nutritionist.
DIET ASSESSMENT
To assess diet, a semi-quantitative food frequency questionnaire (FFQ) validated in Mexican population was used 16,17. The FFQ includes data describing the frequency of consumption of 116 foods during the previous year, and collects information about the consumption of 14 different food groups and ten intake frequencies: 6 or more per day, 4-5 per day, 2-3 per day, 1 per day, 5-6 per week, 2-4 per week, 1 per week, 2-3 per month, 1 per month or less, and never. The questionnaire also included ten open-ended choices and information on vitamin and mineral use. The conversion from foods to nutrients was calculated using the Evaluation System of Eating Habits and Nutrient Consumption (SNUT). The SFFQ was made by staff trained in standardized data collection and entry procedures. We studied the amount of energy (kcal/kg) and protein intake (g/kg).
DIAGNOSIS OF PROTEIN ENERGY WASTING
Four categories for criteria diagnosis of PEW proposed by ISRNM were used: a) serum chemistry (low serum levels of albumin [< 3.8 g/dl] or total cholesterol [< 100 mg/d]); b) body mass (decreased BMI [< 23 kg/m2 using dry weight]); c) muscle mass (FFMI < 17.0 or 15.0 kg/m2 in men and women according ESPEN and GLIM definitions 18),(19; and d) dietary intake (unintentional decreased protein intake [< 0.8 g/kg of protein] or energy intake [< 25 kcal/kg]). We included another category: over-hydration (ECW/TBW > 0.385), which is correlated with inflammation status in CKD patients 20,21. PEW was defined with the presence of at least three of the five listed categories in patients and at least one test result in each of the selected categories. Patients were then divided into two groups according to the presence or absence of PEW.
STATISTICAL ANALYSIS
Data were analyzed utilizing the SPSS Software version 17.0 for Windows (SPSS Inc., Chicago, IL, USA). Convenience sample was used and the total outpatient population that received HDF or PD was included. Whether the data was normal distribution or not, it was analyzed with the Kolmogorov-Smirnov test. Data with normal distribution were presented as mean ± SD and non-normally distributed data were presented as median (interquartile range).
Differences between PEW patients and non-PEW were assessed by the Mann-Whitney U test, Student's t test or Fisher's exact test according to the nature of the variable. The association of different variables with PA and MAC were calculated by Spearman's rank correlations.
To compare the ability of PA and MAC in order to predict PEW status, a receiver operating characteristic curve (ROC) was constructed. Area under the curve (AUC), cut-off values, sensitivity and specificity were calculated. An adjusted logistic regression analysis was performed to evaluate the ability of cut-off values obtained by ROC analysis adjusted to those variables that were significantly correlated by univariate analysis, and odds ratio (OR) were calculated. A p value < 0.05 was considered to be statistically significant.
RESULTS
This cross-sectional analysis included 69 patients on RRT. Forty-three patients were users of PD. Fifty-two (52%) were female. Demographical, anthropometric measurements and body composition parameters are presented in Table 1.

The patients were divided into two groups based on PEW diagnosis for CKD (Table 2): twenty-seven (39%) patients had PEW. Albumin concentrations (4.02 ± 0.36 vs 3.70 ± 0.36, p ≤ 0.001) and PA (4.99 ± 0.67 vs 4.18 ± 0.77, p ≤ 0.05) were significantly higher in non-PEW patients. PEW patients has a higher ECW/TBW (0.397 ± 0.007 vs 0.385 ± 0.008, p ≤ 0.001).
Table II. Differences between PEW and non-PEW CKD patients on automated peritoneal dialysis and hemodiafiltration

Mean ± SD or median (IQR).
*Statistics significance.
The correlation matrix for the PA and MAC with body composition/biochemical parameters is shown in Table 3. PA was significantly and positively correlated with MAC (r = 0.261, p = 0.030), albumin (r = 0.45, p ≤ 0.001) and FFM (r = 0.24, p = 0.04), and significantly and negatively correlated with over-hydration (r = -0.77, p ≤ 0.001). MAC significantly correlated with age (r = 0.285, p = 0.017), weight (r = 0.908, p ≤ 0.001), height (r = 0.262, p = 0.029), BMI (r = 0.944, p ≤ 0.001) and FFM (r = 0.508, p ≤ 0.001).
Table III. Correlations matrix of nutritional variables with phase angle and mid arm circumference

*Statistics significance.
Figure 1 shows the ROC curve with the values of diagnostic accuracy of PA and MAC in the identification of PEW. The curve reveals that PA (AUC = 0.776, 95% CI 0.660-0.892, p < 0.001) and MAC (AUC = 0.661, 95% CI 0.517-0.806, p = 0.024) provides good diagnostic accuracy to distinguish between non-PEW and PEW patients. The optimal cut-off value for PA was 4.64° with 77.7% sensitivity and 76.1% specificity. For MAC, a cut-off value of 29.6 cm shows a sensitivity of 66.6% and specificity of 69.0%. A multivariate analysis was performed to calculate the risk of developing PEW using the obtained cut-off values (Table 4). The results showed that PA < 4.64° and MAC < 29.6 cm were significantly related to PEW after adjusted to multiple confounders.
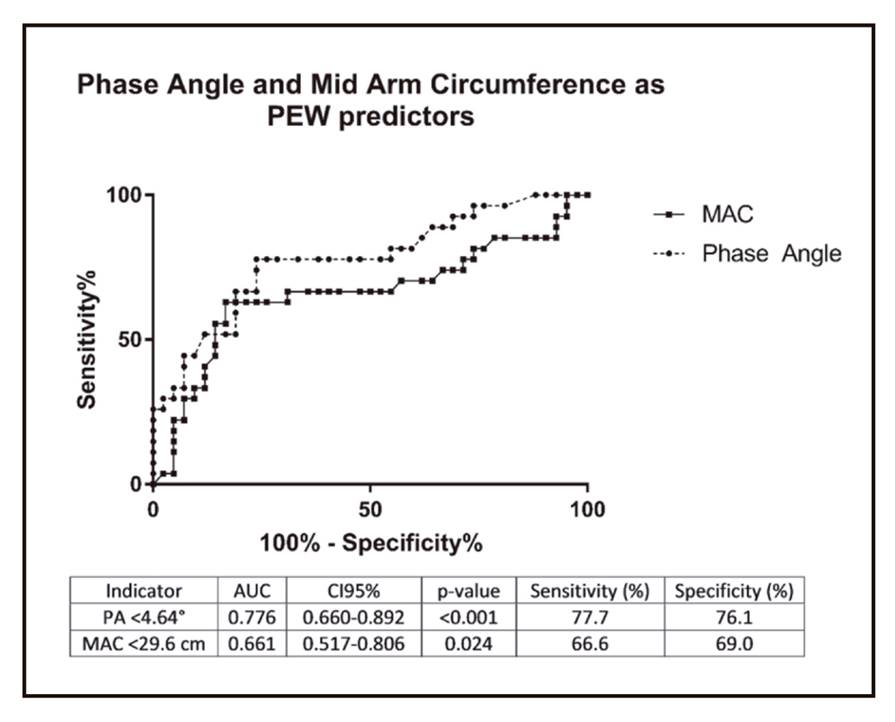
Figure 1. A receiver operating characteristic curve assessing an optimal cut-off point of phase angle and mid arm circumference as indicators for PEW assessment
Table IV. Phase angle and mid arm circumference as variables to predict protein energy wasting logistic regression analysis

CI: confidence interval.
*Non adjusted.
†Adjusted to age, gender and albumin concentrations.
‡Adjusted to age, gender, body weight, height.
βunstandardized regression b coefficient.
DISCUSSION
The importance of nutritional status in CKD patients has been widely recognized, since poor status is associated with increased mortality rates and decreased quality life 22,23. This study indicates that PA and MAC are useful indicators for predicting PEW in CKD on RRT. In our population, 39% of patients had PEW. The prevalence in our sample is lower than in others countries; in Spain, Ruperto M reports that 52% of elderly patients on hemodialysis have PEW 24, while Pérez-Torres A et al. describe PEW in 30.1% of adults (media of 66.1 years) 25 or India (70% in PD patients) 24,26.
Many factors contribute to increasing the risk of malnutrition during aging (changes in food intake, inactivity, increase in fat mass and proinflammatory cytokines) 27. Differences in prevalence may be explained by differences in age of populations, because our sample was younger than that of others studies (34 years vs 68 years in the study by Ruperto M et al.).
The best method to determine PEW, however, remains under debate. The ISRNM proposed an expert panel and developed a PEW definition and classification, and other tools were proposed to assess this condition, such as simple score (French PEW test) and malnutrition inflammation score (MIS), which includes biochemical (total iron binding capacity) or energy and protein intake (requires an electronic dietary assessment tool or software to nutritional analysis), which are not available in all hospital settings in developing countries 28. In order to facilitate the PEW identification in CKD patients, this research aims to explore other nutritional indicators easily obtained and available.
Da Silva et al. concluded in their study of 101 patients in HD that the bioelectrical impedance vectors parameters showed a low to moderate precision in men and low in women for malnutrition diagnosis 29. Considering that the BIA is a tool increasingly used in HD and PD units, and that PA is a good predictor marker of clinical outcomes and PEW in other populations 30, we suggest an external validation of our findings previous to the implementation of an exhaustive nutritional assessment by a renal dietitian in RRT patients with PA < 4.64°. This value cut-off point differs from the value proposed by Ruperto M and Sarmento-Días M, who established PEW with results < 4.0° and < 6.0° for hemodialysis and PD, respectively 24,31. In other clinical populations, a value < 5.52° has been associated with malnutrition in patients with colorectal cancer 32, and values < 4.9° are associated with malnutrition and increased in the incidence of hepatic encephalopathy in patients with cirrhosis 11.
In patients with CKD, PA has also been used as a predictor of other complications, as well as decreased values are associated with an increase in mortality 13, oxidative stress 33, mortality and risk of infections 34 in patients on hemodialysis, and with vascular calcification and arterial stiffness in patients with PD (31).
In the study carried out by Arias-Guillén M et al., PEW patients were more overhydrated (OR 5.24, IC 95% 1.6-17.14, p = 0.006) 35. The inclusion of hydration status may be another useful indicator to PEW identification, agreeing with our diagnostic PEW criteria.
Similar observations, Caravaca F et al., in our population PA is associated with albumin (r = 0.45, p < 0.001) and body water distribution (r = -0.77, p < 0.001) 36. Similar to our findings, Da Silva AT reports an association between PA and MAC (29), while Arias-Guillén M reports low MAC in PEW patients (19.7 ± 2.2 cm vs 23.8 ± 2.5 cm in well-nourished patients). To our knowledge, there are no available studies proposing cut-off values to predict PEW in RRT patients. In inpatient population, MAC ≤ 22.5 correlates properly with a BMI < 18.5 kg/m237.
The measurement and interpretation of PA and MAC by nurses or nephrology staff in dialysis centers where there are no renal dietitians may improve the PEW identification, and subsequently, proper reference to the specialist in renal nutrition care.
The present study has some limitations that should be considered: a) our results cannot be extrapolated to patients in hemodialysis or continuous ambulatory PD because our population only included patients in HDF and automated PD; b) the sample size is limited to the total patients who are receiving outpatient RRT in our hospital; c) our population is younger than a large part of the population in RRT; and d) the diagnosis of PEW was performed according to that proposed by the ISRNM, classification not validated for the Mexican population. Our phase angle findings could also apply to patients with similar characteristics. Future research should examine the accuracy of PA in aging and in patients who receive hemodialysis or continuous ambulatory PD.
In conclusion, PEW is present in almost 39% of the RRT patients. PA and MAC are useful, simple and independent indicators for predicting PEW in CKD patients on RRT.

