


 Custom services
 English (pdf)
 Article in xml format
 Article references
 Send this article by e-mail
 Cited by SciELO
  Cited by Google
  Similars in
SciELO
Similars in
SciELO  Similars in Google
 Permalink
INTRODUCTION
Older adults are at increased risk of vitamin D deficiency because of an age-related decline in the efficiency of vitamin D synthesis and metabolism, and limited sun exposure (1,2). Insufficient vitamin D intake, race, adiposity, and chronic diseases may also contribute to inadequate vitamin D status (3). Previous population-based studies have reported a significant positive association between 25-hydroxyvitamin D (25(OH)D) concentrations and bone mineral density (BMD). For instance, among participants in the Longitudinal Aging Study Amsterdam, BMD parameters increased up to the serum [25(OH)D] level of at least 50 nmol/L, while among participants in the National Health and Nutritional Examination (NHANES) III Survey, BMD of the hip increased with higher serum 25(OH)D levels up to about 80 nmol/L (4,5).
A recent analysis of the NHANES cycles 2011-2014 reported that 2.9 % and 12.3 % of U.S. adults aged 60 years and older were at risk of 25(OH)D deficiency and inadequacy, respectively. Notably, the prevalence of the risk of 25(OH)D deficiency was less than 5 % for all races among vitamin D supplement users (6). Although vitamin D supplements have been consistently reported to be a main determinant of adequate 25(OH)D status, a low prevalence of vitamin D supplements has been described among older adults across different latitudes (7, 8 9 10 11 12). Despite this evidence, a few studies have been conducted to examine factors associated with vitamin D supplementation, particularly in older adults (13,14). Thus, the present study aimed to examine the associations between demographic, lifestyle, and certain health characteristics of older adults and vitamin D supplementation. A secondary objective was to assess the effect of vitamin D supplements on 25(OH)D concentrations according to BMD status.
METHODS
The NHANES is a biannual cross-sectional study conducted by the National Center for Health Statistics of the Centers for Disease Control and Prevention. The purpose of the NHANES is to collect data about the health, nutritional status, and health behaviors of the noninstitutionalized civilian resident population in the U.S. The NHANES data were obtained using a complex, multistage probability sampling design to select a sample representative of the U.S. civilian household population (15). In this analysis, 6,068 participants aged 60 years and older were selected in the NHANES cycles 2007-2010 and 2013-2014; those with missing data on BMI (n = 369), dietary supplements (n = 7), and 25(OH)D levels (n = 755) were excluded, leaving a total sample size of 5,204 older adults. Participants with missing data were more likely to be non-Hispanic blacks, had less than high school education, were physically inactive, and reported fair to poor health.
CHARACTERISTICS OF PARTICIPANTS
The demographics file provides individual, family, and household level information on the following topics: The six-month time period when the examination was performed (November 1st through April 30th and May 1st through October 31th), age, gender, race/ethnicity (Mexican American and other Hispanics grouped as Hispanic, non-Hispanic white, non-Hispanic black, and other races), education (< high school, high school/GED equivalent, some college or AA degree, college graduate or above). The ratio of family income to poverty threshold as a measure of socioeconomic status was calculated, and families with a ratio < 1.00 were considered below poverty level. In the Mobile Examination Center, the body mass index (BMI) was calculated as body weight (kilograms) divided by height (meters squared), and subjects were classified as normal-weight (< 25.0 kg/m2), overweight (25.0-29.9 kg/m2), or obese (≥ 30 kg/m2). Since underweight subjects accounted for a small number of participants (n = 77), they were grouped with normal-weight participants. Smoking status was classified as current, former, or never smoker. Participants were also asked "In any one year, have you had at least 12 drinks of any type of alcoholic beverage?" Those who responded affirmatively were defined as alcohol users. Moreover, subjects were asked "Is there a place that you usually go when you are sick or need advice about your health?" and "Are you covered by health insurance or some other kind of health care plan?" Those who responded affirmatively to these questions were defined as having access to health care and health insurance, respectively.
The Physical Activity Questionnaire was used to assess participants’ leisure-time physical activity status. The reported number of days and time in minutes spent performing vigorous or moderate leisure-time physical activity in the previous week were calculated. Based on the 2008 Physical Activity Guidelines for Americans, three levels of physical activity were created: 1) participants who engaged in ≥ 150 min/week of moderate activity, or ≥ 75 min/week of vigorous activity, or ≥ 150 min/week of an equivalent combination were defined as physically active; 2) insufficiently active were considered those who reported some physical activity, but no enough to meet the active definition (> 0 to < 150 min/week); inactive were those that reported no physical activity (16).
Older adults reported their general health, which was categorized as good to excellent and fair to poor. The diagnosis of diabetes was established if participants reported a physician diagnosis of diabetes or had HbA1c ≥ 6.5 % (17). Moreover, the number of comorbidities was assessed by asking participants "Has a doctor or other health professional ever told you that you had arthritis, congestive heart failure, coronary heart disease, stroke, chronic bronchitis, or cancer?" Based on the number of comorbidities, a comorbidity score was created (0, 1, ≥ 2).
The 2007-2010 and 2013-2014 femur scans were acquired with Hologic QDR-4500A fan-beam densitometers (Hologic, Inc., Bedford, Massachusetts, USA) and software version Discovery v12.4. The DXA examinations were administered by trained and certified radiology technologists. Further details of the DXA examination protocol are documented in the Body Composition Procedures Manual located on the NHANES website (18). As recommended by the WHO, 20- to 29-year-old non-Hispanic white women from NHANES III were used as the reference group. The specific NHANES III cutoff values used to define osteopenia and osteoporosis were 0.561 to 0.74 g/cm2 and 0.56 g/cm2 or less for the femur neck, respectively (19). In the Osteoporosis file, participants were asked "Have you ever taken any prednisone or cortisone pills nearly every day for a month or longer?" Those who responded affirmatively to this question were defined as glucocorticoids users.
VITAMIN D INTAKE
The NHANES dietary data were used to estimate vitamin D intake from the types and amounts of foods and beverages consumed during the 24-hour period prior to the interview. All NHANES participants responding to the dietary recall interview were also eligible for the dietary supplement and antacid use questions. Each total intake record contains the total number of supplements and antacids reported for that participant, and the mean daily intake aggregates of 34 nutrients/dietary components from all supplements and antacids, as calculated using the NHANES dietary supplement database. Data were routinely examined for discrepancies and erroneous entries. Trained nutritionists reviewed the incoming data and matched the reported dietary supplement entries to known supplements from the in-house product label database, where possible; sought additional product labels if feasible; assigned generic or default supplements as appropriate; transferred or removed products that were not considered dietary supplements; and assigned matching codes (20).
25(OH)D CONCENTRATIONS
The CDC-standardized liquid chromatography-tandem mass spectrometry (LC-MS/MS) method was used for measurement of 25(OH)D during the study period, which allows laboratories and surveys to compare 25(OH)D measurements. The CDC decided to develop a LC-MS/MS method traceable to the NIST-reference materials for NHANES, and used this method starting with NHANES 2007-2008. The CDC recommends using the total 25(OH)D level in SI units (nmol/L) measured directly by LC-MS/MS, and converting this quantity to conventional units (1 nmol/L = 0.4066 ng/mL) if needed. This method has better analytical specificity and sensitivity compared to immunoassay methods, and fixed analytical goals for imprecision (≤ 10 %) and bias (≤ 5 %) (21).
STATISTICAL ANALYSIS
The descriptive characteristics of the study population were reported as percentages with their respective standard errors. The chi-squared test was used to compare the prevalence of vitamin D supplement use according to demographic, lifestyle, and health characteristics of the participants. Moreover, the proportions of older adults with dietary and supplements intake below the Estimated Average Requirement (EAR) for vitamin D were calculated according to BMD status. The EAR is the average daily nutrient intake level that is estimated to meet the nutrient needs of half of the healthy individuals in a life stage or gender group, which is 400 IU per day for vitamin D as recommended by the 2011 Institute of Medicine report (22). Logistic regression models were created to examine the associations between characteristics of participants and vitamin D supplement use while simultaneously adjusting for all statistically significant variables found in the bivariate analysis. In subgroup analyses, general linear models adjusted for six-month time period, age, gender, race/ethnicity, education, ratio of family income to poverty, BMI, smoking status, alcohol use, physical activity, access to health care and insurance, health status, diabetes, number of comorbidities, glucocorticoids use, and vitamin D intake from food were created to assess the independent effect of vitamin D supplements (none, 1-399 IU/day, 400-800 IU/day, and ≥ 800 IU/day) on 25(OH)D concentrations according to BMD status (normal, osteopenia, osteoporosis). Statistical analyses were performed using the SPSS Complex Sample software, V.17 (SPSS Inc, Chicago, Illinois, USA) to incorporate constructed weights for the combined survey cycles and obtain unbiased, national estimates representative of the older U.S. population. A p value < 0.05 was considered statistically significant.
RESULTS
A total of 5,204 participants with a mean age of 69.7 (SE, 0.1) years comprised the study sample. As shown in table I, the majority of older adults reported their race/ethnicity as non-Hispanic white. In addition, a significant proportion of participants were obese and physically inactive. In general, older adults reported good to excellent health, and had access to health care and health insurance. Of relevance, the crude prevalence of osteoporosis and vitamin D inadequacy was 7 % (SE, 0.5) and 14 % (SE, 0.5), respectively. Notably, only 45.3 % (SE, 1.1) of older adults reported taking vitamin D supplements, at least 400 IU/day, in the previous 30 days.
Table I. Characteristics of participants aged 60 years and older in the NHANES

SE: standard error; RIP: ratio of family income to poverty; AA: associate of arts degree; BMD: bone mineral density.
*Vitamin D intake from food and supplements.
As shown in table II, the prevalence of vitamin D supplementation was significantly higher among women, non-Hispanic whites, subjects with college education, and incomes above poverty level when compared to the rest. Similarly, a higher proportion of non-smokers, physically active subjects, and those who were found to be in good to excellent health reported taking vitamin D supplements. Moreover, as shown in table III, after adjustment for potential confounders, women, non-Hispanic white, college education, former smoker, physical activity, and > 2 comorbidities were characteristics of participants significantly associated with increased odds of taking vitamin D supplements.
Table II. Vitamin D supplementation use among adults aged 60 years and older

RIP: ratio of family income to poverty; AA: associates of arts; BMD: bone mineral density. Parentheses represent the standard errors of the estimates.
Table III. Determinants of vitamin D supplement use among U.S. older adults

RIP: ratio of family income to poverty; AA: associate of arts degree; BMD: bone mineral density. Models adjusted simultaneously for all variables shown in the table.
*Represents statistically significant odds ratios.
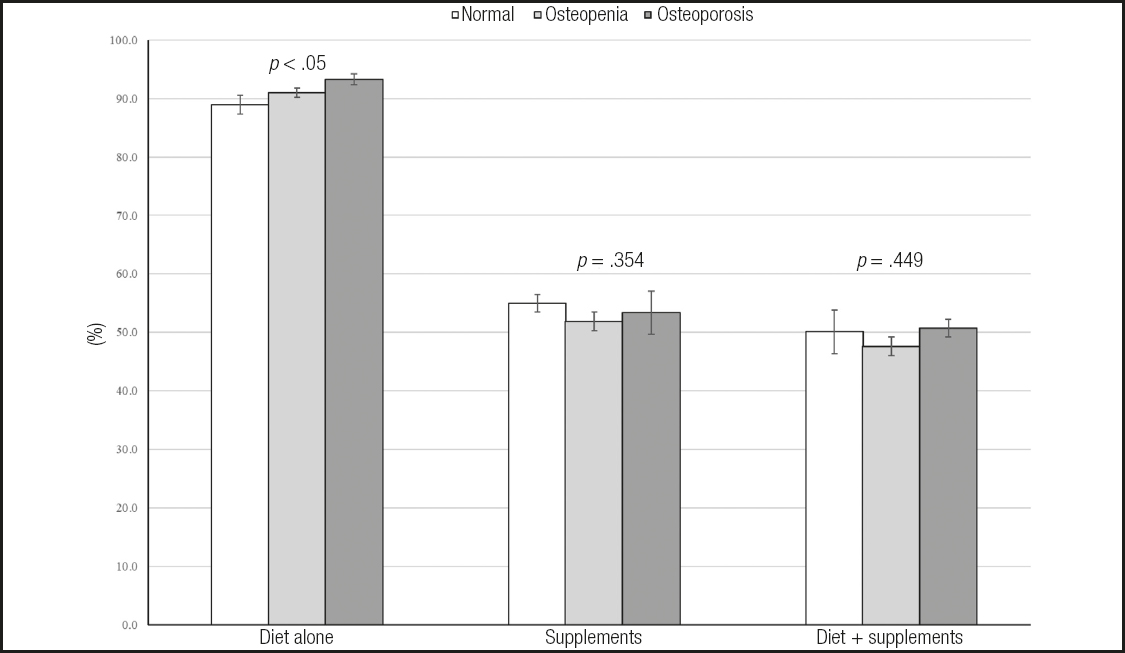
Figure 1 presents the percentage of older adults below the EAR for vitamin D stratified according to BMD status. Overall, 89 % (SE, 0.6), 91 % (SE, 0.8), and 93 % (SE, 1.6) of older adults with normal BMD, osteopenia, and osteoporosis did not meet the EAR for vitamin D with food alone, respectively. However, these percentages considerably decreased among vitamin D supplement users. For instance, the proportion of older adults with inadequate vitamin D intake across their BMD status decreased by about 49 % while adding vitamin D supplements to sources from food.
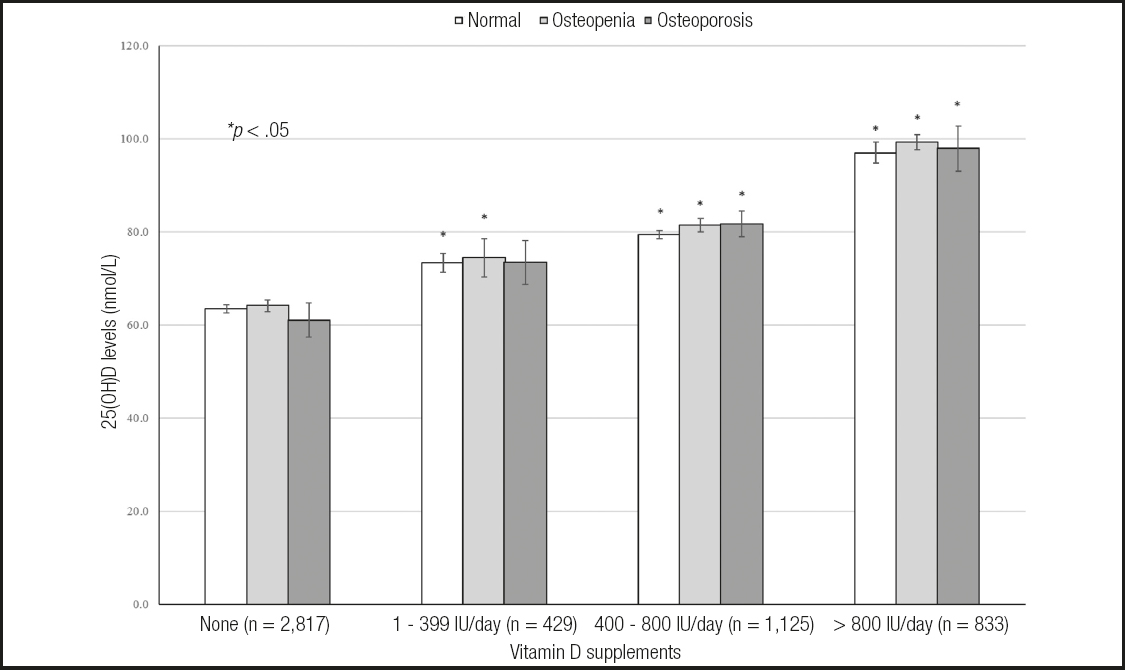
As shown in figure 2, 25(OH)D concentrations linearly increased as vitamin D supplement doses also increased across BMD status. Notably, even after adjustment for potential confounders and vitamin D from food sources, older adults with osteoporosis who reported taking daily vitamin D supplements between 400 and 800 IU or ≥ 800 IU had on average 20.7 nmol/L and 36.9 nmol/L higher 25(OH)D concentrations as compared with their vitamin D non-user counterparts, respectively.
DISCUSSION
The present findings indicate that, overall, 52 % of U.S. older adults reported taking vitamin D supplements in the previous 30 days. However, vitamin D supplements use differed across demographic, behavioral risk factors, and certain health characteristics of the participants. Indeed, after adjustment for potential confounders, higher odds of vitamin D supplement use were seen among women, non-Hispanic whites, those with college education, never smokers, and subjects physically active than those who did not meet these criteria. Consistent with our findings, Wallace et al. reported that vitamin D disparities in the U.S. were mostly related to gender, race, household income level, and weight classification (23). Espino et al., in a study conducted among older Mexican Americans in the Southwestern U.S., demonstrated that gender, number of comorbidities, and treatment of osteoporosis were factors associated with increased odds of using calcium/vitamin D supplements (14). Among Canadians aged 45 years and older who participated in the Community Health Survey during 2008-2009, women had higher odds of vitamin D supplement use than men in all age groups. Moreover, vitamin D supplement use was also prevalent among participants with higher level of education and household income, and among those with chronic conditions. Thus, the authors concluded that higher income and education suggest a strong socio-economic impact with regard to purchasing vitamin D supplements or being aware of their health benefits (13).
Overall, the majority of older adults regardless of their BMD status did not meet the EAR for vitamin D with diet alone. However, this proportion decreased on average by 40 % among vitamin D supplement users. Despite this significant improvement in vitamin D intake while taking supplements, an estimated 49 % of older adults did not meet the EAR for vitamin D. Similarly, a previous study reported a high prevalence of inadequate vitamin D intake across all ages and genders, which was significantly decreased by using vitamin D supplements (23). Recently, Blumberg et al. demonstrated that the prevalence of vitamin D intake inadequacy decreased from 92.5 % with food only to 17.3 % when vitamin D supplements were added. In addition, as compared with vitamin D supplement nonusers, participants who reported taking vitamin D supplements 21 or more days decreased the odds of having vitamin D deficiency by 76 % (24).
Of relevance, vitamin D supplement use was prevalent in 56 % and 54 % of older adults with osteopenia and osteoporosis, respectively. Consistent with our findings, previous studies have reported a low prevalence of vitamin D supplementation ranging from 51 % to 54 % among European postmenopausal women with osteoporosis (25,26). Similarly, in a large study conducted among postmenopausal North American women receiving osteoporosis therapy, 40.5 % of the participants reported taking vitamin D supplements in doses < 400 IU per day (27). Despite this evidence, the present results indicate that 25(OH)D concentrations significantly increased as vitamin D supplement doses also increased even in subjects with low bone mass.
For instance, after accounting for potential confounders, participants with normal BMD, osteopenia, and osteoporosis who reported not taking vitamin D supplements had on average 25(OH)D concentrations at 63.4, 64.1, and 61 nmol/L, which significantly increased by 25 %, 26 %, and 33 % among those taking vitamin D supplements between 400 and 800 IU per day, respectively.
The National Osteoporosis Foundation guidelines for the management of osteoporosis recommend a daily vitamin D intake between 800 and 1,000 IU for adults aged 50 years and older (28). Previously, the Institute of Medicine reported a dietary allowance for vitamin D of 600 IU for subjects aged 57-70 years, and of 800 IU for those > 70 years (22). Likewise, the present study results suggest that vitamin D supplements between 400 and 800 IU per day may be adequate to reach optimal 25(OH)D concentrations among older adults, irrespective of their BMD status. Although older adults who reported taking vitamin D supplements in doses > 800 IU per day reached the highest 25(OH)D concentrations, a recent 3-year randomized clinical trial of 3 daily doses of vitamin D (400, 4,000, and 10,000 IU) conducted among healthy Canadians aged 55 to 70 years failed to demonstrate a positive effect of vitamin D on volumetric BMD and estimated bone strength at the radius and tibia. Moreover, non-significant changes in areal BMD at the total hip were found following high-dose vitamin D supplementation (29). Similarly, a systematic review and meta-analysis of trials assessing the effects of vitamin D supplementation on BMD reported that vitamin D effects were greater in studies where participants had lower baseline 25(OH)D concentrations, were given smaller vitamin D doses, and were not given calcium (30).
Several limitations should be mentioned while interpreting the study results. First, the temporal relationship of the study findings may not be established due to the NHANES cross-sectional design. Second, participants self-reported their demographic, lifestyle, and certain health characteristics, which may have been a source of recall bias. Third, the type of vitamin D supplementation may not be determined because the total dietary supplement use data combine ergocalciferol and cholecalciferol. Fourth, sunlight exposure, sunscreen use, and skin reaction to the sun after non-exposure, which may significantly affect the synthesis of vitamin D, were not reported. Finally, the effect of latitude on 25(OH)D concentrations was unknown. However, serum 25(OH)D samples in the NHANES are collected from May through October in the northern U.S., and from November through April in the southern U.S.
In conclusion, demographic and healthy lifestyle characteristics are the main determinants of vitamin D supplementation among U.S. older adults. Moreover, even among subjects with decreased bone mass, vitamin D supplementation at between 400 and 800 IU per day seems to be adequate to achieve sufficient 25(OH)D concentrations.

