


 Custom services
 English (pdf)
 Article in xml format
 Article references
 Send this article by e-mail
 Cited by SciELO
  Cited by Google
  Similars in
SciELO
Similars in
SciELO  Similars in Google
 Permalink
INTRODUCTION
The importance of continuous monitoring of a person’s health and fitness during the entire lifetime is well known, especially when the goal is to diagnose and treat diseases in early stages. However, comprehensive health examinations are expensive and require trained staff and modern technical equipment, which is available only in medical institutions. On the other hand, on-site fitness tests are quite affordable, practical and provide a possibility to test the physical characteristics of a large group of people within a very short time (1-6).
For example, it has been proposed that handgrip strength testing, among others, should be part of field-based test batteries for the assessment of physical fitness (7), as not only can hand - grip strength be used to rapidly assess one’s general muscle strength (8), but it has been associated with numerous medical conditions across various age groups. More specifically, weak handgrip strength has been associated with an increased metabolic risk in children (9), diabetes and other cardiometabolic risk factors in adults and the elderly (10) and has been associated with other parameters of physical fitness (11). In addition, the grip dynamometer test can help predict a person’s nutritional status (12) and can help identify people suffering from malnutrition (13). The test has also been suggested as a tool to diagnose neuromuscular disorders, such as spinal muscular atrophy (14,15), muscular dystrophy (16), and sarcopenia in the elderly (17).
As Rosenberg writes (18), sarcopenia occurs as a result of age-related muscle mass and muscle strength reduction and it occurs in the last stages of aging. Although sarcopenia is a disease that is primarily related to the older population, recent research suggests that it can also develop in children (18). Although children may have insufficient muscle mass, the increase of obesity, which has being reaching epidemiological proportions worldwide, is another problem (20).
In children, it is not known whether muscle mass deficiency contributes to obesity or vice versa, however past research suggests that obesity seems to contribute to the development of sarcopenia resulting in what is called “sarcopenic obesity” (21).
Sarcopenic obesity is manifested when there is a disproportion between the non-fat component relative to the fat component (21,22). Because sarcopenia is usually associated with progressive muscle mass reduction in the elderly (17,13,24), sarcopenic obesity would probably be better defined as an imbalance between muscle mass and adipose tissue in children. Children may not look fat, however they may have a relatively low level of muscle mass compared to their peers, which may be a result of the high percentage of adipose tissue, as a consequence of which the child has seemingly normal or healthy appearance. This makes it difficult to identify children who may have sarcopenic obesity. Therefore, having a diagnostic tool to identify children with sarcopenic obesity is particularly important, since neglecting the treatment of any disease in children can result in health problems later in life.
Since children mature and develop at different speeds, comparing absolute measures derived from fitness measurements may not be as relevant as relative measures, which can be applied at different stages of development in both genders. Therefore, McCarthy et al (25) suggested that the ratio of skeletal muscle mass (SMM) to body fat mass (BFM), creating a muscle-fat ratio (MFR), could serve as an indicator of metabolic risk in children. Initially, the MFR was proposed by Park et al (26) to determine the association between muscle mass and metabolic syndrome (MS), but McCarthy et al (25) took an extra step and proposed a method for calculating cut-off values in children using body mass index (BMI) together with MFR. Kim et al (27) also used McCarthy’s method to identify children with sarcopenia. Unfortunately, MFR relies on precise measurements of the body composition (such as SMM and BFM), which are costly methods and a problem when large groups of people need to be measured. However, in clinical practice, the measurement of muscle strength may be used to diagnose sarcopenia rather than the percentage of muscle mass.
Cruz-Jentoft, et al. (17) suggested the use of hand grip strength as an indicator for the diagnosis of sarcopenia. Compared to methods such as dual energy x-ray absorptiometry (DXA) and bioelectric impedance (BIA), hand grip strength can be measured quickly and easily during field investigations. However, in order to consider changes in the maturation and body size of children, grip strength should be expressed as a relative value. As a relative hand grip strength measure, the grip-to-BMI ratio has been proposed for diagnosing sarcopenia in the elderly (28). Although a strong association has been found between low lean mass and grip-to-BMI ratio (28) in the elderly, there is limited information about such relationships in children.
According to this, the aim of the present research is to establish the relationships between MFR and grip-to-BMI ratio in the hopes that the grip-to-BMI ratio can prove to be an alternative to MFR for identifying children who may be at risk of developing sarcopenic obesity. Additionally, this study also aims to quantify the overall ability of the grip-to-BMI ratio to discriminate between children who are at risk of developing sarcopenic obesity and those who are not.
METHODS
PARTICIPANTS
The research was conducted on a sample of 4021 children from 19 primary schools in the central and eastern part of the Republic of North Macedonia, of which 8 are located in rural and 11 in urban areas. The sample was divided into two sub-samples by gender: 1987 respondents were boys and 2034 respondents were girls. The average age of the respondents was 8.6 ± 1.3 years.
The study included all students whose parents agreed to participate in the study, who were psychophysically healthy, and who regularly attended physical and health education classes. The respondents were treated in accordance with the Helsinki Declaration of 1961 (revision of Edinburgh 2013). The protocols were approved by the Ethics Committee at the University “St. Cyril and Methodius” in Skopje.
The measurements were carried out in March, April and May 2017 in standard school conditions at regular physical and health education classes. The measurements were performed by kinesiology and medicine experts, previously trained in performing functional tests and taking anthropometric measures.
OUTCOME MEASURES
Anthropometric measurements were taken according to standard methodology of International Biological Program (IBP) and according to the recommendations of World Health Organization (WHO) and Weiner-Lurie (29). Weight was measured in underwear and without shoes with an medical decimal weight scales, to thenearest 0.1 kg, and height was measured barefoot in the Frankfort horizontal plane with a telescopic height measuring instrument (Martin’s anthropometry) to the nearest 0.1 cm. Body mass index was calculated as bodyweight in kilograms divided by the square of height in meters.
Body mass and predicted body composition was measured using the Tanita BC-418MA single frequency (50 Hz) Segmental Body Composition Analyser (Tanita Corporation, Tokyo, Japan) with correction for light indoor clothing. The measurement procedure required the subject to stand in bare feet on the analyser and to hold a pair of handgrips, one in each hand. The BIA component of the measurements took approximately 30s per subject. As the BIA monitor used for this study provided separate measures of FM, FFM and predicted SMM in the limbs and trunk, a sum of the SMM in the four limbs (appendicular skeletal muscle mass, SMMa).
The prediction equations used in this model are based on bioimpedance, weight, height and age and were derived from calibration studies against whole-body DXA. For limb SMM prediction, segmental electrical measurements (resistance, reactance and impedance) were obtained and appendicular lean soft tissue (mainly skeletal muscle) predictive equations were derived. The impedance instrument used in this study has been validated against DXA in mixed populations of children and adults and found to be superior to previous BIA methods (30). In that study, DXA-derived SMM was not significantly different from, and highly correlated with BC-418 estimates (r = 0.96, P < 0.001). A pediatric validation of the BC418MA model against DXA and air-displacement plethysmography (BodPod Life Measurement, Inc. Concord, CA, USA) has also been performed (31). Again results were highly correlated with DXA (r = 0.91, standard error of the estimate = 4.46 %) and mean values did not differ significantly. In the current study, the within-day coefficient of variation for the sum of limb SMM was <1 %, similar to that previously reported (30).
With the use of a digital Takei TKK 5101 dynamometer (range, 1-100 kg), the maximum grip strength was measured for both hands.The subject holds the dynamometer in the hand to be tested, with the arm at right angles and the elbow by the side of the body. The handle of the dynamometer is adjusted if required - the base should rest on the first metacarpal (heel of palm), while the handle should rest on middle of the four fingers. When ready the subject squeezes the dynamometer with maximum isometric effort, which is maintained for about 3 seconds. No other body movement is allowed. The subject should be strongly encouraged to give a maximum effort. Then, the best value, whether from the right or left hand, was used as the maximal handgrip strength value. By dividing maximal handgrip strength by BMI, the grip-to- BMI ratio was calculated.
SARCOPENIA RISK DIAGNOSTICS
According to previous methodology used to define sarcopenia in children described by McCarthy, et al. (25) and Kim, et al. (27). Each gender was divided into quintiles of BMI z-score and the mean and SD of MFR were calculated for each quintile. A cut-off values were defined using mean and SD of MFR for the 3rd BMI quintile (ie, cut-off value = mean value – 2SD of MFR for the 3rd BMI quintile), and the proportions of sarcopenic subjects were examined.
STATISTICS AND DATA ANALYSIS
First, the data were tested for normality using the Kolmogorov-Smirnov test. Since the majority of data were not normally distributed, medians and interquartile ranges (IQR) for all variables were calculated for each gender separately. Differences between genders were tested using the Two-Sample Kolmogorov-Smirnov test for continuous variables and the Pearson Chi-Square test for categorical variables. Receiver-operating characteristics (ROC) were calculated to compare their predictive validity and to identify optimal cut-points (32,20). Pearson product-moment correlations were used to observe associations between MFR and grip-to-BMI. ROC curves were plotted using sensitivity and specificity measures based on grip-to-BMI ratio cut-points. A diagnostic test with AUC value equal to 1 is perfectly accurate, and another with value equal to 0.5 has no discrimination power. Optimal sensitivity and specificity were the values yielding maximum AUC from the ROC curves. The age-adjusted binary logistic regression model for each gender separately was used to estimate the odds of developing sarcopenic obesity according to MFR when a subject was at risk of sarcopenic obesity according to cut-off values in grip-to-BMI. Effect sizes are reported by odds ratios (ORs; i.e., exponents of the estimates. All the analyses were performed using the Statistical Package for Social Sciences software (SPSS, v. 22.0 for WINDOWS; SPSS Inc., Chicago, IL, USA), and values of p < 0.05 were considered statistically significant.
RESULTS
The research was conducted on a sample of 4021 subject, of which 1987 (49.4 %) were boys and 2034 (50.6 %) were girls from 6 to 10 years of age. The average age of the subject was 8.6 ± 1.3 years.
The characteristics of the sample are presented in table I. From the overview of table I which shows the values of the arithmetic means, the standard deviations and the level of statistical significance, it is observable that there are statistically significant differences between male and female subject in terms of the variables Height, Weight, BFP (%), BFM (kg), SMM (%), SMM (kg), MFR (kg/kg) and BMI (kg/m2). The obtained results show that boys are taller and heavier, they have higher percentage of muscle mass, higher percentage of fat tissue, higher body mass index values, lower MFR values and better absolute and relative values in the grip dynamometer test compared to girls. No statistically significant differences were found in the variables: number of subject, years and BMI z-scores. The values of the χ2 test (χ2 = 14.87, p < 0.001) suggest that there are statistically significant differences in the percentage values of sarcopenic obesity between boys and girls. The percentage values show that a higher percentage of boys have sarcopenic obesity (9.2 %) compared to girls (5.9 %).
Table I. Descriptive statistics of boys and girls
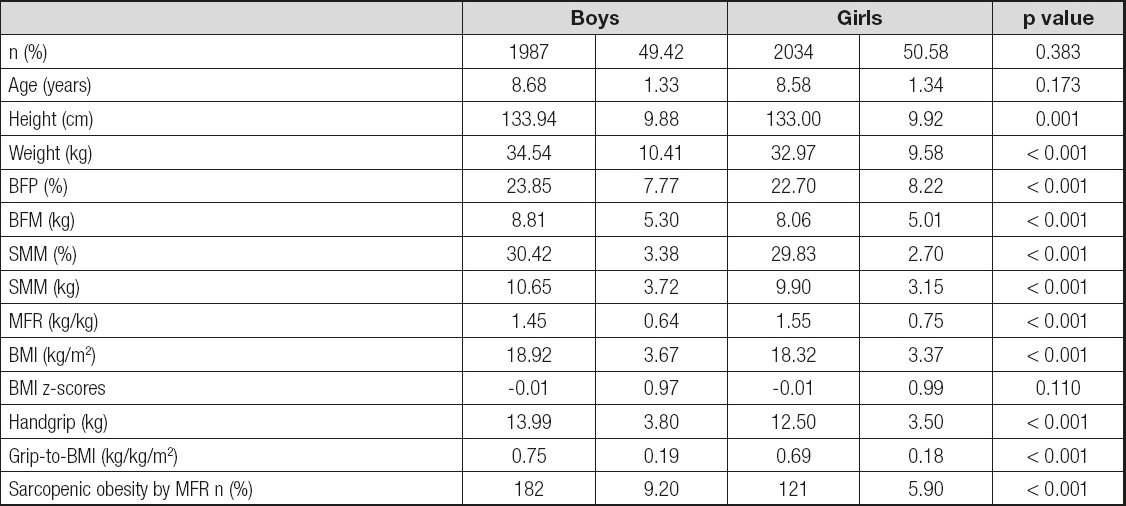
BMI: body mass index; SMM: skeletal muscle mass; BFM: body fat mass; MFR: muscle fat ratio. Two Sample Kolmogorov-Smirnov test for continuous variables and the Pearson Chi-Square test for categorical variables.
The Pearson’s correlation coefficients between Grip-to-BMI and MFR are shown in table II, figure 1 and figure 2. Grip-to-BMI positively and significantly correlated with MFR in boys and in girls (for boys: r = 0.501, p < 0.001; for girls: r = 0.417, p < 0.001).
Table II. Pearson’s correlation between MFR and grip-to-BMI

*Correlation is significant at the level of p < 0.001 (2-tailed).


The cut-off value for MFR using the 3rd BMI quintile was 0.77 (kg/kg) for girls and 0.83 (kg/kg) for boys. The AUC was 0.771 (95% CI, 0.752 to 0.789, p < 0.001) in girls 6-10 and 0.843 (95% CI, 0.826 to 0.859, p < 0.001) in boys 6-10 years old. The cut-off point was estimated as 0.658 kg/kg for girls 6-10, and 0.669 kg/kg for boys 6-10 years old. The cut-point of grip-to-BMI ratio of boys indicates higher percentage of true positives (PPV = 22 %) compared to that of the girls. On the other hand, the cut-point of the grip-to-BMI ratio of girls indicates higher percentage of straight negatives (NPV = 99%) compared to that of the boys. In addition, this cut-point for boys was what best expressed (LR+ = 2.75) how likely a positive result would be correct (grip-to-BMI ratio values below the cut-point) in individuals with measured MFR when compared with normotensive ones. The estimation of the optimal cut-off point is presented in table III. The ROC curves for girls and boys are shown in figures 3 and 4. According to the age-adjusted binary regression model, the OR (95% CI) was 20.182 (10.728-37.966, p < 0.001) in girls and 16.863 (10.782-26.371, p < 0.001) in boys.
Table III. Estimation of optimal cut-off point of grip-to-BMI ratio
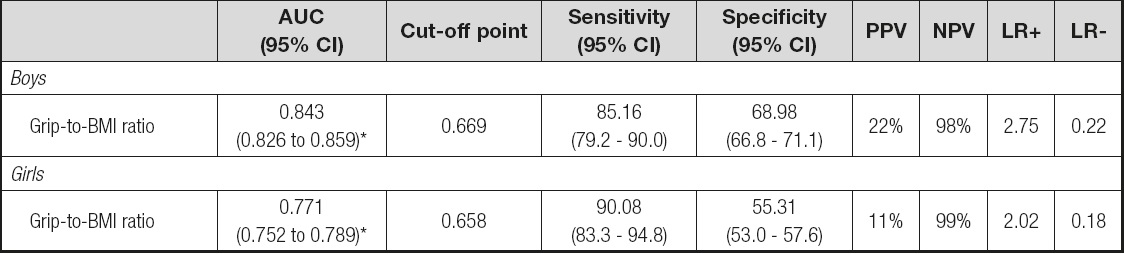
AUC: area under the curve; 95% CI: 95% confi dence interval; PPV: positive predictive value; NPV: negative predictive value; LR: likelihood ratio.
*p < 0.001.


DISCUSSION
The research conducted so far suggests that the analysis of an individual’s body composition can help diagnose sarcopenic obesity (21). Still, the direct assessment of body composition requires expensive equipment and trained staff and the ability to estimate specific aspects of body composition in children (e.g. low SMM) would prove to be valuable. The results of this study showed that the simple use of the relative values obtained from the grip dynamometer test, the grip-to-BMI ratio can be used as a tool to identify children at risk of sarcopenic obesity.
Although sarcopenia has traditionally been linked to muscle loss in the elderly, recent research has shown that sedentary children can develop sarcopenia as well (27). Unlike the elderly, where sarcopenia occurs as a result of degenerative processes, the cause why children are at risk of developing sarcopenia is quite different. Probably obesity, caused by a lack of physical activity and inadequate nutrition, plays a major role in the development of childhood sarcopenia, as the prevalence of childhood obesity has been reaching epidemiological levels worldwide (20,33).
As the percentage of body fat increases and MFR decreases, in favor of body fat, relative muscle strength likely decreases. Therefore, measuring relative muscle strength may be a logical alternative to costly body composition measurements in identifying children at risk of sarcopenic obesity. Although there are associations between muscle strength and child sarcopenic obesity, strength has been associated with sarcopenia in the elderly. Specifically, the poor result obtained in the grip dynamometer test is a better indicator for diagnosing sarcopenia in the elderly than the low muscle mass percentage (34). In addition, handgrip strength (17) and the grip-to-BMI ratio (28) are used for clinical assessment of sarcopenia in the elderly. However, in children, although there is a high correlation between body weight, height, and handgrip strength (34,35), there has been a lack of information in regard to the relationship between handgrip strength, fat mass, and muscle mass.
In children, MFR is considered a major indicator of low muscle mass (27). Unfortunately, the calculations of MFR depend on the anthropometric measures and the assessments of body composition that require the use of specialized equipment such as DXA or BIA. On the other hand, handgrip strength measurement is a relatively cheaper method and easy to apply. When the result of the grip dynamometer test is expressed in relative values, the grip-to-BMI ratio, one can discriminate between children who are at risk compared to those who have no risk of sarcopenic obesity. Children with low grip-to-BMI ratios were considered as having low odds of being diagnosed at risk of sarcopenic obesity by MFR. According to the standard interpretation of the AUC, grip-to-BMI provides an accurate estimation of sarcopenic obesity.
This study contains some limitations that are worth mentioning. First, the sample did not represent the entire population of children from Macedonia, since it did not include respondents from the western part of Macedonia. However, the sample was large enough and representative. Second, balancing the best cut off point is usually difficult, as any increase in sensitivity will be accompanied by a decrease in specificity. The prevalence of risk of sarcopenic obesity in our study was higher in both genders (9.2 % in boys; 5.9 % in girls) compared to the study by Kim, et al. (27) where it was found that only 0.1 % of Korean boys and 3.8% of Korean girls were at risk of sarcopenia II (2 SD), still, when the authors calculated class I sarcopenia as 1 SD lower than the mean MFR for the 3rd BMI quintile, the prevalence was higher: 32.1 % for boys and 24.3 % for girls (27). In addition, the authors used appendicular skeletal muscle mass measured by DXA, while in our research we used the bioelectric impedance (BIA) method. In the study by McCarthy et al. (25), the prevalence of risk of sarcopenic obesity was 9% in boys and 9.8 % in girls (25). In the study by Steffl, et al. (32), the prevalence of risk of sarcopenic obesity was 9.3% in girls and 7.2 % in boys. The authors also found that the cut-off point of grip-to-BMI ratio for girls from 4 to 9 years of age was 0.680 kg/kg and 0.721 kg/kg for boys. Additionally, although BIA has been shown to be a valid and reliable tool for assessing body composition (37), such systems are not capable of direct measurements and simply estimate body composition via electric signal transmission through the body, calculated using a set of normative anthropometric data. Therefore, it is possible to measure directly body composition, such as magnetic resonance imaging (MRI), computed tomography (CT) or use the combined method of DXA and bioimpedance and this can provide more accurate data. Furthermore, although MFR can be calculated by means of bioelectric impedance (BIA), which provides information on the amount of the fat component and the muscle component of the body, it is not possible for BIA to determine the root cause of the MFR (i.e. changes to the MFR could be caused by malnutrition, physical inactivity, chronic inflammation, myopathy, etc.). Therefore, any measurement using MFR should not be used to clinically diagnose sarcopenic obesity in children, but instead to provide a quick, valid, and reliable “first-glance” into children’s body composition, identifying those that may warrant a more detailed examination (38). The study did not take into account socioeconomic factors, family history, dietary factors, physical activity and gender-differentiated maturation could be a limitation of these results.
CONCLUSIONS
In line with the hypothesis, the main finding of this study is that grip-to-BMI was able to discriminate between children who may be diagnosed with sarcopenic obesity and may be used as a good on-site method. Future research should aim to confirm these findings by using samples from other populations. Although the methods proposed in this study cannot directly determine the presence of sarcopenia in children, these measurements can be used as a cost-effective and efficient method of identifying those at risk and who may need more detailed medical examinations, nutritional interventions, or exercise prescriptions. The results of this research enable countries with similar economic, ethnic and social characteristics to those in Macedonia to make use of these cut-points. The results of the research can also be used by professionals in the public healthcare system. The promotion of a healthy diet and appropriate physical activity should be a part of the general healthcare policy and a part of daily activities aimed not only at individuals but also the family, the collective and the population as a whole.

