


 Servicios personalizados
 Inglés (pdf)
 Articulo en XML
 Referencias del artículo
 Enviar articulo por email
 Citado por SciELO
  Citado por Google
  Similares en
SciELO
Similares en
SciELO  Similares en Google
 Permalink
INTRODUCTION
The International Diabetes Federation (IDF) defines diabetes mellitus (DM) as a chronic condition that occurs when insulin cannot be produced or used, and is diagnosed by the elevation of blood glucose. The IDF recognizes DM as one of the most important public health problems of the next millennium. According to the IDF's report, the number of diabetic patients worldwide is approximately 463 million, and this number is projected to reach 578 million by 2030, and 700 million by 2045. Also, DM and its complications caused the death of 4,2 million people in 2019, and it is of late one of the costliest chronic diseases in the world (1).
Many drugs have been used to treat diabetes and delay diabetes complications. However, the high costs and adverse effects of treatment have increased interest in complementary and alternative therapies. Therefore, the number of studies on alternative treatments using medicinal plants has increased recently (2). Among these medicinal plants, olive tree leaves, which are an important source of antioxidants, have been used in traditional treatments for centuries in regions where olives grow (3). Moreover, there are numerous academic studies reporting the benefits of olive leaf in terms of health (4 5-6). However, there are many bioactive molecules in the composition of olive leaves, with the most widely known and recognized compounds in OLE being secoiridoids (oleuropein, ligstrosid, I-methyloleuropein), flavonoids (kaempferol, apigenin, and luteloin), and phenolic compounds (hdyroxytyrosol, tyrosol, and caffeic acid) (7). Several experimental studies have reported the health benefits of these bioactive compounds, and these studies have focused on the antioxidant, antihypertensive, hypoglycemic, hypolipidemic, anti-inflammatory, and antiviral effects of these compounds (8 9 10 11 12-13).
Diabetes is a serious syndrome that may cause chronic complications such as neuropathy, diabetic kidney disease, retinopathy, cardiomyopathy, peripheral artery disease, coronary artery disease, and stroke. Oxidative stress has been an important part of the complex mechanism that leads to the development or aggravation of diabetes and its complications (14). Recently, the relationship between diabetic complications and oxidative stress has been emphasized (3,14,15). Glycemic control is considered the primary therapeutic intervention in DM because hyperglycemia causes an increase in lipid peroxidation, a change in glutathione redox state, and a reduction in antioxidant enzyme activity (8). However, interest in the use of natural antioxidants is increasing considerably to alleviate oxidative damage in diabetes. It is suggested that the negative effects of oxidative stress are reduced by supplementation with natural antioxidants. Therefore, we investigated the effect of olive leaf extract on oxidative damage and the progression of diabetes in a diabetic rat model.
MATERIALS AND METHODS
ANIMALS
Twenty-eight male Wistar albino rats weighing between 180 and 220 g were used in the study, and four rats were housed per cage. Rats were maintained under a 12: 12 light/dark cycle. The laboratory temperature was kept between 20 and 22 oC. The experimental protocol was certified by the Local Animal Ethics Committee in accordance with the Guide for the Care and Use of Experimental Animals. All rats were fed a standard rat diet and tap water ad libitum.
PREPARATION OF OLE AND CONTENT ANALYSIS BY HPLC
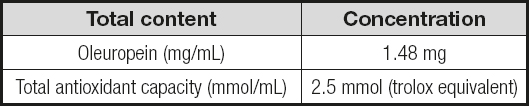
The olive leaves used in the study were obtained from the Izmir province, Turkey. The leaves were collected during the Fall, in November. Before the drying process, leaves were washed with distilled water at room temperature (25 oC), and then were stored until the removal of washing water. Then, they were dried at room temperature and granulated by a grinder until a powdered form was obtained. The dried and granulated leaves were treated with 70 % ethanol solution. To achieve fifty grams of dried and ground olive leaves, these were refluxed at 55 °C for 5 hours with 250 mL of 70 % ethanol. After the extraction process, the resolvents were filtrated and evaporated at 60 oC. The prepared samples were stored in the refrigerator at 4 °C during the experiment. The total amount of oleuropein and its equivalent antioxidant capacity in 1 mL of OLE are listed in table I.
EXPERIMENTAL INDUCTION OF DM IN RATS
In experimental rat studies, although higher doses of streptozotocin (STZ) are used in some of them, the common dose of streptozotocin used is in the range of 40-60 mg/kg for STZ-induced diabetic rat models [10,16]. In the present study, experimental diabetes was induced using a single intraperitoneal dose of 50 mg/kg of STZ (Sigma-Aldrich Corp, St Louis, MO, USA) after fasting for 18 hours. To prevent severe hypoglycemia, a 5 % glucose solution was given orally after two hours of the STZ injection. Standard tap water was given instead of glucose solution after eight hours of the STZ injection, and the rats had free access to food and water. DM was induced in all rats injected with STZ, and was defined by the measuring of fasting blood glucose levels three days after the STZ injection. Blood glucose levels higher than 300 mg/dL were considered to be diabetic.
EXPERIMENTAL DESIGN
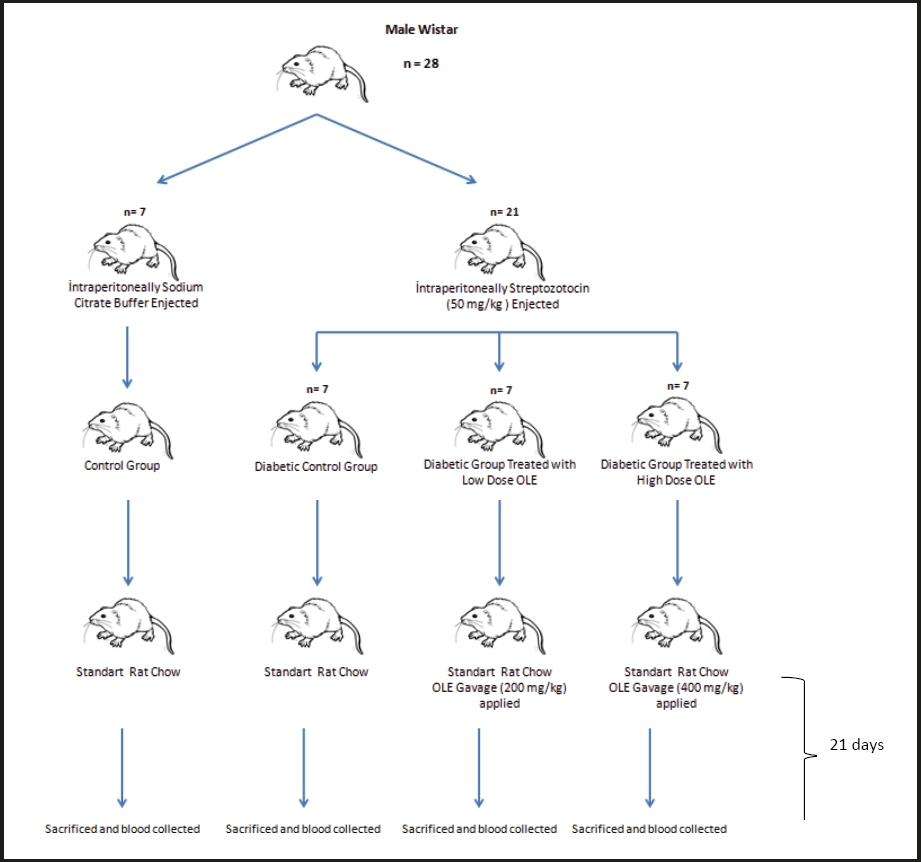
The rats were allowed to adapt for 10 days before starting the research. After the adaptation period, a total of 28 rats were divided into 4 groups, having 7 rats per group, as follows: control group (C), diabetic control group (DC), diabetic group treated with 200 mg/kg of OLE (D+200), and diabetic group treated with 400 mg/kg of OLE (D+400). Except for the C group, the rats in the other groups were injected with an intraperitoneal single dose of 50 mg/kg of STZ after 18 hours of fasting. The C group was also injected with intraperitoneal citrate buffer solution. For the diabetes model groups, 5 % glucose solution was given orally to prevent severe hypoglycaemia after two hours of the STZ injection. After eight hours of the STZ injection, normal tap water was given instead of glucose solution. The levels of blood glucose were found to be 300 mg/dL or more in all STZ-induced rats at 3 days after the injection. The treatment groups D+200 and D+400 were then treated with single doses of 200 and 400 mg/kg/day of OLE using the gavage method for 21 days, respectively (Fig. 1). At the end of the study, all rats were sacrificed by the cervical dislocation method after intraperitoneal administration of 90: 10 mg/kg of ketamine/xylazine.
BIOCHEMICAL ASSAYS
After 21 days of treatment, eight-hour fasting blood samples were collected from the heart. Blood samples were centrifuged at 2500 rpm for 15 minutes, and blood serum samples were separated. Serum triglycerides, total cholesterol, urea, creatinine, uric acid, AST, and ALT were determined using an automated biochemistry analyzer, and HbA1c was determined by complete blood count analysis using an automated hematology analyzer available at the laboratory of Aydın Adnan Menderes University Research Hospital in Aydın, Turkey. The blood glucose level was determined using a glucometer on blood from a tail vein. In addition, lipid LOOH levels and dynamic thiol/disulfide homeostasis were measured using commercial kits (Triogen Biotech Inch, Istanbul, Turkey). The LOOH assay kit measures the hydroperoxides directly utilizing the redox reactions with ferrous ions. The resulting ferric ions are detected using thiocyanate ion as the chromogen. Dynamic thiol/disulfide homeostasis is a novel automatic and spectrophotometric method developed by Erel and Neşelioglu (17). Reducible disulfide bonds were reduced to form free thiol groups. After reacting with DTNB (5,5p-dithiobis- (2 nitrobenzoic acid), all thiol groups were measured. The disulfide level was calculated as half of the difference between total thiol and native thiol.
STATISTICAL ANALYSIS
Statistical analyses were performed using the Prism program (version 6.01). Statistical significance and significance levels were measured using ANOVA in variables with normal distribution. Tukey's test was used for homogeneous variables, and the Games-Howell test was used for non-homogeneous variables as multiple comparisons test. For non-normal distributions, the Kruskal-Wallis H-test was used (18). Results were expressed as mean ± SEM and median (Q1-Q3) value of the measurements. The criterion for statistical significance was p < 0.05.
RESULTS
EFFECT OF DM AND OLE ON BODY WEIGHT
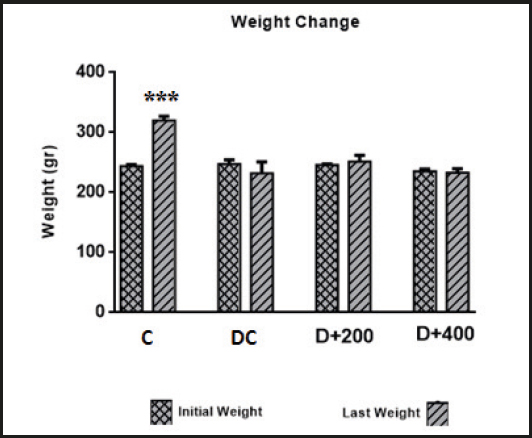
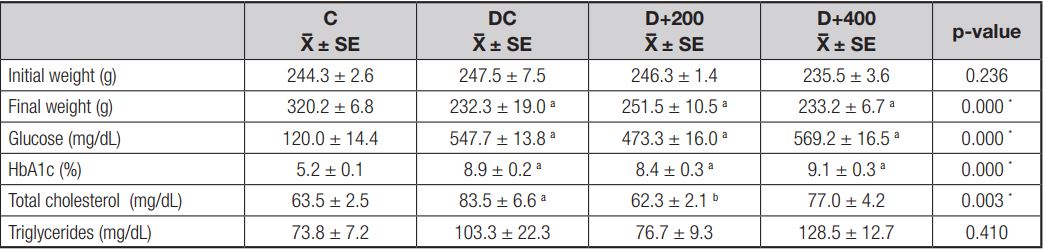
Body weight changes in each rat group are presented in figure 2. When the initial and final body weights of the rats in each group were compared at the end of 21 days, only the body weight changes in the rats in the C group were found to be significant (p < 0.001). The rats in the C group gained significant body weight as a requirement of growth. In contrast, there were no significant differences between the initial and final body weights in the rats included in the diabetic groups. The initial and final body weight values in all groups are shown in table II. At the beginning of the study, there were no significant differences in initial body weight between rat groups (p > 0.05). But there were significant differences in final body weight between each of the diabetic groups and C group at the end of the study (p < 0.001).
EFFECT OF OLE ON GLYCEMIC AND LIPID PROFILE
Glucose levels in the blood samples obtained from all diabetic groups were significantly higher than in the C group (p < 0.001). However, HbA1c levels were significantly higher in the diabetic groups (p < 0.001) compared to the C group. This indicates that OLE had no effect on the glycemic profile of treated diabetic rats. Also, no significant differences were found in glucose and HbA1c levels between diabetic groups (Table II).
A significant increase in serum total cholesterol level was observed in the DC group when compared with the C group. Serum total cholesterol levels were significantly decreased in the diabetic rats treated with 200 mg/kg of OLE when compared to diabetic control rats (p < 0.01). But this effect was not observed in the diabetic rats treated with 400 mg/kg of OLE. In addition, serum triglycerides levels were examined at the end of the study, and no significant differences were observed in serum triglycerides levels between groups (Table II).
EFFECT OF OLE ON HEPATIC AND RENAL FUNCTION
Serum ALT, urea, and creatinine levels were significantly higher in the rats included in the DC group when compared to the rats in the C group at the end of the study. Increased ALT and AST levels by diabetes induction were reduced by OLE treatment in a dose-dependent manner, but not significantly. However, serum urea levels significantly improved in both diabetic groups treated with OLE compared to the DC group (p < 0.001). Conversely, no significant effect of OLE treatment was observed on serum creatinine levels increased by diabetes induction. In addition, neither diabetes induction nor OLE treatment caused any significant differences in serum uric acid levels (Table III).
Table III. Mean values of liver and kidney function indicators
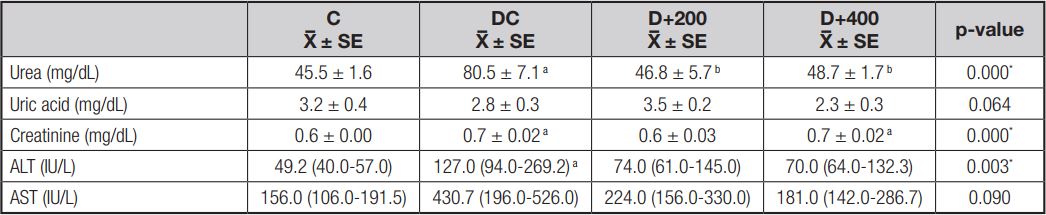
C: control; DC: diabetic control; D+200: diabetes + 200 mg/kg OLE; D+400: diabetes + 400 mg/kg OLE. Values are means ± SD or medians (Q1-Q3). ap < 0.01 (compared to C group); bp < 0.01 (compared to DC group); cp < 0.05 (compared to D+200 group).
EFFECT OF OLE ON ANTIOXIDANT CAPACITY
Dynamic thiol/disulfide homesostasis and serum LOOH levels were determined to observe the effect of OLE treatment on antioxidant capacity. The results showed that OLE increased the level of native and total thiol in a dose-dependent manner, although not significantly. However, the disulfide/thiol ratio tended to decrease in the diabetic rats treated with 200 mg/kg of OLE when compared to both the control and diabetic control rats, whereas the disulfide/thiol ratio increased significantly in the D+400 group as compared to the D+200 group (p < 0.05). In addition, we observed that lipid peroxidation tended to decrease in both groups treated with OLE, although not significantly (Table IV).
Table IV. Mean values of oxidant status and antioxidant capacity indicators
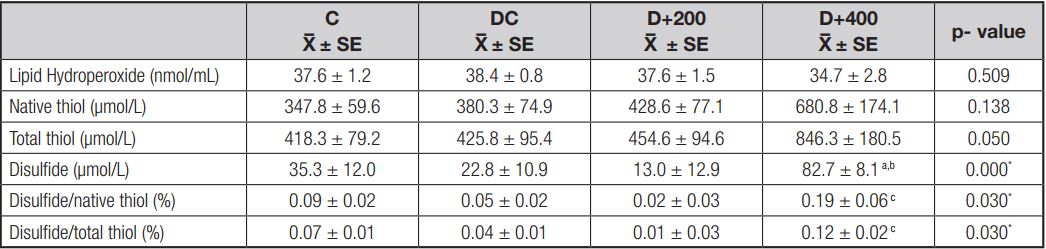
C: control; DC: diabetic control; D+200: diabetes + 200 mg/kg OLE; D+400: diabetes + 400 mg/kg OLE. Values are means ± SD. ap < 0.01 (compared to C group); bp < 0.01 (compared to DC group); cp < 0.05 (compared to D+200 group).
EFFECT OF OLE ON PAIN RESPONSE
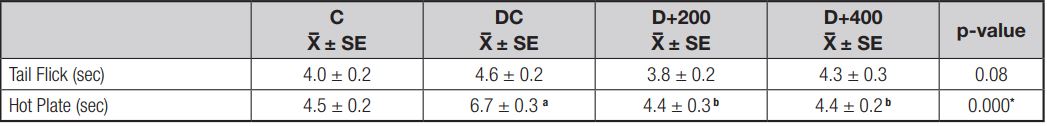
Loss of pain response and the effect of OLE treatment on pain response were determined using tail flick test and hot plate tests. The results indicated a loss of pain perception, determined by an increased latency time in the hot plate test, associated with neuropathy in the DC group. Treatment with OLE caused a significant decrease in latency times in the hot plate test (p < 0.001). The hot plate latency time value in group C rats was similar to that of rats in both treatment groups. However, STZ induction did not significantly increase tail flick latency time in the diabetic control rats, and OLE treatment did not significantly improve latency time in the tail flick test (Table V).
DISCUSSION
DM has gone beyond the point where it can only be seen as a medical problem, and shows multi-dimensional results with acute and chronic complications. It is well known that hyperglycemia causes oxidative stress through mitochondrial dysfunction and increased production of reactive oxygen species (ROS). As a result, oxidative stress and low-grade inflammation contribute significantly to the progression and complications of DM (19). Therefore, glycemic control is considered the primary therapeutic intervention in DM. Due to the side effects and costs of antidiabetic drugs, natural plants such as olive leaves have been reported to be promising in maintaining glycemic control in DM (10). There are two basic theories that explain how olive leaves and their bioactive compounds lower serum glucose levels. The first of these is the view that these bioactive compounds enhance glucosone-dependent insulin secretion (3). The second is that they increase peripheral glucose uptake by AMP-activated protein kinases (AMPK) phosphorilation and glucose transporter type 4 (GLUT4) translocation (20).
Guex et al. (2019) compared the influence of metformin and OLE on blood glucose. They reported that 200 and 400 mg/kg of OLE were efficacious on glycemic control in a similar way to metformin. However, only metformin was reported to be effective on HbA1c (4). Nekooeian et al. (2014) reported that treatment with 20 mg/kg, 40 mg/kg, and 60 mg/kg of oleuropein significantly reduced fasting blood glucose in a type-2 diabetic rat model (21). Moreover, a systematic review and meta-analysis including 8 trials and a total of 162 rats has found that OLE increased insulin levels and decreased blood glucose levels (22). On the contrary, we found that supplementation for 21 days with OLE had no effect on serum glucose or HbA1c in treated diabetic rats (Fig. 3). This difference may be due to a difference in diabetic admission threshold values and in duration of treatment for both sets of rats. In addition, we found that the healthy rats significantly gained body weight as a requirement of growth, while the diabetic rats maintained their initial body weight (Fig. 2). The reason is an insufficient anabolic effect exerted by insulin in diabetic rats.
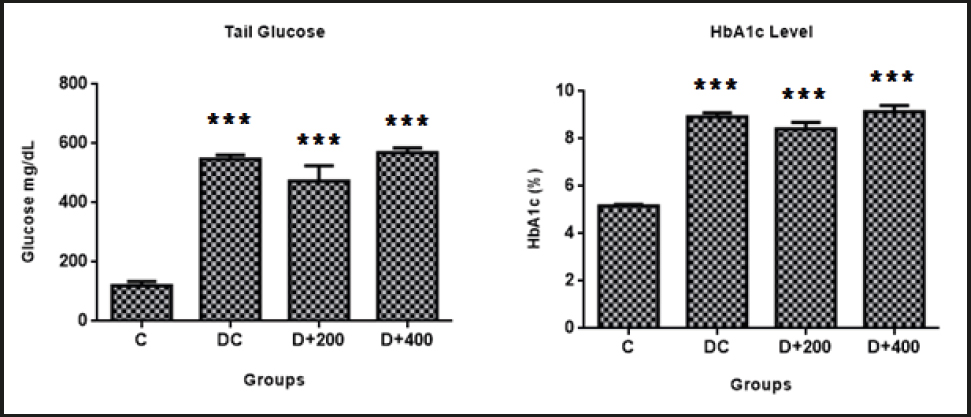
Figure 3. Evaluation of glycemia control parameters C: control; DC: diabetic control; D+200: diabetes + 200 mg/kg OLE; D+400: diabetes + 400 mg/kg OLE. *Compared to C group (*p < 0.05, **p < 0.01, ***p < 0.001). #Compared to DC group (#p < 0.05, ##p < 0.01, ###p < 0.001).
The long-term presence of hyperglycemia causes excessive neuronal glucose uptake, and then increased intracellular glucose drives the alternative polyol pathway. This pathway contributes to increased oxidative stress in peripheral nervous tissues. Thus, neuronal and microvascular endothelial cell damage as induced by hyperglycemia-mediated oxidative stress contributes to the pathogenesis of neuropathy with loss of protective sensation (23). It has been reported that the antioxidants that directly remove free radicals can reduce the formation or progression of ROS reactions, and thus may improve diabetic neuropathy status by reducing oxidative stress (16). However, the antioxidant effect of olive leaves in the literature is remarkable [3,8]. In our model, antioxidant status was indicated by serum LOOH and thiol levels. Thiols (RSH) are a class of organic compounds containing a sulfhydryl group, and may undergo an oxidation reaction to form disulfide (RSSR) bonds under oxidative conditions (17). We found that treatment with olive leaves increased thiol levels and decreased LOOH levels. Also, disulfide and disulfide/thiol levels decreased only with low-dose OLE treatment. Although the improvement seen in the antioxidant indicator is not significant, the loss of pain perception caused by hyperglycemia-induced oxidative stress was significantly prevented in treated diabetic rats (Fig. 6). Similarly, Ristagno et al. (2012) reported that thermal response latency and mechanical withdrawal thresholds changed significantly in parallel with our results (24). Olive leaf may have hyperalgesic effects by preventing neuronal oxidation and inflammation. Regarding this point of view, well-documented studies are needed to explain the accurate mechanism of this effect of treatment with olive leaves.
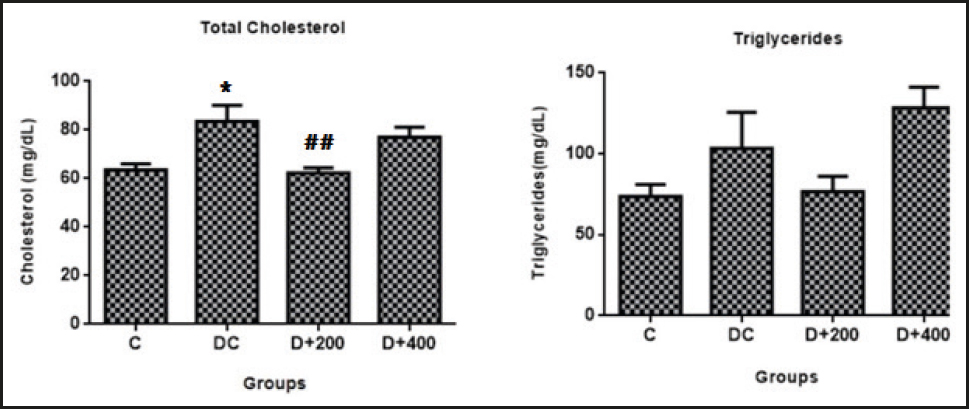
Figure 4. Evaluation of lipid profile parameters. C: control; DC: diabetic control; D+200: diabetes + 200 mg/kg OLE; D+400: diabetes + 400 mg/kg OLE. *Compared to C group (*p < 0.05, **p < 0.01, ***p < 0.001). #Compared to DC group (#p < 0.05, ##p < 0.01, ###p < 0.001).
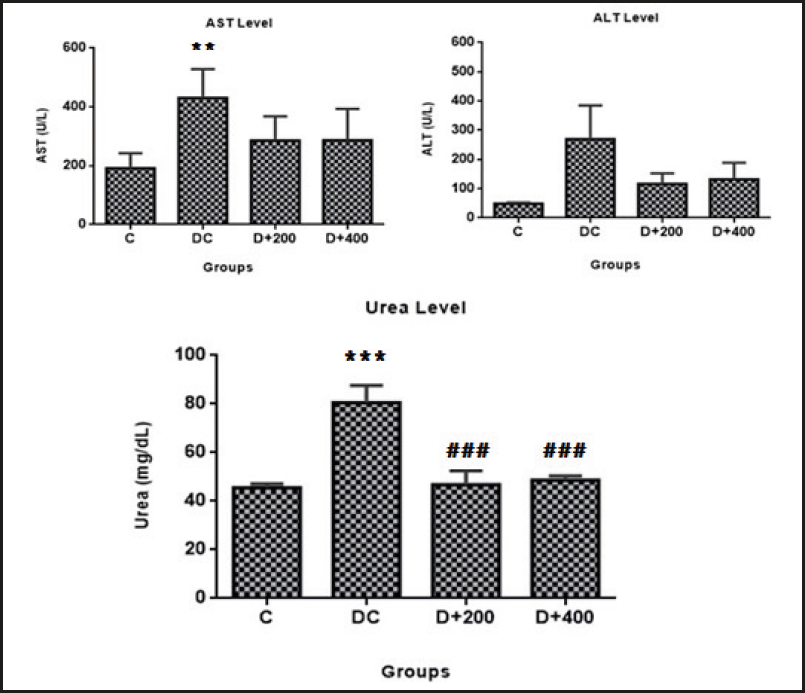
Figure 5. Mean values of liver damage indicator. C: control; DC: diabetic control; D+200: diabetes + 200 mg/kg OLE; D+400: diabetes + 400 mg/kg OLE. *Compared to C group (*p < 0.05, **p < 0.01, ***p < 0.001). #Compared to DC group (#p < 0.05, ##p < 0.01, ###p < 0.001).
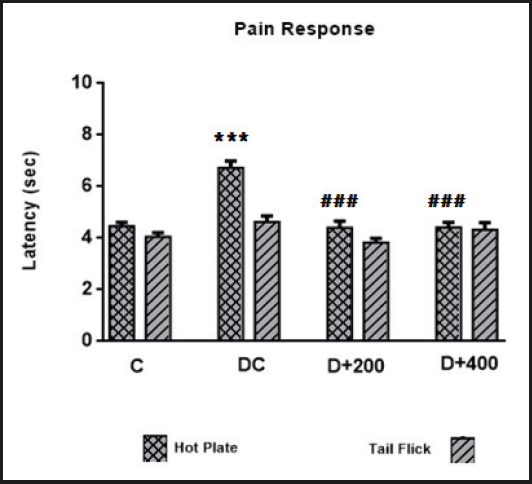
Figure 6. Mean values of latency indicators. C: control; DC: diabetic control; D+200: diabetes + 200 mg/kg OLE; D+400: diabetes + 400 mg/kg OLE. *Compared to C group (*p < 0.05, **p < 0.01, ***p < 0.001). #Compared to DC group (#p < 0.05, ##p < 0.01, ###p < 0.001).
Lipid profile imbalance is an expected condition in DM. Because insulin has an antilipolytic effect that inhibits the hormone-sensitive lipase in the adipose tissue, as a result, insulin reduces the secretion of free fatty acids from adipose tissue. It also significantly influences lipid metabolism by suppressing intestinal chylomicron and hepatic lipoprotein synthesis, increasing lipoprotein lipase activity and LDL receptor expression in peripheral tissues. Therefore, lipid disorders such as hypertriglyceridemia and hypercholesterolemia occur secondary to effective insulin deficiency (25). However, lipid disorders can cause vascular damage by increasing the formation of ROS, and it is well known that premature cardiovascular disease is one of the most common causes of death in diabetic patients (26,27). Similar to all these data, elevated cholesterol levels (p < 0.01) and a slightly increased lipid peroxidation (p > 0.05) were observed in our diabetic control rats. In the previous studies, oleuropein has been reported to be a peroxisome proliferator-activated receptor α (PPARα) ligand, and oleuropein treatment reduces in rat hepatocytes the activity of the rate-limiting enzyme of cholesterol synthesis, namely, hydroxymethylglutaryyl-CoA (HMG-CoA) reductase (28,29). Moreover, it was reported that treatment with olive leaves significantly decreased serum cholesterol and triglyceride levels in rats fed a high fat diet (11). Similarly, we found that treatment with low-dose olive leaf extract significantly reduced serum total cholesterol (p < 0.01), but resulted in no significant improvement in triglyceride levels (Fig. 4).
Diabetic kidney disease is an important cause of chronic kidney disease and end-stage renal failure worldwide (14). Controling plasma glucose and lipid concentrations in diabetic patients prevents microvascular complications, and therefore the main goal of medical treatment is metabolic control. Hyperlipidemia and increased lipid peroxidation in experimental diabetes models is a well-known and expected condition. Lipid peroxidation products such as malondialdehyde quickly react with biomolecules such as proteins, lipids, and nucleic acids, and may subsequently cause tissue damage (26). However, the synergistic effect of hypertriglyceridemia and hypercholesterolemia is reported to cause kidney damage in a short time in experimental diabetes models. A possible mechanism is that lipid molecules can induce mesangial cell proliferation and excess basement membrane material production, and thus trigger the development of glomerulosclerosis with a reduction in filtration rate (30). Increased serum creatinine levels are a significant marker of renal dysfunction, together with the less specific urea levels, and hypolipidemic agents (statins) are known to reduce urea and creatinine levels by reducing glomerular damage (31). Our findings showed that serum urea and creatinine levels increased in parallel with hyperlipidemia in diabetic control rats. Similar to the findings of Mohammed et al., we found that olive leaf therapy significantly reduced serum urea levels, although it did not reduce serum creatinine levels (Fig. 5) (32). Increased urea levels increase the risk of mortality in cardiovascu lar diseases, and OLE may possibly reduce urea reabsorption by suppressing urea transporters in collecting ducts.
It has been demonstrated that diabetes induction with STZ causes hepatic tissue damage (10,33). This situation is related to an inability to suppress lipolysis in adipose tissue, and the ectopic accumulation of fatty acids released from adipose tissue in the liver. However, increased lipid peroxides accumulate in the liver and increase oxidative stress and liver damage (26). Increased ALT and AST levels are documented as determinants of liver dysfunction, and as indicators of cell leakage, cellular damage, and ruptured cell membrane integrity in the liver (10). Also, it has been reported that triglycerides, uric acid, and HbA1c show a positive correlation with increased ALT (34). In our model, we found that ALT (p < 0.01) and AST (p > 0.05) levels were increased by diabetes induction. Fki et al. (2020) reported that olive leaf therapy exhibited hepatoprotective effects by decreasing ALT and AST levels due to its antioxidant properties (11). Although our findings are in agreement with the study by Fki et al., the decrease in ALT and AST levels was not significant in our treated diabetic rats (Fig. 5).
Recent studies on the relationship between serum uric acid levels and diabetes/diabetic complications are remarkable. Uric acid is the final product of purine metabolism, and is produced in the liver. However, the regulation of blood uric acid levels is largely carried out by the kidney (35). Many studies report that hyperuricemia causes diabetes development or a progression of diabetic complications by increasing oxidative stress (35,36). But, on the contrary, there are other studies that find that uric acid acts as an antioxidant in the early stage of the atherosclerotic process, and is the strongest determinant of plasma antioxidant capacity (37,38). Recently, pre-treatment with oleuropein has been reported to reduce uric acid levels by improving kidney function (39). In the present study, we found that serum uric acid levels were not significantly different between groups. Although there are some studies reporting that olive leaf treatment affects uric acid levels due to its effect on kidney function, further studies are needed to assess the effects on xanthine oxidase enzyme activity.
CONCLUSION
In conclusion, it may be said that OLE supplementation for 21 days does not prevent hyperglycemia in diabetic rats. However, OLE supplementation during 21 days may protect against diabetic complications by reducing the oxidative damage caused by hyperglycemia and hyperlipidemia, due to its antioxidant effect. It is, therefore, necessary to consider the “strong antioxidant” feature of olive leaf mentioned in the literature. Additional experiments are needed to explain the health effects of various treatment dosages of OLE and its bioactive compounds, one of the promising therapeutic agents for diabetic complications.

