


 Servicios personalizados
 Inglés (pdf)
 Articulo en XML
 Referencias del artículo
 Enviar articulo por email
 Citado por SciELO
  Citado por Google
  Similares en
SciELO
Similares en
SciELO  Similares en Google
 Permalink
INTRODUCTION
The wide transition in nutrition from traditional, healthy, natural food to foods high in fat, sugar and salt throughout the developed and developing countries has been studied globally (1). This transition affects all age groups and communities, in which the risk of obesity has increased dramatically, hence also the risk of chronic diseases including diabetes, hypertension, and stroke (1). Jordan, as a developing country in the Middle East and North Africa region (1), has been hit by this transition, which increases the level of obesity and undernutrition (2,3). Children are known to be cognitively incapable to meet their overall requirements by themselves, those that are required for normal growth and development (4). They need increasingly more care in their schools and homes because unhealthy eating patterns may result in impaired motor and cognitive development (5).
Dietary assessments, as well as collecting accurate dietary information about dietary habits and nutrient intake, are a big challenge in children. It is essential to identify predictors and outcomes of children’s diets to determine the targets for developing and evaluating interventions, and understanding the processes of behavioral change (6). Researchers have revealed that a number of issues should be addressed when assessing the diet of children (6). For example, the accuracy of children self-reports may be unsatisfactory to obtain valid data due to cognitive factors, as some children have difficulties with their memory or recall of food intake, and in their ability to estimate the size of the portions consumed (6). Therefore, surrogate reporting by parents, caregivers, or a combination is necessary. For school-age children there is no definite accurate method of dietary assessment. Thompson and Subar (2012) reported that the objectives and design of a study will determine which dietary method is the most appropriate to assess nutrient intakes (7). However, many different methods have been developed for dietary assessment, such as the 24-hour recall, food records, and the food frequency questionnaire (FFQ), etc. (8). Among these methods, FFQs are known as one of the most appropriate methods to conduct large-scale epidemiological studies, as they are simple and easy to administer, as well as less intrusive, which results in less respondent burden when compared to other methods. Also, it is relatively inexpensive and does not need a highly trained interviewer (8). However, to insure the accuracy of the data obtained by a FFQ, validity is a prerequisite (9). However, intake estimates derived from a FFQ sometimes differ from actual intakes because of many reasons (10). One of these reasons is the difficulty some persons experience when recalling and averaging their intakes over the long term. Another reason is that consumption frequencies and average portion sizes of food groups may be incorrectly translated to specific nutrient amounts, particularly if the FFQ was self-reported (10).
In Middle East countries only a few FFQs for children have been developed. Moghames et al. (2016) conducted the first study that validated a FFQ among children in the Arabic world; however, the validation of a FFQ among adolescents has not been done yet in the Arab region (11). The study by Moghames et al. (2016) was conducted in school-aged children in Lebanon, where a semi-quantitative FFQ was validated against 24-hour recalls conducted among Lebanese children (11).
In Jordan, FFQs only have been validated among adults (12), but not for children. Therefore, the present study aimed to modify the validated FFQ for adults, to develop a culturally-sensitive FFQ for children and adolescents of 6-18 years of age, and to test its relative validity and reliability for assessing energy and nutrient intake against mean values derived from repeated 24-HRs. We hypothesized that the established FFQ would be valid and reliable in assessing nutrient intake in this age group.
MATERIALS AND METHODS
STUDY DESIGN AND PARTICIPANTS
This was a validation study conducted as part of a cross-sectional observational study aiming to assess the nutritional status of children. The data collection was conducted between September 2017 and May 2018. One hundred and thirty six children aged between 6 and 18 years were conveniently enrolled from public and private schools in the Greater Amman area, Jordan. The obtained sample size was in accordance with sample size recommendations for validation studies of FFQs. Guidelines recommended 50 to 100 individuals in each demographic group (13). Sample size was estimated to be about 120 participants, and an additional 35 % was considered to account for drop outs, so the total number of subjects was 162 (81 boys and 81 girls). Twelve schools were randomly selected from the Ministry of Education list of schools in the Greater Amman area; 7 public schools (3 schools from east of Amman and 4 schools from west of Amman) and 5 private schools (3 schools from east of Amman and 2 schools from west of Amman). In the selected schools all eligible students received an invitation letter to participate in the study, addressed to their parents. In this letter the purpose of the study, eligibility criteria (inclusion/exclusion) to participate, and the risks and benefits of participating were outlined. Inclusion criteria included Jordanian nationality; aged between 6 to 18 years at enrollment; and healthy and normal body weight (with no medical conditions that require specific dietary restrictions affecting food intake). All participating parents/caregivers were asked to sign a written informed consent form, and children above the age of seven also signed an informed assent to indicate their approval to participate in the study. One hundred and thirty six children aged between 6 and 18 years (50 boys and 86 girls) were enrolled and completed a socio-demographic questionnaire, the FFQ-1, and first 24-HR during the initial face-to-face interview.
Of 136 children, 50 were enrolled to take part in the reproducibility part. This sample size was estimated using the methodology proposed by Walter et al. (1998) for approaching the number of participants required for test-retest reliability (14). Assuming 0.40 to be the minimally acceptable level of reliability, but hypothesizing a reliability of 0.70 with the administration of the questionnaire on two different incidents, a sample size of at least 33 participants was required (p < 0.05; 80 % power) to conduct the reliability test (14). To account for attrition between the first and second administration, the sample size target was increased to 50 participants. The FFQ was administered by a trained nutritionist at the time of enrollment and 1 month later to evaluate FFQ reproducibility. The FFQ took 35 to 45 minutes to complete. Four nonconsecutive 24-HRs (three working days and one weekend day) were collected from participants during the duration of the study (Fig. 1). The first 24-HR was collected in the first face-to-face interview. The remaining 2 working days and weekend day were conducted at three different occasions over 1 month. The same trained dietitian carried all the interviews.

Figure 1. Schematic showing the design of the validation and reliability assessment of the developed FFQ.
The study protocol was approved by the Institutional Review Board of the Ministry of Education in Jordan (3/10/26579), and the research conducted in accordance with the ethical standards of the responsible committee on human experimentation, as well as with the Helsinki declaration of 1975.
DATA COLLECTION
Socio-demographic questionnaire
Information about parental age, education level, marital status, occupation, child’s age, gender, and school class level was collected by an interviewer-administered, structured socio-demographic questionnaire.
Anthropometric assessment
Weight and height of the children were measured by a trained dietitian according to standardized procedures and using calibrated equipment. The participants were weighed without shoes using a simple balance (BC-730F, Fitscan Body Composition Monitor, Japan) to the nearest 0.1 kg, and height was measured without shoes to the nearest 0.1 cm using a wall-mounted stadiometer (Tanita Leicester Portable Height Measure, Japan).
The Food frequency questionnaire (FFQ)
A 120- food item, quantitative, paper-and-pencil form FFQ was used to assess the usual intake of energy as well as macro- and micronutrient intakes over a period of 1 year. The food list in the FFQ was developed based on the results of a pilot study. The pilot study was conducted among 50 children aged between 6 and 18 years, who were asked to recall their dietary intake during the past 24 hours, and to identify their commonly consumed foods and their serving sizes. Based on these data a FFQ was developed to suit the children’s assessment of the types of foods consumed (such as candies, jelly gums, happy meals, etc.) and their portion size. Portion sizes were estimated for children from 6 years to those who are in their teens. The children who participated in the pilot study were not included in the validation and reliability study.
The participants in the current study were asked how often, on average, they had consumed each food item over the past year. Each food item in the FFQ had either 10 frequency choices that ranged from “never” during the past year to “≥ 6/day” for beverages, or nine frequency choices that ranged from “never” during the past year to “≥ 2/day” for food (12). The participants were also asked to indicate the portion size in three categories: small, medium, and large. The portion sizes of each food item were defined according to commonly used portions as identified by an earlier Jordanian FFQ (12), including household measures (e.g., cups, tablespoons, and teaspoons). For some foods (e.g., fruits, eggs, crackers, pastries, and soft drinks) natural units or typical units (e.g., an apple, an egg, one cracker and a can of soft drink) were used. Food models were used to help participants estimate the consumed portion size for foods that cannot be measured using standard measuring units. The participants were asked to indicate the portion size according to three categories: small, medium, and large. For each classification, a metric amount in grams or milliliters was assigned. The participants’ responses were converted into average daily intake (in grams for foods or milliliters for beverages) according to the frequency and portion size of each specific food item. In addition, the FFQ collected data on food preparation and cooking methods—use of specific types of oil, butter, and margarine. For seasonal variations, foods that are usually eaten at specific times of the year were considered.
24-hour dietary recall (24-HR)
In Jordan, the formal weekend days are Friday and Saturday, whereas working days are from Sunday to Thursday. In the first face-to-face interview, the first 24-HR was collected, then the second and third 24-HRs were conducted by phone at a weekday and a weekend day; after one month, in a second face-to-face interview the fourth 24-HR was collected. Paper-based forms that matched the five-stage, multiple-pass interviewing technique were used to collect the 24-HRs (15). In the first pass, the participant was asked to give a complete overview of all foods and beverages consumed during the previous day from midnight to midnight. In the second pass, the participant was asked about any forgotten food, included in a checklist of foods and beverages that are often forgotten such as snacks, candies, and added milk and sugar. Then a detailed timing and occasion for each food and beverage consumed was obtained. The amount and the description of the foods consumed was recorded. This included type of product, brand names, cooking techniques, amounts, and food leftovers. In this pass, standard measuring tools and food models were used to facilitate the estimation of portion size. In the last pass, the information was summarized and reviewed to ensure that all food items were recorded correctly (15).
ANALYSIS OF DIETARY DATA
The Food Processor Nutrition Analysis software (ESHA’s Food Processor SQL, version 10.1.1, Salem, Oregon, USA) was used for the analysis of dietary data derived from the FFQs and the four 24-HRs to estimate daily energy, macronutrient, and micronutrient intakes. The composition of specific Jordanian foods was obtained from food composition tables and added to the ESHA Food Processor (16). The data on energy, macronutrient, and micronutrient intakes were exported from the Food Processor Nutrition software and imported into the Statistical Package SPSS to assess the relative validity and reproducibility of the FFQ.
STATISTICAL ANALYSIS
Statistical analyses were performed using the Statistical Package for Social Science version 22,0 (SPSS for Windows, 2013, Chicago: SPSS Inc.). The significance level was set at a p-value < 0.05 for all data. Means ± SDs were calculated for continuous variables. Frequencies and percentages were used to describe categorical variables.
The mean ± SD was calculated for the energy and nutrient intakes collected with the FFQ-1 and 24-HRs in the validation part. The normality of the distribution of energy and nutrient variables was evaluated by the Shapiro-Wilk test. When the variables were not normally distributed, they were log-transformed before the analysis. Pearson’s correlations were estimated to measure the strength of the linear association between intakes as estimated by the FFQ-1 and 24-HRs. As most of the nutrients correlated with total energy intake, an energy adjustment method was applied using the residual method of Willett (2012), in which residuals were calculated from a regression model (9). De-attenuated Pearson’s correlation coefficients were computed to account for the effect of random within-person variations in the 24-HRs, as mentioned previously by Willett (2012) and using the following formula (9):
rde = robs √1 + (Varw / Varb) / n
where “rde” is the de-attenuated correlation coefficient, “robs” is the observed correlation coefficient for adjusted nutrient intake, Varw is the within-person variance in the 24-HRs, Varb is the between-person variance in the 24-HRs, and n is the number of 24-HRs per participant. Varw and Varb were estimated from a simple variance components analysis of the within-person and between-person variability of the 24-HRs. The validation of the FFQ was also assessed in terms of its ability to accurately rank the participants according to their energy and macronutrient-micronutrient intakes. Thus, the mean daily intake obtained from the 24-HRs was divided into quartiles and compared with those calculated by the FFQ-1. Quartile agreement between the two dietary methods was assessed by calculating the percentage of participants categorized into the same, adjacent (same ± 1 quartiles), and opposite quartiles (misclassification by same ± 2 quartiles). Furthermore, the analysis proposed by Bland and Altman (1986) was used to graphically examine the agreement between FFQ and mean 24-HR values; the difference in intake between the two methods (FFQ-1 - mean 24-HRs) was plotted against the mean intake of the two methods ((FFQ-1 + mean 24-HRs) / 2) (17). The plots include lines for the mean difference and the limits of agreement, defined as: mean difference ± 1.96 x SD.
For the reproducibility of the FFQ, the mean ± SD values for energy and macro-micronutrient intakes were calculated for the two FFQs. Intraclass correlation coefficients and their 95 % CIs based on absolute agreement and a 2-way mixed effects model were calculated to test the reproducibility between the two administrations of the FFQ. The degree of agreement between FFQ-1 and FFQ-2 was evaluated using a weighted kappa (κw). In the κw test values lower than 0.21 were taken to indicate weak agreement; those of 0.21 to 0.40, fair agreement; of 0.41 to 0.60, moderate agreement; of 0.61 to 0.80, substantial agreement; and greater than 0.80, almost perfect agreement (18).
RESULTS
SOCIO-DEMOGRAPHIC CHARACTERISTICS
Table I shows the socio-demographic characteristics and anthropometric measurements of study participants —parents and children. Among the 136 students, 50 (36.7 %) were boys and 86 (63.3 %) were girls, with an average age of 11.9 years (SD = 3.2). Their mean height was 148.1 cm (SD = 17.3) and mean weight was 41.2 kg (SD = 13.9). Over half of participants came from public schools (65.4 %). A majority of the mothers were married (96.4 %), with only 10.3 % having an education level lower than high school, while 44.9 % had a high school degree. Likewise, 15.4 % of fathers had an education level lower than high school, and 44.9 % had a high school degree. Only 25.4 % of mothers were employed, whereas 91.2 % of fathers had an employment.

RELATIVE VALIDITY OF THE FFQ
Table II shows the mean ± SD values for intakes of energy and macronutrients as derived from the FFQ-1 and the four 24-HRs. The mean daily intake of energy and macronutrients estimated by the FFQ-1 tended to be higher than that obtained by the 24h-HRs, with the exception of proteins, trans-fats, and omega-3 fatty acids. Crude and energy-adjusted correlation coefficients between the FFQ-1 and the 24h-HRs of all 136 children are listed in table II. Crude Pearson’s correlation coefficients ranged from 0.04 for trans-fats to 0.79 for energy. Pearson’s correlations between the FFQ-1 and 24-HRs were statistically significant (p < 0.05) except for trans-fats, which were not significantly different. Adjustment for total energy intake resulted in a decrease in correlation coefficients for most macronutrients. The most noticeable change after energy adjustment occurred in fat. The adjusted Pearson’s correlation coefficients ranged from 0.04 for trans-fats to 0.5 for proteins. The energy-adjusted coefficients were statistically significant with the exception of polyunsaturated fat and trans-fats. After correction for random within-person variation, the de-attenuated energy-adjusted correlations were higher than the adjusted correlations and ranged from 0.04 for trans-fats to 0.5 for proteins. After energy adjustment and correction for random within-person variation, the average value of correlation coefficients was 0.3 for all estimated macronutrients.
Table II. Average daily intakes of energy and macronutrients, Pearson`s correlation coefficients, and agreement between mean of four 24-HRs and the FFQ administered to 136 children and adolescents participating in a validation study: September 2017 to May 2018

aMacronutrients adjusted for total energy intake. bAdjusted correlation coefficients corrected for random within-person variation. cMacronutrients log-transformed to improve normality.
The percentage of participants who were classified into the same quartile or adjacent quartile or the opposite quartile by the FFQ-1 and the four 24-HRs is presented in table II. On average, 74 % and 66 % of participants were classified by the FFQ-1 and the 24-HRs into the same or adjacent quartiles according to their energy and crude macronutrient intake, and energy-adjusted macronutrient intake, respectively. Approximately 26 % and 34 % of participants were misclassified for crude and energy-adjusted macronutrient intake, respectively. The percentage of agreement for energy-adjusted macronutrient intake ranged from 23.5 % for polyunsaturated fat to 35.7 % for carbohydrates. On the other hand, the percentage of disagreement for energy-adjusted macronutrient intake ranged from 25 % for trans-fats to 44.9 % for polyunsaturated fat.
The mean ± SD values of micronutrient intake derived from the FFQ-1 and the four 24-HRs, and the crude and energy-adjusted Pearson’s correlation coefficients for micronutrients are reported in table III. Some micronutrients derived from the FFQ-1 showed higher as values compared to the four 24-HRs (vitamin A, vitamin B3, vitamin B6, vitamin C, folate, calcium, copper, iron, magnesium, and potassium). The reported intakes of vitamin B1, vitamin B2, vitamin D, vitamin E, iodine, phosphorus, selenium, sodium, and zinc were lower when estimated by the FFQ-1 than by the four 24-HRs. Crude Pearson’s correlation coefficients varied from 0.1 for vitamin D to 0.5 for vitamin A. Pearson’s correlation coefficients decreased after energy adjustment for all micronutrients. The energy-adjusted correlations for micronutrients were statistically significant with the exception of vitamin D and vitamin E. After de-attenuation, correlations increased for most micronutrients and ranged from 0.1 for vitamin D to 0.9 for selenium. The correlations obtained for most micronutrients were greater than 0.3 after energy adjustment and de-attenuation, except for vitamin D, vitamin E, copper, iodine, magnesium, potassium, and zinc. The average value of de-attenuated and energy-adjusted correlation coefficients was 0.4 for all assessed micronutrients.
Table III. Average daily intake of micronutrients, Pearson’s correlation coefficients, and agreement between mean of four 24-h and the FFQ administered to 136 children and adolescents participating in a validation study: September 2017 to May 2018

aMicronutrients adjusted for total energy intake. bAdjusted correlation coefficients corrected for random within-person variation. cMicronutrients log-transformed to improve normality.
For most micronutrients, approximately 70 % or less of participants were classified into the same or adjacent quartile of crude and adjusted intakes (Table III). The percentage of participants who were classified into the same quartile for energy-adjusted nutrient intake ranged between 14.7 % for copper and 34.6 % for sodium. The greatest misclassification was observed for copper intake. Around 28.3 % and 34.3 % of participants were grossly misclassified into the opposite quartile of crude and adjusted micronutrient intake, respectively (Table III).
BLAND-ALTMAN ANALYSIS
The Bland-Altman plots for energy and proteins are shown in figures 2 and 3. The mean intake estimated by the FFQ-1 and the four 24h-HRs was plotted on the x-axis, and the difference in intake between the two methods was plotted on the y-axis. The mean difference between the FFQ-1 and the four 24-HRs for absolute intake was 231.6 kcal for energy and -10.2 g for proteins. After adding ± 1.96 SD for the limit of agreement, an interval from -529.7 to -51.0 (lower agreement limit), and from 992.9 to 30.6 (upper agreement limit) was obtained for energy and proteins, respectively. According to figure 2 and figure 3, the number of participants observed to be within the 95 % limit of agreement value was 132 out of 136 for energy, and 130 out 136 for proteins.

Figure 2. Bland-Altman plot of energy intake. Differences in daily intake of energy estimated with the mean of four 24-HRs and the FFQ, plotted against the mean daily intake estimated by the two methods. The middle line represents the mean difference between the two dietary methods, and the upper and lower lines represent the limits of agreement corresponding to a standard deviation (SD) of ± 1.96 (participants = 136 children and adolescents): September 2017 to May 2018.

Figure 3. Bland-Altman plot of protein intake. Differences in daily intake of protein estimated with the mean of four 24-HRs and the FFQ, plotted against the mean daily intake estimated by the two methods. The middle line represents the mean difference between the two dietary methods, and the upper and lower lines represent the limits of agreement corresponding to a standard deviation (SD) of ± 1.96 (participants = 136 children and adolescents): September 2017 to May 2018.
REPRODUCIBILITY OF THE FFQ
Table IV displays the mean ± SD values of energy and macronutrient intakes as obtained by two administrations of the newly developed FFQ to 50 children. Mean intake of energy and macronutrients, except for proteins, soluble fiber, insoluble fiber, trans-fats, and omega-3 fatty acids, was higher when estimated by the FFQ-1 versus the FFQ-2. Intraclass correlation coefficients between FFQ-1 and FFQ-2 were statistically significant at p < 0.0001 for energy and all macronutrients, with the highest correlation being shown for fiber (0.93) and the lowest correlation for trans-fats (0.5). The average value of all correlation coefficients was 0.8. The κw statistic ranged from 0.5 for trans-fats to 0.9 for insoluble fiber, indicating a moderate to perfect level of agreement. Energy and most macronutrients presented a perfect agreement (κw > 0.8) except for carbohydrates, polyunsaturated fat, cholesterol, and omega-6, which exhibited good agreements (κw = 0.6 to 0.8).
Table IV. Average daily intakes of energy and macronutrients, intraclass correlation coefficients, and weighted kappa between the two food frequency questionnaires (FFQ1 and FFQ2) administered to 50 children and adolescents participating in the reproducibility part of a FFQ validation study: September 2017 to May 2018
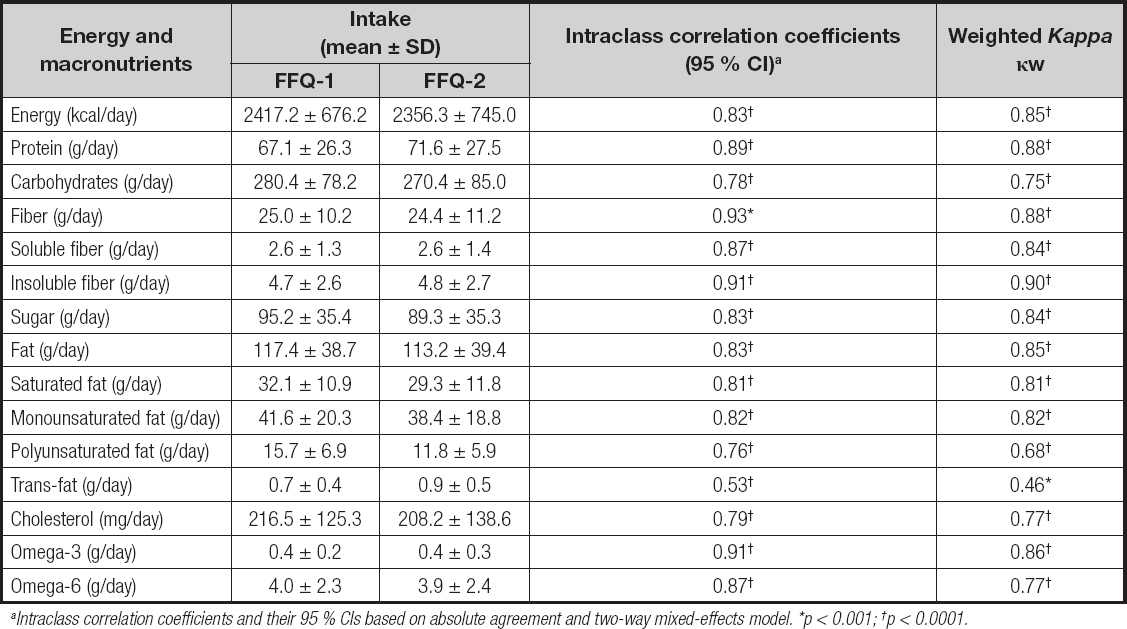
aIntraclass correlation coefficients and their 95 % CIs based on absolute agreement and two-way mixed-effects model. *p < 0.001; †p < 0.0001.
The mean ± SD values of micronutrient intake estimated by two FFQs in 50 children is presented in Table V. The mean daily intake of micronutrients was higher in the first FFQ than in the second FFQ, except for vitamin B1, vitamin B2, vitamin B6, vitamin D, folate, and copper. Intraclass correlation coefficients between FFQ-1 and FFQ-2 were statistically significant at p < 0.0001 for all micronutrients, ranging from 0.8 for vitamin B1 to 0.9 for vitamin A. The average value for all correlation coefficients was 0.9. The κw was statistically significant at p < 0.0001 for all micronutrients, with the highest agreement being observed for iron (0.9) and the lowest for vitamin B (0.7), indicating a substantial to perfect level of agreement.
Table V. Average daily intake of micronutrients, intraclass correlation coefficients, and weighted kappa between the two food frequency questionnaires (FFQ1 and FFQ2) administered to 50 children and adolescents participating in the reproducibility part of an FFQ validation study: September 2017 to May 2018

aIntraclass correlation coefficients and their 95 % CIs based on absolute ageement and a two-way mixed-effects model. *p < 0.0001.
DISCUSSION
FFQs are known to be one of the most appropriate methods to conduct large-scale epidemiological studies as it is simple and easy to administer, as well as less intrusive, so it is associated with lower respondent burden when compared to other methods. Also, they are relatively inexpensive and do not need a highly trained interviewer (9). However, due to differences in food types, accessibility, and preferences between populations, developing and validating a FFQ specific for a population is prerequisite to using said FFQ to assess such population’s diet (19). In this study, a 120-food item, quantitative FFQ was developed to evaluate intakes of macronutrients and micronutrients among Jordanian children and adolescents. The developed FFQ revealed a good reproducibility and an acceptable relative validity with respect to ranking participants according to their nutrient intake as compared with four 24-HRs. The 24-HR is the most accurate dietary assessment method for children (20). To validate a FFQ, 24-HRs and dietary records are commonly used as the reference dietary assessment method (11,21-24).
The unadjusted Pearson’s correlation coefficients ranged from 0.04 for trans-fats to 0.8 for energy. The adjustment for total energy intake decreased correlation coefficients for all nutrients, whereas the adjustment for within-person variation in the 24h-HRs improved correlation coefficients for some nutrients. Energy adjustment improves correlations for the majority of nutrients and foods, according to Willett (2012) (9). Energy adjustment increases correlation coefficients when the variability of nutrient intake is associated with energy intake; however, it decreases correlation coefficients when such variability depends on systemic errors of overestimation or underestimation. Similarly, Matos and colleagues (22) and Xia and colleagues (25) revealed that energy adjustment did not improve the crude correlations obtained for nutrients in their studies.
In general, the present correlations appear to be consistent with the results of other validation studies in children, which found acceptable correlations for energy-adjusted nutrients (11,25-27). Although Willet in 2012 recommended that acceptable correlations for FFQ validations be between 0.5 and 0.7, Hankin et al. in 1991 suggested that a coefficient < 0.3 would indicate a poor correlation, between 0.3 and 0.49 a fair correlation, and ≥ 0.5 a good level of correlation (28). Pearson’s correlation coefficients after de-attenuation for within-person variation ranged from 0.04 to 0.9. In another validation study (25) conducted in children, correlation coefficients generally ranged from 0.04 to 0.6, and from 0.5 to 0.7 for de-attenuated and energy-adjusted nutrients, respectively.
The intakes of energy and several nutrients as estimated by the FFQ were higher than those estimated by the 24-HR, and this may indicate that the FFQ had an error in the estimation of the amount of nutrients consumed. This tendency of the FFQ to overestimate dietary intake was also reported by earlier studies whether in children, adolescents, or adults (11,21,22,24). Such overestimation could be due to the fact that energy was estimated through many food items. A large number of foods listed under each food group, providing additional selection options when compared to 24-HRs, and incorrect reporting of frequency of consumption and/or of amount of consumed foods might be a source for this overestimation. For some foods in the FFQ, it may have been that they were listed as single food items as well as included as ingredients in mixed dishes; and it is also possible that rarely consumed foods were not reported over the four-day period of food recalls.
Our FFQ showed generally low to moderate correlations with 24-HRs of energy-adjusted data, ranging from 0.04 for trans-fat to 0.46 for proteins. These results are in agreement with those reported by Moghames et al. (11), Rodríguez et al. (23), and Matos et al. (22), who showed low values for correlation after energy adjustment (from 0.18 to 0.38). However, high correlation estimates (0.45-0.73) were reported by Buscemi et al. (29). These differences in correlation values between studies might be due to differences regarding the type of FFQ (either semi-quantitative or non-quantitative), the number of participants included in the study, the tested nutrients, the reference method used, the number of days of food recall recorded, and the variations extant among study populations (30).
Regardless of the presence of some weak correlation coefficients in this study, cross-classification according to quartiles of crude and energy-adjusted macronutrients and micronutrients revealed an acceptable agreement between the two dietary estimation methods. Regarding all nutrients, over 60 % of participants were classified into the same or adjacent quartile of crude and adjusted intake. The proportion of participants classified into the same or adjacent quartile in this study is consistent with other studies. Rodríguez and colleagues (2017) found that 61 % to 77 % of children and adolescents were classified by 24-HRs and FFQs into the same or adjacent quartile according to their nutrient intake, whereas 5 % to 11 % were misclassified into other quartiles in their study (23). The FFQ used by Watson and colleagues in 2009, and validated against four food recordings, was able to classify 52 % to 71 % of Australian children and adolescents into the same or adjacent quintile based on their nutrient intake (26). In epidemiologic research, the ability of a FFQ to sort participants by level of nutrient intake is more important than its ability to estimate mean intakes (9).
A Bland-Altman analysis was used to assess agreement between the FFQ-1 and the four 24-HRs, aiming to provide further information rather than correlation coefficients alone. The agreement observed between the FFQ-1 and the four 24-HRs decreased with increases in energy intake. The scatter plots delivered evidence of both over-reporting and under-reporting with the FFQ as compared with the 24-HR. A similar finding was also shown in one validation study among Lebanese children (11). On the other hand, the agreement seen between the FFQ-1 and the four 24-HRs decreased with increased intake of protein, meaning that the 24-HR overestimated intake as compared with the FFQ. On the contrary, other validation studies reported that FFQs overestimated the intake of protein as compared with 24-HRs (11,22).
In order to evaluate reproducibility, the FFQ was completed twice a month apart. Intraclass correlation coefficients between the two FFQs ranged between 0.5 and 0.9. However, the obtained coefficients were higher than those reported by Moghames and colleagues (2016), whose intraclass correlation coefficients varied from 0.31 to 0.73 (11). In contrast, Rodríguez and colleagues (2017) found lower intraclass correlation coefficients than those of the present study; they reported that coefficients ranged between 0.06 and 0.31 for their developed semi-quantitative FFQ for children and adolescents aged from 0 to 14 years in Peru (23). According to Cade et al. (2002) correlation coefficients of 0,5 to 0,7 between two administrations of the same FFQ are commonly revealed (13). In the current study, the average intraclass correlation coefficients obtained was 0.8. According to Koo and Li (2016), this value would be considered good (31). The lowest correlation was found for trans-fat intake. This can be explained by a low frequency of trans-fat consumption and low amounts of trans-fat usually used in the preparation of Jordanian sweets and desserts, leading to the difficulty seen in their being estimated. In addition, the computerized program Food Processor Nutrition Database (ESHA) used in evaluating nutrient intake was not fully compatible with our food items, especially regarding trans-fats, and the software does not reflect actual intake by those children.
LIMITATIONS
Many weaknesses were encountered in the present study. Firstly, the sample was not selected randomly, and participants were selected conveniently according to the inclusion criteria. Biases related to memory, overestimation or underestimation of portion sizes and cooking techniques, seasonal variations in some fruits and vegetables, and the general changes of one’s diet throughout the year may affect the accuracy of the collected data. As dietary records and recalls are, in general, characterized by having a higher validity than FFQs, dietary recalls are still a good reference method to use in the validation of FFQs. The time between the two administrations of the FFQ was short, and the participants may simply have remembered their previous answers. Furthermore, validation of an FFQ by comparing macronutrient and micronutrient intakes with their relevant concentrations in plasma was not among the approaches used in this study. Another limitation is the boys-to-girls ratio, which was around 37 % to 63 %, respectively. This was due to a better compliance and commitment of girls with study requirements as compared to boys.
On the other hand, one of the main strengths of our study was that most of the enrolled participants completed both the validity and reliability parts. The obtained sample size was in accordance with the recommendations on sample size for FFQ validation studies, as guidelines recommend that at least 50 to 100 subjects per each demographic group should be included. Additionally, trained dietitians were charged with collecting the required data during a face-to-face interview. For a more precise estimation of portion sizes, food models and measuring cups and spoons were used.
CONCLUSION
This is the first study in Jordan to examine the validity and reproducibility of an FFQ including questions about food items and mixed dishes for children aged 6 to 18 years. The results suggest that the FFQ presented a good reproducibility and reasonable validity, and therefore can be used in studies as a useful tool for assessing the habitual nutrient intake of children.

