


 Servicios personalizados
 Inglés (pdf)
 Articulo en XML
 Referencias del artículo
 Enviar articulo por email
 Citado por SciELO
  Citado por Google
  Similares en
SciELO
Similares en
SciELO  Similares en Google
 Permalink
INTRODUCTION
The prevalence of obesity is alarming, and is considered a public health problem worldwide (1). Bariatric surgery, including biliopancreatic diversion, gastric bypass, sleeve gastrectomy, and son on, has emerged as the most effective strategy to treat obesity and its associated comorbidities (2). Non-surgical treatments may fail to provide substantial and long-term weight loss in morbid obesity cases (3,4). Among all the surgical procedures for the treatment of morbid obesity, BPD is considered a good procedure due to its low morbidity and mortality rate, and its efficacy (5).
The response of individuals with obesity, regardless of the form of treatment, is heterogeneous, indicating that the genetic background of obese subjects, besides environment, is involved in the success of weight loss therapy (6,7). The role of genetics in the modulation of weight loss is related to genes involved in different pathways such as thermogenesis regulation, appetite and satiety circuits, adipogenesis, energy expenditure, and cardiovascular risk factors.
The action of melatonin is mediated by two receptors: melatonin receptor 1 (MT1, encoded by MTNR1A) and melatonin receptor 2 (MT2, encoded by MTNR1B). MTNR1B is the ubiquitous receptor. A lot of evidence shows that particularly melatonin rhythmicity plays crucial roles in a variety of metabolic functions as an antioxidant, appetite controller, anti-inflammatory chronobiotic, and possibly epigenetic regulator (8). One of the common SNPs (single nucleotide polymorphisms) in the melatonin receptor type 1B (MTNR1B) gene is rs10830963. It has been related to impaired melatonin rhythm and signaling (8). The investigations studying the effect of this polymorphism in response to weight loss strategies are scarce, and there is no study in the literature that evaluates the effect of this SNP on biochemical modifications after bariatric surgery. Goñi et al. (9) reported that the rs10830963 SNP could be related with weight loss as induced by caloric restriction. The same investigators (10) have detected a relationship of this SNP with lipid response after a 2-year, weight-loss diet. In another study a significant interaction was detected between this SNP (11) and a dietary intervention with a hypocaloric, Mediterranean style-based diet on body weight loss and insulin resistance, too.
Therefore, we hypothesized that the MTNR1B genotype rs10830963 might influence metabolic changes after biliopancreatic diversion surgery in morbidly obese subjects during 3 years of follow-up.
MATERIALS AND METHODS
SUBJECTS AND SURGICAL PROCEDURE
We conducted a prospective study approved by the local Ethics Committee (HURH-Committee-3/2016). Individuals with an age range of 35-55 years who underwent bariatric surgery (biliopancreatic diversion) were included and signed a written informed consent. All the procedures performed in this study were in accordance with the Declaration of Helsinki.
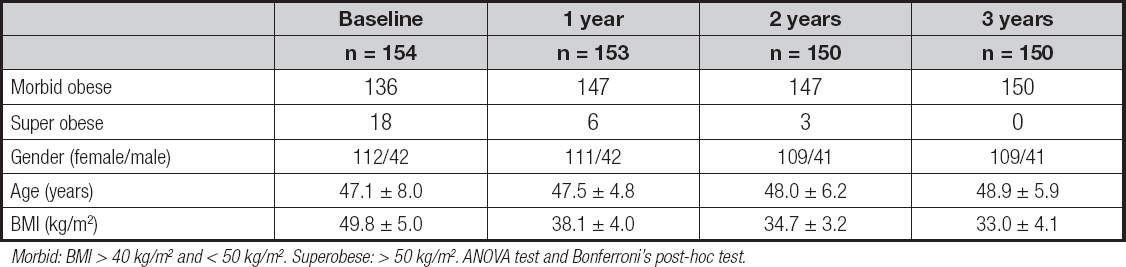
A total of 154 Caucasian participants (112 females and 42 males) with grade-III obesity (body mass index ≥ 40) and without diabetes mellitus were enrolled in the study (Table I). The BPD without duodenal switch technique consisted of the set-up of a 175-cm alimentary limb and 70-cm common limb with the addition of partial gastrectomy and closure of the duodenal stump, transection of the small bowel half way from Treitz’s angle to the ileocecal valve, followed by a Roux-en-Y gastroenterostomy on the distal bowel loop and an end-to-side enteroileostomy of the proximal bowel loop on the ileum, 50-75 cm before the ileocecal valve. After the first month past the surgical procedure, all study participants received the same diet based on the consumption of 1100-1400 calories; non-protein calories were distributed among fats (30 %, divided into 10 % saturated, 15 % monounsaturated, and 5 % polyunsaturated) and carbohydrates (70 %). Protein consumption was 1.5 g per kg of ideal weight (BMI, 22 kg/m2). All patients took two Multicentrum® tablets daily.
PROCEDURE
Blood pressure, body weight, waist circumference, serum lipid levels (total cholesterol, low-density lipoprotein cholesterol, high-density lipoprotein cholesterol, triglycerides), insulin, fasting glucose, homeostasis model assessment of insulin resistance (HOMA-IR), and associated morbidities (percentage of study participants with hypertension or hyperlipidemia) were obtained at the last visit prior to surgery (baseline) and at each later postoperative visits after 1, 2 and 3 years following the operation. Percent excess weight loss (EWL%) was calculated in each visit. Exclusion criteria included severe liver or chronic renal disease, malignancies, coagulopathy, gastrointestinal tract diseases, and drug therapy for diabetes mellitus. Inclusion criteria included body mass index (BMI) ≥ 40 kg/m2 and a history of failed weight loss on hypocaloric diets prior to surgery. The genotype of the MTNR1B gene (rs10830963) was evaluated in all subjects.
ANTHROPOMETRIC PARAMETERS AND BLOOD PRESSURE
Body weight was determined to an accuracy of 10 g using a manual scale (Seca, Birmingham, United Kingdom). Height was measured with the patient in an upright position to the nearest centimeter using a stadiometer (Seca Birmingham, United Kingdom). BMI was calculated using the formula: (weight [kg] / height x height [m2]): morbid obese patients were classified at 40-49.9 kg/m2, and supermorbid obese subjects at above 50 kg/m2. Waist circumferences (WC) were measured with a flexible, non-stretchable measuring tape (Type SECA, SECA. Birmingham, UK). Percent excess weight loss (EWL%) was calculated using the formula; (preoperative weight - current weight x 100 / preoperative weight - ideal weight). Ideal weight was calculated with an ideal BMI of 22 kg/m2. A bioimpedanciometry (BIA) was performed on all subjects after a fast of at least 8 hours; subjects were warned that they could not exercise or drink alcohol within 48 hours prior to the test. An alternating current of 0.8 mA at 50 kHz, produced by a calibrated signal generator (EFG, Akern, Firenze, Italy) (12), was used and applied to the skin by adhesive electrodes placed on the back of the hand and right foot. The parameter analyzed with BIA was total fat mass (kg). Blood pressure was measured twice after a 10-minute rest with a sphygmomanometer (Omrom, Los Angeles, California, USA) and averaged.
The presence of comorbidities was defined as hypertriglyceridemia (triglycerides > 150 mg/dL), hypertension (systolic and diastolic blood pressures higher than 130 and 85 mmHg, respectively), low HDL cholesterol (< 40 mg/dL and 50 mg/dL for men and women, respectively). All patients with hypertension or hypertriglyceridemia were taking drugs at baseline (13).
BIOCHEMICAL PARAMETERS AND GENOTYPING
Blood samples were taken after an overnight fast of 10 hours. After centrifugation, the serum were stored at -40 ºC. Plasma glucose levels were determined by using an automated glucose oxidase method (glucose analyzer 2, Beckman Instruments, Fullerton, California, USA). Plasma insulin levels were measured by enzymatic colorimetric means (Insulin, WAKO Pure-Chemical Industries, Osaka, Osaka, Japan) (14), and the homeostasis model assessment for insulin resistance (HOMA-IR) was calculated using values with the following formula: (glucose x insulin) / 22.5 (15). Serum total cholesterol, HDL-cholesterol, and triglyceride concentrations were determined by enzymatic colorimetric assays (Roche Diagnostics, Mannheim, Waden Wunterberg, Germany). LDL-cholesterol was determined using Friedewald’s formula (16).
Genomic DNA was extracted from 5 mL of whole blood using a commercially available DNA blood kit (QIAamp®, Madisson, WI, USA) following the manufacturer's instructions. The genotyping (rs10830963) was performed using customized assays with the TaqMan® OpenArray™ Genotyping platform (Thermofisher, Pittsburg, Pens., USA). Samples were loaded using the AccuFill system, and amplification was performed on the QuantStudio 12K Flex Real-Time qPCR instrument (Thermofisher, Pittsburg, Pens., USA). A total volume of 5 μL with 2.5 μL of TaqMan OpenArray Master Mix (Applied Biosystems, Foster City, CA, USA) and 2.5 μL of human DNA sample was loaded and amplified on arrays following the manufacturer’s instructions. Genotype calling and sample clustering for OpenArray assays were performeded in a TaqMan Genotyper (LifeTechnologies, Carlsbad, CA, USA).
STATISTICAL ANALYSIS
The IBM SPSS Statistics, version 23.0 (IL, USA), was used for all statistical analyses. The power analysis suggested at least 150 subjects with an expected weight loss of 30 %, with a type-I error of 0.05 and a type-II error of 0.10 (power = 0.9). All analyses were performed under a dominant genetic model with the rs10830963 G-allele as risk allele (GG + GC vs. CC).
Data are reported as mean ± standard deviation. The normal distribution of variables was studied with the Kolmogorov-Smirnov test. Non-parametric variables were analyzed with the Mann-Whitney test and Wilcoxon’s test. The parametric test was analyzed with an ANOVA test and Bonferroni’s post-hoc test. Qualitative variables and the presence of comorbidities were analyzed with the chi-squared test, with Yates’ correction as necessary, and Fisher’s test as necessary. The statistical analysis to evaluate the time per group interaction was a univariate ANCOVA, adjusting by baseline weight, age, and gender. A p-value under 0.05 was considered statistically significant.
RESULTS
A total of 154 obese subjects were included, and 150 of these completed the follow-up at 3 years. With the above-mentioned power analysis, the sample was reached. Of the whole group, 112 subjects were female (72.7 %) and 42 were male (27.3 %). The allelic frequency carrying the C and G allele was found to be 75.3 % and 24.7 % respectively. The Hardy-Weinberg equilibrium was calculated with a statistical test (chi-squared), and the variant of the MTNR1B gene was in Hardy-Weinberg equilibrium (p = 0.31). The genotypic frequency was found to be 54.5 % (84 study participants) for the CC genotype, 41.6 % (64 study participants) for the CG genotype, and 3.9 % (6 study participants) for the GG genotype. The patients were divided into two groups: G-allele carriers (GG + GC, 45.5 %) and non-G-allele carriers (CC, 54.5 %). The gender distribution was similar for the different genotypes: CC, 25.0 % (n = 21) for males and 75.0 % (n = 63) for females, CG, 27.2 % (n = 18) for males and 71.9 % (n = 46) for females, and (GG, 33.3 % (n = 2) for males and 66.6 % (n = 4) for females) (p = 0.19). The average age was similar in all genotype groups (CC: 47.3 ± 7.2 years vs. CG + GG: 46.9 ± 9.2 years: p = 0.36), too. Table I shows the characteristics of all the participants included in the study. As expected, during the three-year follow-up period there was a gradual loss of study participants to follow-up.
Table II shows the anthropometric parameters and blood pressure of subjects before and after their BPD. Weight loss was similar in both genotype groups (p = 0.21). All anthropometric parameters (body weight, waist circumference, and fat mass by BIA) showed a statistically significant reduction after surgery at 1, 2, and 3 years. Systolic and diastolic blood pressures improved in both groups, too. No preoperative differences in anthropometric parameters and blood pressure were observed between genotypes. Improvements in these variables were similar for both genotypes, and all parameters were significantly different from baseline values. In G-allele and non-G-allele carriers the percentage of excess of weight loss (EWL%) showed a significant improvement at all times during follow-up.
Table II. Changes in anthropometric variables during follow-up (mean ± SD)

DBP: diastolic blood pressure; SBP: systolic blood pressure; WC: waist circumference; EWL%: percent excess weight loss; *p < 0.05 in each genotype group with baseline values, analyzed with Bonferroni’s test. There are no statistical differences in anthropometric and metabolic characteristics between the two genotype groups. ANCOVA, adjusting by baseline levels of weight, age, and gender.
Table III shows the changes in all biochemical parameters. No significant preoperative differences in glucose, HOMA-IR, insulin, total cholesterol, HDL-cholesterol, LDL cholesterol, and triglyceride levels were detected between genotypes. Fasting glucose, insulin, HOMA-IR, total cholesterol, LDL-cholesterol, and triglyceride levels decreased in both genotype groups during follow-up. Although the improvements seen in glucose, insulin, and HOMA-IR were significant in both genotypes, this change was significantly higher amonge non-G-allele carriers, and as soon as 12 months after surgery was this improvement noticeable. This analysis has been adjusted for age, gender, and weight. These improvements were detected later, at 24 months, in G-allele-carriers. Thus, the decrease in fasting insulin levels after the first year (delta: -3.9 ± 1.2 mIU/L vs. -1.8 ± 1.1 mIU/L; p = 0.03), the second year (delta: -5.0 ± 0.3 mIU/L vs. -2.3 ± 0.2 mIU/L; p = 0.01), and the third year (delta: -5.1 ± 1.9 mIU/L vs. -2.8 ± 1.1 mIU/L; p = 0.02) were higher in non-G-allele carriers than in G-allele carriers. On the other hand, the improvement seen in HOMA-IR levels at year one (delta: -0.7 ± 0.2 mIU/L vs. -0.2 ± 0.2 mIU/L; p = 0.03), year two (delta: -1.0 ± 0.3 mIU/L vs. -0.5 ± 0.2 mIU/L; p = 0.01) and at year three (delta: -1.2 ± 0.3 mIU/L vs. -0.4 ± 0.2 mIU/L; p = 0.03) were also higher in non-G-allele carriers than in G-allele carriers. Finally, baseline glucose levels after the first year (delta: -10.1 ± 2.4 mg/dL vs. -3.6 ± 1.8 mg/dL; p = 0.02), the second year (delta: -16.0 ± 2.3 mg/dL vs. - 8.4 ± 2.2 mg/dL; p = 0.01) and the third year (delta: -17.4 ± 3.1 mg/dL vs. -8.8 ± 2.9 mg/dL; p = 0.03) were higher in non-G-allele carriers than in G-allele carriers. As a result of this slower decrease in the values of HOMA-IR, glucose, and insulin, these parameters were higher at year 1, 2, and 3 in G-allele carriers. Finally, HDL-cholesterol levels increased in both genotype groups during follow-up to the same extent.
Table III. Evolution of biochemical parameters during follow-up (mean ± SD)

LDL: low density lipoprotein; HDL: high density lipoprotein; Ch: cholesterol; TG: triglycerides; HOMA-IR: homeostasis model assessment; *p < 0.05, in each group with baseline values, analyzed with Bonferroni’s test; †p < 0.05 between genotypes ANCOVA, adjusting by baseline levels of weight, age, and gender.
Table IV shows the improvement seen in comorbidities (percentage of hypertriglyceridemia, hypertension, and low-HDL levels). These improvements (frequencies) were similar in both genotype groups and represented patients with normal values of these parameters and discontinuation of drug therapy.
Table IV. Percentage of comorbidities during follow-up
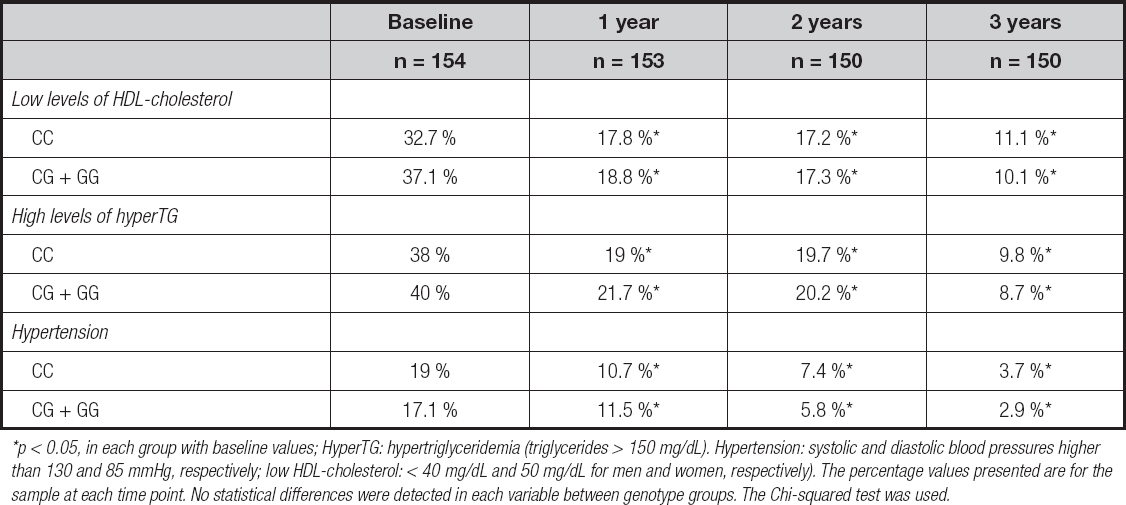
*p < 0.05, in each group with baseline values; HyperTG: hypertriglyceridemia (triglycerides > 150 mg/dL). Hypertension: systolic and diastolic blood pressures higher than 130 and 85 mmHg, respectively; low HDL-cholesterol: < 40 mg/dL and 50 mg/dL for men and women, respectively). The percentage values presented are for the sample at each time point. No statistical differences were detected in each variable between genotype groups. The Chi-squared test was used.
DISCUSSION
In the present study we evaluated the contribution of variant rs10830963 of the MTNR1B gene on biochemical changes in a sample of non-diabetic morbid obese subjects undergoing biliopancreatic diversion surgery. Our data show a less powerful effect of G-allele of the rs10830963 variant in modulating glucose levels, insulin levels, and HOMA-IR levels after extensive weight loss during 3 years of follow-up.
As far as we know, this is the first time that an analysis of this polymorphism in a cohort of morbid obese subjecs is carried out after bariatric surgery and over 3 years. The G-allele frequency of the MTNR1B polymorphism in our study (0.24) was equal to previous data in the literature (17,18). The similarity of our allelic frequency with the data reported in these previous studies of non-morbid obese subjects, and the absence of differences in baseline anthropometric and biochemical data, suggest that this SNP in the melatonin pathway does not have a direct impact on adiposity parameters.
Moreover, there are few interventional studies evaluating the relationship between weight loss and this SNP located in MTNR1B (9-11). In one study (9), Goñi et al. showed that the G-allele of the rs10830963 SNP could be related with weight loss as induced by caloric restriction. In a further study (10), the same group showed a relationship of this SNP with lipid response after 2 years on a weight-loss diet. Additionally, a negative relation was detected between G-allele (11) and weight loss secondary to a dietary intervention with a hypocaloric, Mediterranean style-based diet on insulin levels and insulin resistance, too. And the same effect of the minor allele (G) was observed with other different hypocaloric diets (19). Our present findings in the analysis of adiposity parameters suggested that the MTNR1B variant (rs10830963) may not affect total body weight and fat mass response, a result that seems logical when taking into account the extensive weight loss generated by the BPD surgery and the minor effect that an isolated SNP may have.
The second main finding of our study is that G-allele carriers showed less improvement in glucose, insulin, and HOMA-IR levels after weight loss than non-G-allele carriers, as well as a slower improvement of these parameters in comparison with non-G-allele carriers, as these were not observed until after 24 months of follow-up. The pathophysiological mechanisms by which the rs10830963 SNP of the MTNR1B gene affects these metabolic parameters remains unknown. It could be hypothesized that the effect of the MTNR1B SNP on the dynamics of melatonin expression might influence glucose metabolism. The effect of feeding on the rhythmic mRNA expression of clock or circadian rhythmic balance genes has also been shown in animals (20,21). Moreover, Grotenfeld et al. (22) have reported the relationship of this SNP with glucose levels. More specifically, they reported that, among females at high risk for gestational diabetes mellitus, G-allele carriers did not seem to benefit from lifestyle interventions. In other studies, the risk G-allele has been related to decreased insulin sensitivity (23) and decreased insulin secretion in response to glucose (24), too. Experimental studies have demonstrated that the G-allele of rs10830963 that leads to increased glucose levels was associated with reduced pancreatic cell function (HOMA-B) (25), and that G-allele carriers had a reduced suppression of hepatic glucose production during a hyperinsulinemic-euglycemic clamp, indicating the presence of hepatic insulin resistance (26). These differences in the response of glucidic metabolism parameters between genotypes we have not detected in improvement of comorbidities, determined as the percentage of study participants with hypertension or dyslipidemia.
All these previously mentioned metabolic results may be related to alterations in circulating melatonin levels. For example, G-allele carriers have a later melatonin offset and a longer duration of elevated melatonin levels (27). Perhaps, this disruption of the melatonin rhythm among carriers of the risk allele could produce an increase in food intake and metabolism. As a different hypothesis, it is possible that the G-allele may be involved in the regulation of MTNR1B gene expression or other gene expression that might influence the role of melatonin on glucose metabolism. These metabolic pathways are very complex and recently, Ivry et al. (28) have shown that the use of melatonin premedication improves the quality of recovery (sensation of pain and sleep) after bariatric surgery. Clear relationships of this polymorphism with the presence of polycystic ovary, risk of gestational diabetes, and type-2 diabetes mellitus have also been discovered (29-31).
Our study has limitations. Firstly, we did not measure serum melatonin levels in the study population, which prevented the potential analysis of the relationship between serum melatonin levels and the SNP. Secondly, we only analyzed one SNP of the MTNR1B gene, so other SNPs in this or in various other gene loci could be related with our observations. Thirdly, many uncontrolled, non-genetic factors could modify the relationships in our design (smoking habit, exercise, hormone status, and so on), as also could epigenetic factors. Fourthly, the lack of a dietary assessment throughout the study in order to measure carbohydrate, fiber, and fat intakes. Finally, our group of study participants was a morbid obese adult sample without diabetes mellitus, so the data obtained may not be extrapolated to other populations.

