SciELO - Scientific Electronic Library Online

 
vol.38 número1Evolución de la percepción y distorsión de la imagen corporal con la práctica de Pilates en suelo y con aparatos en mujeres adultasConsumo de alimentos ultraprocesados y obesidad: una revisión sistemática índice de autoresíndice de materiabúsqueda de artículos
Home Pagelista alfabética de revistas  

Servicios Personalizados

Revista

Articulo

Indicadores

Links relacionados

  • En proceso de indezaciónCitado por Google
  • No hay articulos similaresSimilares en SciELO
  • En proceso de indezaciónSimilares en Google

Compartir


Nutrición Hospitalaria

versión On-line ISSN 1699-5198versión impresa ISSN 0212-1611

Nutr. Hosp. vol.38 no.1 Madrid ene./feb. 2021  Epub 26-Abr-2021

https://dx.doi.org/10.20960/nh.03118 

REVIEWS

Food portion sizes, obesity, and related metabolic complications in children and adolescents

Tamaño de las porciones de alimentos, obesidad y complicaciones metabólicas asociadas en niños y adolescentes

Sondos M Flieh1  , Esther M González-Gil2  , María L Miguel-Berges1  , Luis A Moreno Aznar1  3  4  5 

1Growth, Exercise, Nutrition and Development (GENUD) Research Group. Universidad de Zaragoza. Instituto Agroalimentario de Aragón (IA2). Zaragoza, Spain

2Department of Biochemistry and Molecular Biology II. Instituto de Nutrición y Tecnología de los Alimentos. Centro de Investigación Biomédica (CIBM). Universidad de Granada. Granada, Spain

3Instituto de Investigación Sanitaria de Aragón (IIS Aragón). Zaragoza, Spain

4Facultad de Ciencias de la Salud (FCS). Universidad de Zaragoza. Zaragoza, Spain

5Centro de Investigación Biomédica en Red de Fisiopatología de la Obesidad y la Nutrición (CIBERObn). Instituto de Salud Carlos III. Madrid, Spain

Abstract

The purpose of this narrative review is to provide evidence for the impact of food portion sizes on the development of obesity in children and adolescents. Strategies are needed on portion size estimation and on the relationship of portion size with certain health problems such as obesity, insulin resistance, and emotional eating in all age groups, in order to provide information for parents, teachers, and health professionals aiming to promote healthy eating. A wide range of controlled laboratory studies have found that portion size (PS) had the strongest effect on the amount of food consumed. The effect of PS on total energy intake has been already observed with different types of foods and beverages, especially with energy-dense foods. The influence of large PS was persistent and happened regardless of demographic characteristics such as age, gender, income level, or body mass index. Although a direct causal link between PS and obesity remains controversial, some health and dietetics organizations recommend to moderate PS, especially for energy-dense foods. Research studies in both laboratory and free-living contexts are needed to determine the causal link between increased PS, obesity, and related metabolic complications in children and adolescents.

Key word: Food portion sizes; Energy intake; Obesity; Insulin resistance; Metabolic syndrome; Emotional eating; Children; Adolescence

Resumen

El objetivo de esta revisión narrativa es proporcionar evidencia actual sobre el impacto del tamaño de las porciones de alimentos sobre el desarrollo de la obesidad en niños y adolescentes. Son necesarias estrategias sobre la estimación del tamaño de las porciones y su relación con ciertos problemas de salud como la obesidad, la resistencia a la insulina y la alimentación emocional en todos los grupos de edad, a fin de proporcionar una comunicación efectiva para los padres, los profesores y los profesionales de la salud, teniendo por objetivo promover una alimentación saludable. Varios son los estudios que encontraron asociaciones positivas entre el tamaño de la porción y la cantidad de alimentos consumidos. También se ha observado que el tamaño de la porción influye en la ingesta total de energía, especialmente en el caso de los alimentos de elevada densidad energética, siendo este efecto independiente de las características demográficas, como la edad, el género, el nivel socioeconómico o el índice de masa corporal. La relación causal entre el tamaño de las porciones y la obesidad sigue siendo controvertida; algunas organizaciones de salud y dietética recomiendan moderar los tamaños de las porciones, especialmente tratándose de alimentos de elevada densidad energética. Por ello se necesitan más estudios a corto y largo plazo que puedan determinar la relación causal entre el aumento del tamaño de las porciones, la obesidad y las complicaciones metabólicas asociadas en niños y adolescentes.

Palabras clave: Tamaño de las porciones de alimentos; Ingesta de energía; Obesidad; Resistencia a la insulina; Síndrome metabólico; Alimentación emocional; Niños; Adolescencia

INTRODUCTION

The key of healthy eating seems to consist in choosing an appropriate and adequate amount of food from various food groups. A healthful diet is essential for both good health and nutritional status, and represents a key component of obesity prevention strategies. According to WHO, nearly over 340 million children and adolescents aged between 5 and 19 years were diagnosed with overweight or obesity in 2016 (1). In addition, the prevalence of overweight and obesity within these population groups has risen dramatically from 4 % in 1975 to over 18 % in 2016 (1). A large amount of evidence shows that the portion size (PS) of some foods, especially those consumed in restaurants, has increased dramatically over the last 30 years, along with the prevalence of obesity (2,3), a trend that started in the 1970s and persists nowadays. With a view to invert this situation, individuals need effective strategies to regulate their energy intake in spite of the widespread availability of highly palatable, energy-dense foods (4). Increased PS of commonly served foods is considered a major factor that has contributed to excessive energy consumption and, consequently, to the development of obesity (3,5). Obesity is considered the most common cause of insulin resistance in children (6), as well as of dyslipidemia (7) and type-2 diabetes (8). In the public health setting, research data about food intake, both in individuals and populations, serve as the basis for nutrition monitoring and food policies (5). In this narrative review we focus on the relation between food PS, total energy intake, obesity, and some metabolic syndrome features such as insulin resistance in children and adolescents.

SCOPE AND METHODOLOGY OF THIS REVIEW

The strategy for bibliographic search focused on articles published in the English language from 1952 to December 2019 (including online). The databases used included PubMed, Web of Knowledge, Scopus, Science Direct, and online books. In addition, citations in reviews and paths within databases were also incorporated. Key terms included: portion size, food size, food type, dietary estimation method, portion size estimation, food photography, food model, household measures, obesity, food choice, dietary intake, body mass index (BMI), energy-dense food, energy intake, emotional eating, insulin resistance, diabetes, children, adolescents, satiety, appetite, exposure, reward, model, and pressure to eat.

FOOD PORTIONS. DEFINITION AND ESTIMATION

A portion is defined as the amount of food that we choose to eat for a meal or snack, or the amount of a food that we decide to eat or serve to an individual on a single eating occasion (9). The size of a food portion can be identified as the weight or volume of household measures such as: tablespoons, hand measures, or size of a reference object (10). The concept of PS varies widely between countries, across different population groups, and according to both individual and environmental factors (10). For example, a PS may reflect a person's own choice, the choice of the food producer in a restaurant, or a recommendation by a health professional or the government. PS also reflects ways of eating—for instance, in some cultures the hand-based portion is used to self-serve or measure portions of foods for others (11).

Various methods are used to assess dietary intake, such as single or multiple 24-hour dietary recalls, estimated dietary records, diet history, and food frequency questionnaires. However, since these methods rely on an individual's memory, there is a certain challenge in determining food intake, especially in relation to accurate estimation of food PS. To estimate PS several options are available: directly weighing the amount of food consumed by the participant or estimating the size of food portions via visual comparisons to household measures, food models, or photographs.

Directly weighing food portions

Because foods have to be weighed before consumption, weighing methods for determining portion sizes can only be used with prospective dietary assessment methods and using properly calibrated scales (12). The weighing should be done by investigators or by participants. Although weighed food records are an accurate traditional dietary assessment method, it is time consuming, cumbersome for participants, and costly to implement.

Visual estimation of weights and size

Direct observation using visual estimation is a non-intrusive method of estimating food portions that provides an acceptable alternative (13). To apply this method, observers should be trained to estimate PS by monitoring the weights of foods consumed by participants. The accuracy of estimations may vary according to the type and quantity of food (14). Several studies revealed a good correlation between visual estimates and actual weight (14). Even so, observers may differ on their ability to estimate food weights visually, as they tend to overestimate the weight of the foods consumed and to underestimate plate wastes, which may result in potential bias when estimating sizes of foods with a high volume but low weight (13). Of note, a wide range of methods have been described to quantify outcomes related to PS in research studies, including surveillance and epidemiological analyses, clinical and nutritional studies, and research on eating behaviors (15). The most frequently used measurements are food models, photographs, and household measures (16).

Household measures

Even though some foods, like eggs, oranges, or soft drinks, can be recorded in units, other food items are often measured in volumes such as cups or tablespoons (16). These measures are familiar and easy to use. However, volume measures may produce considerable error and individual variability in estimating portion weights (17) because foods can be packed tightly or loosely, and certain foods, such as meats and pastries, do not conform to measuring devices (18). Household food measures have led to significant under- or over-estimations of actual portion weight (16). Cons0equently, household measures are not accurate for individuals, but they are still used to produce acceptable data for group estimations in epidemiological studies.

Food models

Food models are also known as fake food models; they are geometric shapes of food samples. Some studies found that having realistic models closer to real food is a better option for children (19). On the other hand, a systematic underreporting of intake was found when three-dimensional plastic food models were used to represent servings, and the magnitude of this underreporting varied across food items. In contrast, when larger-sized food models were used, participants tended to be more accurate in reporting their intake of foods (20,21).

Photographs

In studies that involve telephone recalls or self-administrated dietary surveys, two-dimensional pictures of food shapes were as effective as three-dimensional models in supporting participants to estimate PS (22). Food photographs of various PSs have been reported to be useful in some studies (23), but poor correlations to actual measurements were detected in others (24).

FACTORS AFFECTING FOOD PORTION SIZES ESTIMATIONS

Several studies have been conducted to examine the influence of some specific characteristics of foods, study subjects, and interviewers on the accuracy of PS estimations.

Food characteristics

Food type

It is important to know which foods are more reliable to estimate the size of their portions. Significant errors have been reported for some foods such as cakes, salads, butter on toast (25), and amorphous foods such as spaghetti or apple sauce (26), as well as for fish, rice, steak, and cheese (20). However, some studies indicate no consistent association between size estimations and food type (27).

Food size

Some studies found greater difficulties in estimating PS as portion size increases (28). In addition, some investigators reported that large plates are harder to estimate (29), but others did not report any differences related to plate size (27).

Subject characteristics

Age

Previous studies suggested that children are not able to estimate PS very accurately, even when prompted with visual aids (30). In contrast, recent studies found that children can estimate food PS with an accuracy approaching that of adults (31). However, high-school and college students have also reported difficulties when estimating PS (32).

Gender

The influence of gender on PS estimation has been argumentative, even though some studies report that women are better estimators (12), others report minimal or no differences (20). These differences between genders may reflect a skill attributed to the greater experience of women in measuring food as a function of their reference system, or a biological response to the higher energy needs of men versus women (33).

RELATIONSHIP BETWEEN FOOD PORTION SIZE AND TOTAL ENERGY INTAKE

The consumption of large PSs, especially from high energy-dense foods, has been identified as a major cause of excessive total energy intake (34). Laboratory studies show that increasing PS leads to increased energy intake in adults (35-37), mostly for high energy-density (HED) foods (2,3,34), in children and adolescents over 3 years of age (38-42). This finding is called the "portion size effect" or portion size response. This association has been observed in both laboratory and free-living studies, binding the consumption of large PSs with increased energy intakes across a variety of foods, ages, and body weights (3,43). Interestingly, this impact has been observed with packaged snacks (35), energy-dense casseroles (36,40), unit foods like sandwiches (44) and beverages (45), and even with low energy-dense foods like fruits and vegetables. Additionally, the effect of PS has been also observed in restaurants and offices (46,47), even if participants were served unpalatable foods (48) or with manipulation of plate size (49). To systematically assess the effect of PS on energy intake, several studies were conducted (Table I). A study assessed four US nationally representative surveys from 1977 to 2006 for three age groups (2-6-, 7-12-, and 13-18-year-olds), and found that, in all age groups, larger PSs of pizza were linked with higher energy intakes at eating occasions, whereas in 7-12- and 13-18-year-olds higher energy intakes at meals correspond with larger PSs of sugar-sweetened beverages (SSBs), French fries, or salty snacks (38). In another study, when a PS of 250 or 500 g of a macaroni and cheese entrée was served at a dinner meal to children, the effects of the entrée's PS (p < 0.0001) and energy density (p < 0.0001) on energy intake were independent but promoted meal consumption (39). The same result was noticed with a large portion (p < 0.002), when serving three different sizes (small, medium, large) of macaroni and cheese to children at lunchtime (41). In the study by Fisher JO et al., when preschool-aged children doubled the PS of several entrées (breakfast, lunch, dinner) and a snack during a 24-h period, there was an increase in energy intake from those foods by 23 % (180 kcal) (p < 0.0001) (42). Consequently, these studies showed that the PS effect was strongly and consistently observed across food types, environmental conditions, and study populations.

Table I.  Studies assessing PS and its effect on total energy intake in children and adolescents 

FOOD PORTION SIZES AND EMOTIONAL EATING

There are several factors that affect food intake, including metabolic needs (50), emotional states, motivations, and self-regulatory processes (51). To maintain energy balance, cognitive control responds by reducing or increasing food intake in order to cope with stress and negative emotions (52,53). However, it seems likely that consumption of large food portions, with high energy density, facilitates the increase of energy intake (54). Some studies found that external factors and emotional states, and their scores for dietary curb, were significant predictors of food intake. They also found that subjects who scored high on dietary restraint or emotional disinhibition increased their food intake in the presence of larger PSs, which means that a negative or positive mood was significantly associated with greater food and calorie intake across groups (51). In children, a positive association was observed between emotional eating and the frequency of sweet and fatty food consumption, which may contribute to the development of overweight (55), even though the study did not quantify the PS of the consumed food. The relationship between emotional eating and dietary patterns, mainly PS, has not been examined in young children. More studies are needed to analyze the possible influence of emotional eating on food intake in response to dietary manipulations of food PS and energy density.

FOOD PORTION SIZES AND OBESITY, RELATED METABOLIC COMPLICATIONS

FOOD PORTION SIZES AND OBESITY

Although PS has been increasing over time, the effect on weight has not been clearly predictable. Several short-term controlled feeding trials, and epidemiological studies, assessed the association between food PS and body weight, as well as some adiposity indices, showing mixed findings.

In adults, several studies were performed. A midday meal manipulation with a four-week trial showed that larger portions were associated with a weight gain of 0.64 ± 1.16 kg, whereas this change in the standard portions group was 0.06 ± 1.03 kg (56); these weight changes were not significant over time or between test periods. Even so, Rippin et al. (57) found limited evidence on the association between the PS of energy dense foods and BMI in subgroups analyzed from the French and UK national dietary surveys. To assess body weight changes during PS manipulation, an intervention study observed a non-significant increase in body weight after providing a 50 % larger lunch for 1 month (56). However, possibly the PS effect was too small to result in weight change due to the small sample size of the study, and the fact that only one meal of the day was manipulated with controlled PS throughout the intervention period. In another short-term study, a significant increase in mean body weight, for men and women, was observed after larger portions were served on all eating occasions (58). However, these findings are based on cross-sectional analyses, and it still remains unclear whether the association between PS and obesity is causal or associative only. Meanwhile an effective weight loss was well documented with meal replacement products and portion-controlled entrées (59).

Several studies observed a positive relationship between increasing PS and obesity in children (60,61) and adolescents (9,62) (Table II). Fisher JO and Birch LL study on girls, aged between 5 and 7 years, found that those who ate large amounts of snack foods in the absence of hunger were 4.6 times more likely to be overweight (60). This was confirmed by another study conducted in children and adolescents, which found that PS and energy content per meal were significantly associated with BMI percentile in boys 6 to 11 years of age and in children 12 to 19 years of age. However, no relationships were found among children 3 to 5 years and girls 6 to 11 yearsof age (63). Another French study on children aged between 3 and 11 years, taken from the 1998-1999 cross-sectional study, observed that overweight in children aged 3 to 6 years was positively associated with the PS of biscuits (p = 0.0392) and sweetened pastries (p = 0.0027). Also significantly positive trends were observed for PSs of croissant-like pastries (p = 0.0568) and meat (p = 0.0574) (64). In UK adolescents, there was also a positive association between PS of biscuits and cakes and BMI (9).

Table II.  Studies assessing PS effect on BMI and obesity in children and adolescents 

Unfortunately, these studies cannot be taken as proof of causality in children, mainly because they are not reflecting their eating in a free-living context. Consequently, long-term studies are needed to determine the causal link between increasing PS and obesity. However, these studies concluded that reducing PS may be an effective tool for weight control.

FOOD PORTION SIZES, GLYCEMIC INDEX, AND INSULIN RESISTANCE

In 1981 the glycemic index (GI) concept was proposed by Jenkins and colleagues to describe the rate of carbohydrate absorption after a meal (65). GI is defined as ‘the area under the glucose response curve after consumption of 50 g of carbohydrates from a test food divided by the area under the curve after consumption of 50 g of carbohydrates from a control food, either white bread or glucose' (66). Food PS has a major effect on the glycemic index value because glycemic responses are related to carbohydrate load (65). The usefulness of glycemic load (GL) is based on the idea that a high GI food consumed in small portions would have the same effect on blood sugar as larger portions of a low GI food (66,67). Although the effect of PS on GI was mentioned from 1981, there are no experimental studies measuring the effect of PS on GI in children and adolescents.

Insulin resistance, impaired glucose tolerance, and type-2 diabetes are considered ominous public-health issues in all age groups (6,8). Studies found that childhood obesity causes hypertension, dyslipidemia, chronic inflammation, a tendency to increased blood clotting, endothelial dysfunction, and hyperinsulinemia (7,68-70). The clustering of cardiovascular disease risk factors, known as the insulin resistance syndrome, has been identified in pre-pubertal children (71).

Insulin resistance is a key component of the metabolic syndrome, in turn a cluster of cardiometabolic factors with increasing prevalence in children and adolescents, and associated with obesity (72,73). The relationship between metabolic syndrome and diet among children and adolescents remains poorly understood. In adults, studies have shown that dietary patterns characterized by high intakes of fruits and vegetables are generally associated with a lower prevalence of the metabolic syndrome (74,75). Although the development of obesity in genetically stable populations has been increasing (8), studies examining insulin resistance, metabolic syndrome, and their association with diet, especially PS in children and adolescents, are still scarce. It is still unknown whether individual dietary components, or overall diet can independently affect metabolic syndrome in this age group.

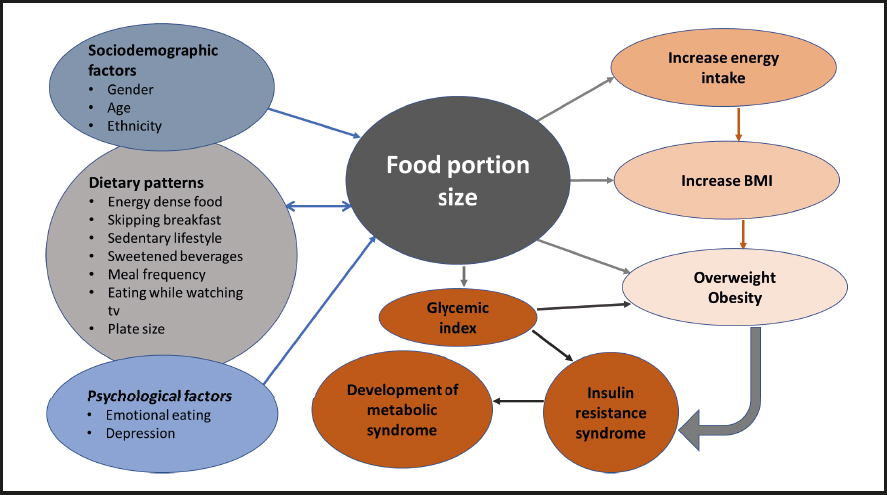
The flow diagram of the underlying factors affected by PS are found in figure 1. High PS is related to obesity and other metabolic complications, whereas many factors such as sociodemographic parameters (gender, age), dietary patterns including energy-dense food, skipping breakfast, and sedentary lifestyle, alongside with psychological factors like emotional eating, were found to have a direct effect on the consumption of large food PSs. As illustrated in figure 1, there is an interchangeable relation between dietary patterns and food PS. For example, the consumption of energy-dense foods was linked with large PSs and vice versa. Furthermore, once a larger portion is chosen, energy intake and—consequently—BMI will increase. Similarly, high food PSs increase glycemic index levels, thus contributing to both insulin resistance and metabolic syndrome. Of note, increasing energy intake could cause an increase in BMI and the development of overweight and obesity, which in turn could contribute to insulin resistance and metabolic syndrome.

Figure 1.  Summary of factors that affect PS and lead to the development of obesity. 

CONCLUSION

Food and drink PS has been increasing in recent years. However, it has not been possible to establish a direct causal link between large food PS, especially in the case of energy-dense foods, and obesity as well as certain metabolic syndrome features. To date there are no long-term, randomized, controlled trials to assess the exposure to large portions of food and its effects on body weight. Clearly, there is an urgent need to develop a well-articulated research framework that systematically tests the interaction between selection of food PS and development of obesity, insulin resistance, and metabolic syndrome in both children and adolescents.

REFERENCES

1. World Health Organisation. Obesity and overweight. Available from https://www.who.int/news-room/fact-sheets/detail/obesity-and-overweightLinks ]

2. Brien SA, Livingstone MB, McNulty BA, Lyons J, Walton J, Flynn A, et al. Secular trends in reported portion size of food and beverages consumed by Irish adults. Br J Nutr 2015;113(7):1148-57. DOI:10.1017/S0007114515000276 [ Links ]

3. Young LR, Nestle M. The contribution of expanding portion sizes to the US obesity epidemic. Am J Public Health 2002;92(2):246-9. DOI:10.2105/AJPH.92.2.246 [ Links ]

4. Lewis HB, Ahern AL, Jebb SA. How much should I eat?A comparison of suggested portion sizes in the UK. Public Health Nutr 2012;15(11):2110-7. DOI:10.1017/S1368980012001097 [ Links ]

5. Prentice AM, Jebb SA. Fast foods, energy density and obesity:a possible mechanistic link. Obes Rev 2003;4(4):187-94. DOI:10.1046/j.1467-789X.2003.00117.x [ Links ]

6. Sinha R, Fisch G, Teague B, Tamborlane WV, Banyas B, Allen K, et al. Prevalence of impaired glucose tolerance among children and adolescents with marked obesity. N Engl J Med 2002;346(11):802-10. DOI:10.1056/NEJMoa012578 [ Links ]

7. Tounian P, Aggoun Y, Dubern B, Varille V, Guy-Grand B, Sidi D, et al. Presence of increased stiffness of the common carotid artery and endothelial dysfunction in severely obese children:a prospective study. Lancet 2001;358(9291):1400-4. DOI:10.1016/S0140-6736(01)06525-4 [ Links ]

8. Ludwig DS, Ebbeling CB. Type 2 diabetes mellitus in children:primary care and public health considerations. JAMA 2001;286(12):1427-30. DOI:10.1001/jama.286.12.1427 [ Links ]

9. Albar SA, Alwan NA, Evans CE, Cade JE. Is there an association between food portion size and BMI among British adolescents?Br J Nutr 2014;112(5):841-51. DOI:10.1017/S0007114514001548 [ Links ]

10. Thompson FE, Byers T. Dietary assessment resource manual. J Nutr 1994;124(11 Suppl):2245s-317s. [ Links ]

11. Peter Herman C, Polivy J, Pliner P, Vartanian LR. Mechanisms underlying the portion-size effect. Physiol Behav 2015;144:129-36. DOI:10.1016/j.physbeh.2015.03.025 [ Links ]

12. Burger KS, Kern M, Coleman KJ. Characteristics of self-selected portion size in young adults. J Am Diet Assoc 2007;107(4):611-8. DOI:10.1016/j.jada.2007.01.006 [ Links ]

13. Dubois S. Accuracy of visual estimates of plate waste in the determination of food consumption. J Am Diet Assoc 1990;90(3):382-7. [ Links ]

14. Gittelsohn J, Shankar AV, Pokhrel RP, West KP, Jr. Accuracy of estimating food intake by observation. J Am Diet Assoc 1994;94(11):1273-7. DOI:10.1016/0002-8223(94)92459-7 [ Links ]

15. Almiron-Roig E, Navas-Carretero S, Emery P, Martinez JA. Research into food portion size:methodological aspects and applications. Food Funct 2018;9(2):715-39. DOI:10.1039/C7FO01430A [ Links ]

16. Faulkner GP, Livingstone MB, Pourshahidi LK, Spence M, Dean M, O'Brien S, et al. An evaluation of portion size estimation aids:precision, ease of use and likelihood of future use. Public Health Nutr 2016;19(13):2377-87. DOI:10.1017/S1368980016000082 [ Links ]

17. Pollard CM, Daly AM, Binns CW. Consumer perceptions of fruit and vegetables serving sizes. Public Health Nutr 2009;12(5):637-43. DOI:10.1017/S1368980008002607 [ Links ]

18. Britten P, Haven J, Davis C. Consumer research for development of educational messages for the MyPyramid Food Guidance System. J Nutr Educ Behav 2006;38(6 Suppl):S108-23. DOI:10.1016/j.jneb.2006.08.006 [ Links ]

19. Lanerolle P, Thoradeniya T, de Silva A. Food models for portion size estimation of Asian foods. J Hum Nutr Diet 2013;26(4):380-6. DOI:10.1111/jhn.12063 [ Links ]

20. Faggiano F, Vineis P, Cravanzola D, Pisani P, Xompero G, Riboli E, et al. Validation of a method for the estimation of food portion size. Epidemiology. 1992;3(4):379-82. DOI:10.1097/00001648-199207000-00015 [ Links ]

21. Yuhas JA, Bolland JE, Bolland TW. The impact of training, food type, gender, and container size on the estimation of food portion sizes. J Am Diet Assoc 1989;89(10):1473-7. [ Links ]

22. Subar AF, Crafts J, Zimmerman TP, Wilson M, Mittl B, Islam NG, et al. Assessment of the accuracy of portion size reports using computer-based food photographs aids in the development of an automated self-administered 24-hour recall. J Am Diet Assoc 2010;110(1):55-64. DOI:10.1016/j.jada.2009.10.007 [ Links ]

23. Boushey CJ, Spoden M, Zhu FM, Delp EJ, Kerr DA. New mobile methods for dietary assessment:review of image-assisted and image-based dietary assessment methods. Proc Nutr Soc 2017;76(3):283-94. DOI:10.1017/S0029665116002913 [ Links ]

24. Haraldsdottir J, Tjonneland A, Overvad K. Validity of individual portion size estimates in a food frequency questionnaire. Int J Epidemiol 1994;23(4):786-96. DOI:10.1093/ije/23.4.787 [ Links ]

25. Japur CC, Diez-Garcia RW. Food energy content influences food portion size estimation by nutrition students. J Hum Nutr Diet 2010;23(3):272-6. DOI:10.1111/j.1365-277X.2010.01042.x [ Links ]

26. Slawson DL, Eck LH. Intense practice enhances accuracy of portion size estimation of amorphous foods. J Am Diet Assoc 1997;97(3):295-7. DOI:10.1016/S0002-8223(97)00076-X [ Links ]

27. Sharp D, Sobal J. Using plate mapping to examine sensitivity to plate size in food portions and meal composition among college students. Appetite 2012;59(3):639-45. DOI:10.1016/j.appet.2012.07.020 [ Links ]

28. Wansink B, Wansink CS. The largest Last Supper:depictions of food portions and plate size increased over the millennium. Int J Obes (Lond) 2010;34(5):943-4. DOI:10.1038/ijo.2010.37 [ Links ]

29. Wansink B, Cheney MM. Super Bowls:serving bowl size and food consumption. JAMA 2005;293:1727-8. DOI:10.1001/jama.293.14.1727 [ Links ]

30. Szenczi-Cseh J, Horvath Z, Ambrus A. Validation of a food quantification picture book and portion sizes estimation applying perception and memory methods. Int J Food Sci Nutr 2017;68(8):960-72. DOI:10.1080/09637486.2017.1309521 [ Links ]

31. Baranowski T, Baranowski JC, Watson KB, Martin S, Beltran A, Islam N, et al. Children's accuracy of portion size estimation using digital food images:effects of interface design and size of image on computer screen. Public Health Nutr 2011;14(3):418-25. DOI:10.1017/S1368980010002193 [ Links ]

32. Bryant R, Dundes L. Portion Distortion:A Study of College Students. The Journal of Consumer Affairs 2005;39(2):399-408. DOI:10.1111/j.1745-6606.2005.00021.x [ Links ]

33. Almiron-Roig E, Solis-Trapala I, Dodd J, Jebb SA. Estimating food portions. Influence of unit number, meal type and energy density. Appetite 2013;71:95-103. DOI:10.1016/j.appet.2013.07.012 [ Links ]

34. Wrieden W, Gregor A, Barton KL. Have food portion sizes increased in the UK over the last 20 years?Proceedings of The Nutrition Society 2008;67(OCE):E211. DOI:10.1017/S0029665108008434 [ Links ]

35. Kral TV, Roe LS, Rolls BJ. Combined effects of energy density and portion size on energy intake in women. Am J Clin Nutr 2004;79(6):962-8. DOI:10.1093/ajcn/79.6.962 [ Links ]

36. Rolls BJ, Morris EL, Roe LS. Portion size of food affects energy intake in normal-weight and overweight men and women. Am J Clin Nutr 2002;76(6):1207-13. DOI:10.1093/ajcn/76.6.1207 [ Links ]

37. Rolls BJ, Roe LS, Meengs JS. Larger portion sizes lead to a sustained increase in energy intake over 2 days. J Am Diet Assoc 2006;106(4):543-9. DOI:10.1016/j.jada.2006.01.014 [ Links ]

38. Piernas C, Popkin BM. Increased portion sizes from energy-dense foods affect total energy intake at eating occasions in US children and adolescents: patterns and trends by age group and sociodemographic characteristics, 1977–2006. Am J Clin Nutr 2011;94(5):1324-32. DOI: 10.3945/ajcn.110.008466 [ Links ]

39. Fisher JO, Liu Y, Birch LL, Rolls BJ. Effects of portion size and energy density on young children's intake at a meal. Am J Clin Nutr 2007;86(1):174-9. DOI:10.1093/ajcn/86.1.174 [ Links ]

40. Orlet Fisher J, Rolls BJ, Birch LL. Children's bite size and intake of an entree are greater with large portions than with age-appropriate or self-selected portions. Am J Clin Nutr 2003;77(5):1164-70. DOI:10.1093/ajcn/77.5.1164 [ Links ]

41. Rolls BJ, Engell D, Birch LL. Serving portion size influences 5-year-old but not 3-year-old children's food intakes. J Am Diet Assoc 2000;100(2):232-4. DOI:10.1016/S0002-8223(00)00070-5 [ Links ]

42. Fisher JO, Arreola A, Birch LL, Rolls BJ. Portion size effects on daily energy intake in low-income Hispanic and African American children and their mothers. Am J Clin Nutr 2007;86(6):1709-16. DOI:10.1093/ajcn/86.5.1709 [ Links ]

43. Ello-Martin JA, Ledikwe JH, Rolls BJ. The influence of food portion size and energy density on energy intake:implications for weight management. Am J Clin Nutr 2005;82(1 Suppl):236s-41s. DOI:10.1093/ajcn/82.1.236S [ Links ]

44. Rolls BJ, Roe LS, Kral TV, Meengs JS, Wall DE. Increasing the portion size of a packaged snack increases energy intake in men and women. Appetite 2004;42(1):63-9. DOI:10.1016/S0195-6663(03)00117-X [ Links ]

45. Flood JE, Roe LS, Rolls BJ. The effect of increased beverage portion size on energy intake at a meal. J Am Diet Assoc 2006;106(12):1984-90. DOI:10.1016/j.jada.2006.09.005 [ Links ]

46. Diliberti N, Bordi PL, Conklin MT, Roe LS, Rolls BJ. Increased portion size leads to increased energy intake in a restaurant meal. Obes Res 2004;12(3):562-8. DOI:10.1038/oby.2004.64 [ Links ]

47. Geier AB, Rozin P, Doros G. Unit bias. A new heuristic that helps explain the effect of portion size on food intake. Psychol Sci 2006;17(6):521-5. DOI:10.1111/j.1467-9280.2006.01738.x [ Links ]

48. Wansink B, Kim J. Bad popcorn in big buckets:portion size can influence intake as much as taste. J Nutr Educ Behav 2005;37(5):242-5. DOI:10.1016/s1499-4046(06)60278-9 [ Links ]

49. Wansink B, Painter JE, North J. Bottomless bowls:why visual cues of portion size may influence intake. Obes Res 2005;13(1):93-100. DOI:10.1038/oby.2005.12 [ Links ]

50. Elmquist JK, Coppari R, Balthasar N, Ichinose M, Lowell BB. Identifying hypothalamic pathways controlling food intake, body weight, and glucose homeostasis. J Comp Neurol 2005;493(1):63-71. DOI:10.1002/cne.20786 [ Links ]

51. Cardi V, Leppanen J, Treasure J. The effects of negative and positive mood induction on eating behaviour:A meta-analysis of laboratory studies in the healthy population and eating and weight disorders. Neurosci Biobehav Rev 2015;57:299-309. DOI:10.1016/j.neubiorev.2015.08.011 [ Links ]

52. Zheng H, Lenard NR, Shin AC, Berthoud HR. Appetite control and energy balance regulation in the modern world:reward-driven brain overrides repletion signals. Int J Obes (Lond) 2009;33(Suppl 2):S8-13. DOI:10.1038/ijo.2009.65 [ Links ]

53. Adam TC, Epel ES. Stress, eating and the reward system. Physiol Behav 2007;91(4):449-58. DOI:10.1016/j.physbeh.2007.04.011 [ Links ]

54. Macht M. How emotions affect eating:a five-way model. Appetite 2008;50(1):1-11. DOI:10.1016/j.appet.2007.07.002 [ Links ]

55. Michels N, Sioen I, Braet C, Eiben G, Hebestreit A, Huybrechts I, et al. Stress, Emotional Eating Behaviour and Dietary Patterns in Children. Appetite 2012;59(3). DOI:10.1016/j.appet.2012.08.010 [ Links ]

56. Jeffery RW, Rydell S, Dunn CL, Harnack LJ, Levine AS, Pentel PR, et al. Effects of portion size on chronic energy intake. Int J Behav Nutr Phys Act 2007;4:27. DOI:10.1186/1479-5868-4-27 [ Links ]

57. Rippin HL, Hutchinson J, Jewell J, Breda JJ, Cade JE. Portion Size of Energy-Dense Foods among French and UK Adults by BMI Status. Nutrients 2018;11(1). DOI:10.3390/nu11010012 [ Links ]

58. Kelly MT, Wallace JM, Robson PJ, Rennie KL, Welch RW, Hannon-Fletcher MP, et al. Increased portion size leads to a sustained increase in energy intake over 4 d in normal-weight and overweight men and women. Br J Nutr 2009;102(3):470-7. DOI:10.1017/S0007114508201960 [ Links ]

59. Heymsfield SB, van Mierlo CA, van der Knaap HC, Heo M, Frier HI. Weight management using a meal replacement strategy:meta and pooling analysis from six studies. Int J Obes Relat Metab Disord 2003;27(5):537-49. DOI:10.1038/sj.ijo.0802258 [ Links ]

60. Fisher JO, Birch LL. Eating in the absence of hunger and overweight in girls from 5 to 7 y of age. Am J Clin Nutr 2002;76(1):226-31. DOI:10.1093/ajcn/76.1.226 [ Links ]

61. McConahy KL, Smiciklas-Wright H, Birch LL, Mitchell DC, Picciano MF. Food portions are positively related to energy intake and body weight in early childhood. J Pediatr 2002;140(3):340-7. DOI:10.1067/mpd.2002.122467 [ Links ]

62. Wansink B, Payne CR, Shimizu M. The 100-calorie semi-solution:sub-packaging most reduces intake among the heaviest. Obesity (Silver Spring) 2011;19(5):1098-100. DOI:10.1038/oby.2010.306 [ Links ]

63. Huang TT, Howarth NC, Lin BH, Roberts SB, McCrory MA. Energy intake and meal portions:associations with BMI percentile in U.S. children. Obes Res 2004;12(11):1875-85. DOI:10.1038/oby.2004.233 [ Links ]

64. Lioret S, Volatier JL, Lafay L, Touvier M, Maire B. Is food portion size a risk factor of childhood overweight?Eur J Clin Nutr 2009;63(3):382-91. DOI:10.1038/sj.ejcn.1602958 [ Links ]

65. Jenkins DJ, Wolever TM, Taylor RH, Barker H, Fielden H, Baldwin JM, et al. Glycemic Index of Foods:A Physiological Basis for Carbohydrate Exchange. The American journal of clinical nutrition 1981;34(3). DOI:10.1093/ajcn/34.3.362 [ Links ]

66. Wolever TM, Jenkins DJ, Jenkins AL, Josse RG. The Glycemic Index:Methodology and Clinical Implications. The American journal of clinical nutrition 1991;54(5). DOI:10.1093/ajcn/54.5.846 [ Links ]

67. Berra B, Rizzo AM. Glycemic Index, Glycemic Load, Wellness and Beauty:The State of the Art. Clinics in dermatology 2009;27(2). DOI:10.1016/j.clindermatol.2008.04.006 [ Links ]

68. Freedman DS, Dietz WH, Srinivasan SR, Berenson GS. The Relation of Overweight to Cardiovascular Risk Factors Among Children and Adolescents:The Bogalusa Heart Study. Pediatrics 1999;103(6 Pt 1):1175-82. DOI:10.1542/peds.103.6.1175 [ Links ]

69. Ford ES, Galuska DA, Gillespie C, Will JC, Giles WH, Dietz WH. C-reactive protein and body mass index in children:findings from the Third National Health and Nutrition Examination Survey, 1988-1994. J Pediatr 2001;138(4):486-92. DOI:10.1067/mpd.2001.112898 [ Links ]

70. Ferguson MA, Gutin B, Owens S, Litaker M, Tracy RP, Allison J. Fat distribution and hemostatic measures in obese children. Am J Clin Nutr 1998;67(6):1136-40. DOI:10.1093/ajcn/67.6.1136 [ Links ]

71. Olza J, Gil-Campos M, Leis R, Bueno G, Aguilera CM, Valle M, et al. Presence of the Metabolic Syndrome in Obese Children at Prepubertal Age. Annals of nutrition &metabolism 2011;58(4). DOI:10.1159/000331996 [ Links ]

72. Weiss R, Dziura J, Burgert TS, Tamborlane WV, Taksali SE, Yeckel CW, et al. Obesity and the Metabolic Syndrome in Children and Adolescents. N Engl J Med 2004;350(23):2362-74. DOI:10.1056/NEJMoa031049 [ Links ]

73. Cruz ML, Weigensberg MJ, Huang TT, Ball G, Shaibi GQ, Goran MI. The metabolic syndrome in overweight Hispanic youth and the role of insulin sensitivity. J Clin Endocrinol Metab 2004;89(1):108-13. DOI:10.1210/jc.2003-031188 [ Links ]

74. Williams DE, Prevost AT, Whichelow MJ, Cox BD, Day NE, Wareham NJ. A cross-sectional study of dietary patterns with glucose intolerance and other features of the metabolic syndrome. Br J Nutr 2000;83(3):257-66. DOI:10.1017/s0007114500000337 [ Links ]

75. Pereira MA, Jacobs DR, Jr., Van Horn L, Slattery ML, Kartashov AI, Ludwig DS. Dairy consumption, obesity, and the insulin resistance syndrome in young adults:the CARDIA Study. JAMA 2002;287(16):2081-9. DOI:10.1001/jama.287.16.2081 [ Links ]

Received: April 08, 2020; Accepted: June 02, 2020

Correspondence: Esther M. González-Gil. Department of Biochemistry and Molecular Biology II. Instituto de Nutrición y Tecnología de los Alimentos. Centro de Investigación Biomédica (CIBM). Universidad de Granada. Av. del Conocimiento, s/n. 18016 Granada, Spain e-mail: esthergg@ugr.es

Conflicts of interest:

the authors declare none.

Creative Commons License This is an open-access article distributed under the terms of the Creative Commons Attribution License