


 Serviços customizados
 Inglês (pdf)
 Artigo em XML
 Referências do artigo
 Enviar este artigo por email
 Citado por SciELO
  Citado por Google
  Similares em
SciELO
Similares em
SciELO  Similares em Google
 Permalink
INTRODUCTION
The epidemic of obesity has been termed “globesity” to underline the global nature of the problem. Many studies have demonstrated that lifestyle modifications with a low-calorie diet can produce weight loss and a secondary improvement of many of the components of the metabolic syndrome, including insulin resistance (1). Moreover, the variables responsible for reduced insulin resistance as produced by weight loss are relatively unclear. One molecular factor may be adiponectin, an anti-inflammatory adipocytokine and insulin sensitizing factor produced primarily in fat tissue. Adipose tissue is a key endocrine organ secreting several adipokines involved in the regulation of metabolism and energy homeostasis. Adiponectin is the most quantitatively abundant adipokine secreted by adipocytes. The functions of adiponectin in lipid and glucose metabolism (2) confer protection against obesity, and adiponectin concentrations are reduced in obese subjects.
Plasma levels of adiponectin are lower in obese subjects, and these low levels have been related to insulin resistance. These plasma adiponectin levels have a strong genetic component, with heritability estimated at 70-80 % (3). This adipokine is encoded by the adiponectin C1Q and collagen domain containing (ADIPOQ) gene, which is located on chromosome 3q27, in a locus where some single-nucleotide polymorphisms (SNPs) have been reported (4). The most common SNP of this gene is rs266729 (-11,377C>G), located in the proximal promoter region of the ADIPOQ gene; it functionally regulates adiponectin promoter activity and adiponectin levels (5). This ADIPOQ polymorphism has been related to high body mass index and insulin resistance in some populations (6-8).
Interestingly, this genetic variant has been associated with dietary intake (9,10), and there are nutritional intervention works, too. For example, in an important intervention trial such as the Finnish Diabetes Prevention Study, investigators reported that the SNP rs266729 promotes variation in body weight and serum adiponectin concentrations (2). In other short-term studies (3 months) (10-12) this genetic variant (rs266729) was associated with changes in adiponectin levels, insulin resistance, and lipid profile. The relationship of this SNP with other therapeutic interventions in obese subjects has been evaluated, including bariatric surgery techniques (13,14) and sibutramine (15). These studies have shown different results depending on the weight loss and duration of the intervention, but they all had a common characteristic, which was a limited reduction of 500 calories in intake, reaching averages of 1,500 calories a day of intake and for a short period. Perhaps, the use of a more restrictive hypocaloric diet for a longer time may offer different results.
In the present study we evaluate the effect of polymorphism rs266729 of ADIPOQ gene on biochemical changes and weight loss after a high-protein/low-carbohydrate diet vs a standard severe hypocaloric diet during 9 months.
SUBJECTS AND METHODS
SUBJECTS AND CLINICAL INVESTIGATIONS
The study subjects were selected from obese patients seeking treatment at primary care clinics in our Health Area. These subjects were randomized in a clinical trial with two different hypocaloric diets. Our Ethics Committee (HCUVA Committee 06/2017) approved the study, which was in accordance with the guidelines laid down in the Declaration of Helsinki. All participants provided their written informed consent. Clinical and biochemical variables were recorded at the beginning and after 3 and 9 months of dietary intervention. All recruited patients fulfilled the next inclusion criteria: age between 25 and 65 years, and obesity category as body mass index (BMI) ≥ 30 kg/m2. Exclusion criteria included any of the following: history of heart attack, ictus, severe renal or hepatic disorders, active alcoholism, malignant tumor, and taking any medications or nutrient supplements within the previous 6 months.
The primary endpoint of our study was body weight loss after 9 months versus baseline. Secondary endpoints included changes in insulin resistance and serum adiponectin after 9 months. Lipid profile (total cholesterol, LDL-cholesterol and HDL-cholesterol, triglycerides), and C-reactive protein (CRP), insulin, and adipokines (leptin, total adiponectin, and resistin) levels were analyzed. Finally, anthropometric variables (body weight, height, body mass index (BMI), waist circumference, and fat mass by bioimpedance) were determined. Blood pressure was assessed, too. All clinical and biochemical parameters were recorded at baseline and after 3 and 9 months of both interventions. The genetic variant rs266729 of ADIPOQ gene was assessed by real-time polymerase chain reaction.
DIETARY INTERVENTION
After these 269 subjects had met the above criteria, they were randomized to one of two hypocaloric diets for a period of 9 months. Diet HP (n = 136) (high-protein/low-carbohydrate hypocaloric diet) consisted of 1,050 cal/day, 33 % of carbohydrates (86.1 g/day), 33 % of fat (39.0 g/day), and 34 % of proteins (88.6 g/day). Lipid percentages were: 63.8 % of monounsaturated fats, 23.6 % of saturated fat, and 12.6 % of polyunsaturated fats. Diet S (n = 133) (standard protein severe hypocaloric diet) had 1,093 cal/day, 53 % carbohydrates (144.3 g/day), 27 % fat (32.6 g), and 20 % protein (55.6 g/day). The distribution of fats in this second diet was: 67.4 % of monounsaturated fats, 20.9 % of saturated fats, and 11.6 % of polyunsaturated fats. To improve compliance with both diets, completion of the dietary intervention was recorded each 7 days via a phone call. Records of daily dietary intake for 3 days were evaluated with a computer-based data evaluation system (Dietosource®, Gen, Sw) and national composition food tables were used as reference (16). Physical activity recommendations included aerobic exercise at least 3 times a week (45 min each). The exercises recommended by the protocol were: running, walking, cycling, and swimming. Patients used a self-reported questionnaire to record their exercise activity.
BIOCHEMICAL AND ADIPOKINE ASSAYS
Blood samples for the analysis of parameters were drawn after a minimum of 8 h overnight, and serum was stored at -40 °C until analyzed. Glucose was measured by a glucose oxidase method using the Glucose Analyser 2 (Beckman Instruments, Fullerton, CA, USA). Insulin was determined by radioimmunoanalysis (RIA) (RIA Diagnostic Corporation, Los Angeles, CA, USA) with a sensitivity of 0.5 mIU/L (normal range: 0.5-30 mIU/L) (17), and the homeostasis model assessment for insulin resistance (HOMA-IR) was calculated using these values with the following equation: HOMA-IR = (glucose x insulin / 22.5) (18). Fasting serum concentrations of total cholesterol and triglycerides were determined using commercially available kits on a Hitachi 7150 Autoanalyzer (Hitachi Ltd, Tokyo, Japan). After precipitation of LDL-cholesterol, chylomicron and very low-density lipoproteins (VLDL) with dextran sulphate-magnesium, HDL-cholesterol was determined enzymatically in the supernatant. LDL-cholesterol was calculated using Friedewald's formula (19).
All serum adipokines were measured using enzyme-linked immunosorbent assay (ELISA). Resistin was determined by ELISA (Biovendor Laboratory, Inc., Brno, Czech Republic) with a sensitivity of 0.2 ng/mL, and with a normal range of 4-12 ng/mL (20). Leptin was determined by ELISA (Diagnostic Systems Laboratories, Inc., Texas, USA) with a sensitivity of 0.05 ng/mL and a normal range of 10-100 ng/mL (21). Adiponectin was determined by ELISA (R&D systems, Inc., Minneapolis, USA) with a sensitivity of 0.246 ng/mL and a normal range of 8.65-21.43 ng/mL (22).
ADIPOQ GENE GENOTYPING
Genomic DNA was extracted from 5 mL of whole blood using a commercially available DNA blood kit (QIAamp®, Madisson, WI, USA) following the manufacturer´s instructions. Oligonucleotide primers and probes were designed with the Beacon Designer 5.0 (Premier Biosoft International®, LA, CA, USA). The polymerase chain reaction (PCR) was carried out with 75 ng of genomic DNA, 0.5 µL of each oligonucleotide primer (primer forward: 5'-ACGTTGGATGATGTGTGGCTTGCAAGAACC-3', and reverse: 5'-ACGTTGGATGCAACATTCAACACCTTGGAC-3') in a 2-µL final volume (termociclador Life Technologies, LA, CA, USA). DNA was denatured at 90 °C for 2 min; this was followed by 50 cycles of denaturation at 90 °C for 20 sec, and annealing at 56.1 °C for 50 sec). The PCR was run in a 25-µL final volume containing 10.5 µL of IQTM Supermix (Bio-Rad®, Hercules, CA, USA) with hot-start Taq DNA polymerase. We used internal controls and accuracy, as assessed by the inclusion of duplicates in the arrays. Hardy-Weinberg equilibrium was assessed with a statistical test (Chi-squared) to compare our expected and observed counts. The variant was in Hardy-Weinberg equilibrium (p = 0.28).
ANTHROPOMETRIC PARAMETERS AND BLOOD PRESSURE
Body height was determined using a standing stadiometer with a precision of 1 mm (Omrom, LA, CA, USA). Body weight was determined in the morning with the subjects minimally dressed, without shoes, to the nearest 0.1 kg (Omrom, LA, CA, USA). Body mass index (BMI) was calculated as body weight (in kg) divided by height (in m2). Waist circumference (WC) was measured with a flexible non-stretchable measuring tape (Type SECA, SECA. Birmingham, UK). Bio impedance was used to determine body composition with an accuracy of 5 g (23) (EFG, Akern, Italy). Blood pressure was determined three times after a 5 minutes rest with a sphygmomanometer (Omrom, Los Angeles, CA, USA), and averaged.
STATISTICAL ANALYSIS
We used the SPSS for Windows, version 19.0, software package (SPSS Inc. Chicago, IL, USA) for all statistical analyses. Sample size was calculated to detect changes over 5 kg in body weight with 90 % power and 5 % significance (n = 130 in each dietary group). Results are expressed as mean ± SD. Each variable was examined for normality with the Kolgomorov-Smirnov test. Parameters with normal distribution were analyzed with a two-tailed Student's t-test. Non-parametric parameters were analyzed with the Mann-Whitney U-test. Categorical variables were analyzed with the Chi-squared test, with Yates' correction as necessary, and Fisher's test. The statistical analysis to evaluate the gene-diet interaction was a univariate ANCOVA for gender and baseline weight. A correction for multiple hypothesis testing for single SNP analyses was performed. A Chi-squared test was used to evaluate the Hardy-Weinberg equilibrium. All analyses were performed under a dominant genetic model with rs266729 G-allele as risk allele (GG + GC vs CC). A p-value < 0.05 was considered significant.
RESULTS
Two hundred and sixty-nine obese subjects were enrolled in the study (152 CC (56.5 %), 107 CG (39.8 %), and 10 GG (3.7 %)). All patients completed the 9-month follow-up period without dropouts. The mean age of the total group was 50.2 ± 7.2 years (range: 28-66), and mean BMI was 37.3 ± 4.3 kg/m2 (range: 31.6-40.9). Sex distribution was 199 women (74.0 %) and 70 men (26.0 %). Age was similar in both genotype groups (wild type (CC) vs mutant type (CG + GG): 51.4 ± 6.2 years vs 49.1 ± 5.9 years: ns). Sex distribution was similar in both genotype groups: males 27.9 % vs 24.1 %, and females 72.1 % vs 75.9 %.
The first group of 136 obese patients (81 CC genotype and 55 G-allele carriers) received caloric restriction with diet HP. In this patient group baseline calorie intake was 1876.4 ± 211.8 kcal/day, with the following distribution of macronutrients: fat intake of 87.1 ± 12.9 g/day (39.9 % of calories), carbohydrate intake of 207.1 ± 18.4 g/day (40.8 % of calories), and protein intake of 77.8 ± 39.2 g/day (19.3 % of calories). During the 9 months of intervention this group attained the objectives of the dietary intervention. Physical exercise was similar in both genotype groups (59.8 ± 19.2 min/week vs 60.9 ± 14.3 min/week; p = 0.38). The second group of 133 obese patients (71 CC genotype and 62 G-allele carriers) received diet S. In this second group, baseline calorie intake was 1853.2 ± 227.2 kcal/day, with the following percentages of nutrients: fat intake of 92.2 ± 11.3 g/day (40.1 % of calories), carbohydrate intake of 200.2 ± 21.0 g/day (40.2 % of calories), and protein intake of 87.0 ± 6.2 g/day (19.7 % of calories). Finally, physical activity was similar in both genotype groups (62.1 ± 13.1 min/week vs 61.9 ± 10.3 min/week; p = 0.37).
As reported in table I, there were no significant genotype-related differences (at baseline and after dietary intervention) in blood pressure or anthropometric parameters. After both caloric restriction strategies with diet HP vs diet S, all anthropometric parameters and systolic blood pressure decreased in a statistical significant way. As shown below, obese patients with both genotypes (CC vs CG + GG) after diet HP reported similar decreases in the following parameters at 9 months: body weight (-6.8 ± 1.2 kg vs -7.1 ± 1.7 kg; p = 0.21), BMI (-3.4 ± 0.2 kg/m2 vs -3.3 ± 0.4 kg/m2; p = 0.29), fat mass (-5.1 ± 1.2 kg vs -5.2 ± 1.0 kg; p = 0.49), waist circumference (-9.1 ± 0.8 cm vs -9.7 ± 0.3 cm; p = 0.23), and systolic blood pressure (-5.1 ± 2.1 mmHg vs -5.0 ± 1.2 mmHg; p = 0.26). After caloric restriction with the second dietary strategy (diet S), both genotype groups (CC vs CG + GG) showed also similar improvements: body weight (-6.8 ± 1.2 kg vs -6.5 ± 1.2 kg; p = 0.31), BMI (-3.4 ± 0.3 kg/m2 vs -3.4 ± 0.2 kg/m2; p = 0.32), fat mass (-5.3 ± 1.2 kg vs -5.5 ± 1.1 kg; p = 0.28), waist circumference (-8.4 ± 1.9 cm vs -9.1 ± 1.4 cm; p = 0.23), and systolic blood pressure (-5.1 ± 2.2 mmHg vs -6.3 ± 2.1 mmHg; p = 0.33).
Table I. Changes in anthropometric parameters for rs266729 (mean ± SD)
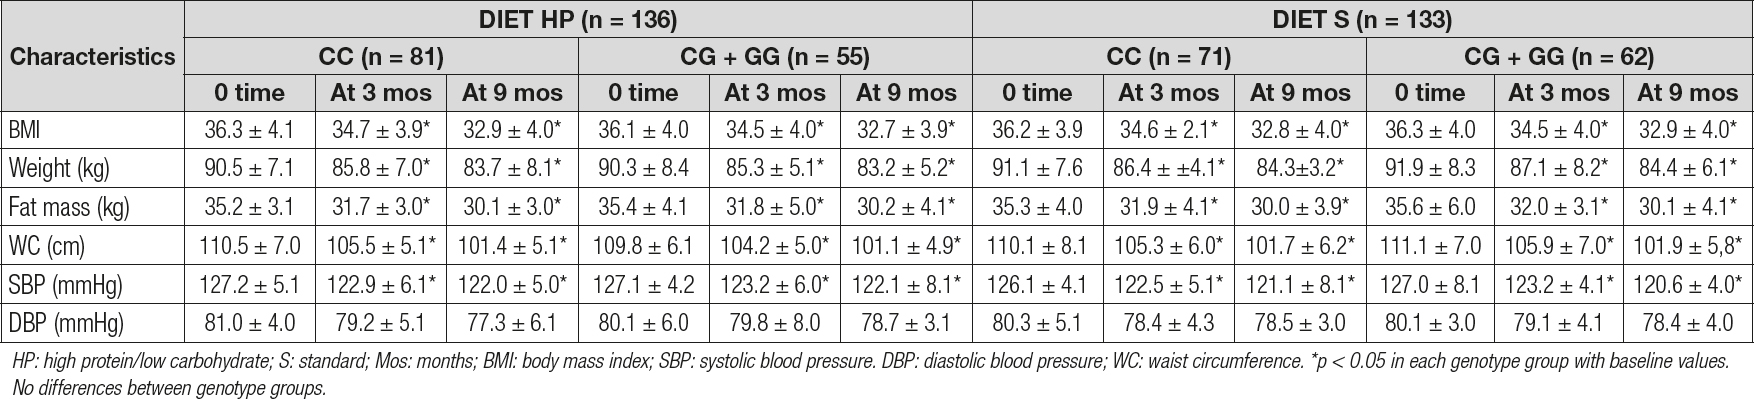
HP: high protein/low carbohydrate; S: standard; Mos: months; BMI: body mass index; SBP: systolic blood pressure. DBP: diastolic blood pressure; WC: waist circumference. *p < 0.05 in each genotype group with baseline values. No differences between genotype groups.
Table II reports the biochemical parameters. After the dietary intervention with a high-protein hypocaloric diet (diet HP), only subjects with the CC genotype showed a significant improvement in cholesterol (14.4 ± 1.8 md/dL vs -5.0 ± 1.9 mg/dL; p = 0.02), LDL-cholesterol (14.4 ± 1.9 mg/dL vs -5.1 ± 1.8 mg/dL; p = 0.01), insulin (-4.1 ± 0.3 mU/L vs -2.0 ± 0.6 mU/L; p = 0.02) and HOMA-IR (-1.4 ± 0.2 units vs -0.5 ± 0.3 units; p = 0.02) levels. After the second dietary strategy with a standard hypocaloric diet (diet S), only subjects with the CC genotype showed a significant improvement in total cholesterol (CC vs CG + GG) (-17.1 ± 1.9 mg/dL vs -5.3 ± 1.3 mg/dL; p = 0.02), LDL-cholesterol (-12.3 ± 1.9 mg/dL vs -8.0 ± 1.2 mg/dL; p = 0.01), insulin (-4.0 ± 0.9 mU/L vs -1.3 ± 0.5 mU/L; p = 0.02) and HOMA-IR (-1.2 ± 0.1 units vs -0.6 ± 0.2 units; p = 0.02) levels. Finally, the improvements observed in the above-mentioned parameters were similar with both hypocaloric diets.
Table IIy. Biochemical parameters for rs266729 (mean ± SD)
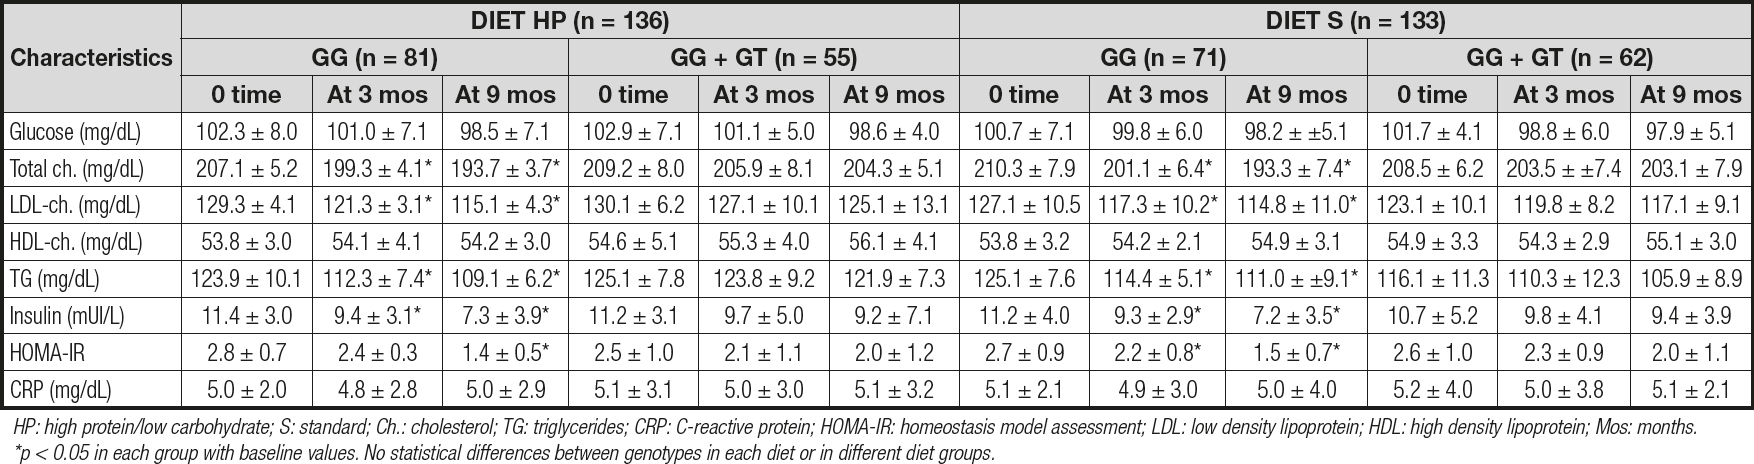
HP: high protein/low carbohydrate; S: standard; Ch.: cholesterol; TG: triglycerides; CRP: C-reactive protein; HOMA-IR: homeostasis model assessment; LDL: low density lipoprotein; HDL: high density lipoprotein; Mos: months. *p < 0.05 in each group with baseline values. No statistical differences between genotypes in each diet or in different diet groups.
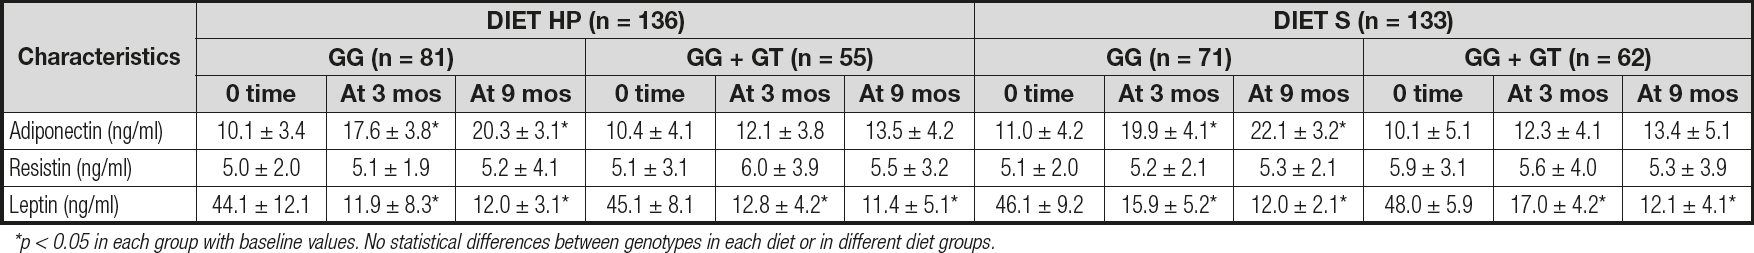
Table III reports the levels of adipokines. No differences were detected between baseline and post-treatment serum adipokine levels between both genotypes. Only subjects with the CC genotype showed a significant increase in adiponectin levels after both diets (CC vs CG + GG): diet HP: 10.2 ± 1.4 ng/dL vs 3.1 ± 1.1 ng/dL; p = 0.01; and diet S: 11.1 ± 2.7 ng/dL vs 3.3 ± 1.2 ng/dL; p = 0.02). After both diets, leptin levels decreased in both groups to a similar degree (Table III).
DISCUSSION
Ours is the first study to date that has examined whether the ADIPOQ variant rs266729 is related with weight reduction and metabolic changes after a hyperproteic hypocaloric diet for an intermediate duration of 9 months. Non-G-allele carriers showed a better response of HOMA-IR, insulin, LDL-cholesterol, and adiponectin levels than G-allele carriers after both diets, with the same amount of weight loss.
The relationship between this polymorphism (rs266729) and the presence of glucose metabolism disorders such as diabetes mellitus type 2 seems to be well established (24,25).
As was mentioned above, there are multiple interventional designs in the literature, with some studies considering non-surgical interventions (8-12), and other studies being performed after bariatric surgery (13,14,26). The data obtained are heterogeneous, and perhaps the distribution of dietary macronutrients and the intervention's duration are two variables of interest.
In our work, it is clear that this genetic variant does not affect the amount of weight loss, except for the caloric restriction reached during the 9 months. Only one study has showed this interaction between rs266729 and weight loss (15), but after a drug intervention with sibutramine. Hsiao et al (15) showed a significantly greater weight loss for ADIPOQ rs266729 CC genotype as compared to the placebo group during a short-term interventional study for 3 months. Probably, the genetic background of the sample of patients in the previous study (Asians) is very different from that in our design (all were Caucasian), and this may explain the effects on weight, in addition to a possible interaction of sibutramine with the genetic variant itself.
Regarding the longest nutritional intervention study (4 years), it was carried out to analyze the Finnish Diabetes Prevention Program (FDPP) (9). This interventional study was a randomized, controlled, multicenter study with a dietary intervention of reduction in calorie intake from fat < 30 %, and increase in dietary fiber to at least 15 g per 1000 kcal. The authors reported that obese subjects with the G allele had a higher weight after 4 years of follow-up, and surprisingly C-allele carriers had an increased risk of developing diabetes mellitus type 2. The effect of this genetic variant on weight loss is the opposite of that found by Hsiao et al (15), and on the other hand, the biological plausibility of an increase in the prevalence of type-2 diabetes mellitus in the group that loses the most weight requires a difficult explanation. The diet used in the FDPP study had a percentage of fat similar to our diet S, but the distribution of unsaturated and polyunsaturated fats was different, and perhaps we found no differences in weight loss because of using different fat components and an intervention for only 9 months. Moreover, in other groups, short-term intervention studies (10-12) with Mediterranean-pattern diets and a macronutrient distribution very similar to diet S (calories from fats under 30 % of the total amount) reported a similar weight loss for both genotypes. In all these studies obese patients with the CC genotype had a greater increase in adiponectin levels and a greater decrease in LDL-cholesterol, total cholesterol, insulin, and HOMA-IR levels when compared to G-allele carriers, as our present data show.
The results reported in interventions with bariatric surgery are not comparable to the above-mentioned ones due to the large loss of weight obtained after the intervention. One study was carried out with a Roux-en-Y gastroenterostomy (13) during 32 months, and subjects with the C allele were more prone to show a reduction in LDL-cholesterol levels (-43 %) than G-allele carriers (-18 %), with a similar weight loss in both genotypes. Moreover, adiponectin levels were not measured. Other studies with gastric banding after 12 months (25) did not show any metabolic effect of the rs266729 variant on lipid profile, glucose metabolism, and adiponectin levels. At last, an interventional study of 36 months with biliopancreatic diversion (14) reported a significant rise in adiponectin concentrations after weight loss in CC subjects, with a greater improvement in lipid profile, insulin levels, and HOMA-IR as compared to G-allele carriers.
As we may see, after dietary and surgical interventions an interaction between metabolic response and this genetic variant develops with similar weight loss. The metabolic pathways to explain these results remain unknown. A potential hypothesis is a direct gene-nutrient interaction, based on the well-known relation of the G allele with a sequence disruption at one transcriptional stimulatory protein binding site, which secondarily reduces adiponectin promoter activity in both brown and white adipose tissues (27,28). Fergusson et al (29) have reported that G-allele carriers were identified as having degrees of insulin resistance, and were highly responsive to differences in plasma saturated fatty acid levels. Perhaps, the amount of dietary caloric restriction, the timing of dietary restriction, the distribution of macronutrients itself in these hypocaloric diets, and the quality of dietary fat could affect the intrinsic activity of the adiponectin gene, and the secondary expression of adiponectin receptors.
The limitations of our study are: recruitment of naïve obese subjects without diabetes mellitus or cardiovascular events, as they represent a small proportion of the general population of obese subjects. Secondly, we only analyzed one genetic variant of the ADIPOQ gene, so other ADIPOQ variants could be related with metabolic parameters. Thirdly, there may be other unknown factors such as, for example, epigenetics, environmental toxics, hormonal diseases, and level of physical activity. Fourth, our findings were obtained in only one ethnic group (Caucasians). Fifth, we evaluated only adult patients; young patients could have other responses (30). Finally, the self-reported dietary intake could entail an under- or over-reporting bias from the patients.
CONCLUSION
In conclusion, non-G-allele carriers showed a better response of LDL-cholesterol, HOMA-IR, insulin, and adiponectin levels when compared to G-allele carriers, with both groups achieving the same level of weight loss with both diets. Perhaps, a previous genetic study of some genetic variants before starting a hypocaloric treatment could be a new strategy to move towards a more personalized medicine in nutritional interventions.

