


 Custom services
 English (pdf)
 Article in xml format
 Article references
 Send this article by e-mail
 Cited by SciELO
  Cited by Google
  Similars in
SciELO
Similars in
SciELO  Similars in Google
 Permalink
INTRODUCTION
The childhood period, especially the ages between 6 and 12 years, is a period characterized by physical, cognitive, and social development. In this period children consolidate their personality, which they acquired during the preschool period or early childhood and will undergo dramatic changes during adolescence (1). These years of childhood represent a physical, cognitive, and social-emotional basis for lifelong health, learning, and well-being, which will prepare them for a healthy adolescence and adulthood. Thus, prevention efforts in early and middle childhood can give rise to lifelong benefits (2,3).
Diet is very important as the imbalance between energy intake and energy expenditure is one of the factors implicated in childhood obesity (4). Many vitamin and mineral deficiencies are reported to be associated with increased BMI (5), as well as with carbohydrates (6), dietary fat (7), and proteins (8).
Dietary assessments as well as collecting accurate dietary information about dietary habits and nutrient intakes are a big challenge in children. It is essential to identify predictors and outcomes of children's diets to determine the targets for developing and evaluating interventions, and for understanding the processes of behavioral change (9). The accuracy of children's self-reports may be scarce due to cognitive factors, as most children have problems with memory or recall of food intake, inability to estimate the portion sizes they eat, and other problems (10,11). Therefore, surrogate reporting by parents, caregivers, or a combination of the above is necessary. Many different methods were developed for dietary assessment such as the 24-hour recall, food records, food frequency questionnaire (FFQ), and diet history (12). FFQs are one of the most appropriate methods that can be used in large-scale epidemiological studies as it is considered a simple, easy to administer tool that is less intrusive and has less respondent burden than other methods. It is relatively inexpensive and does not need highly trained interviewers (12). However, FFQs should be validated for the selected group of population to ensure accuracy in collecting data regarding dietary intake (13). However, due to differences in food types, accessibility, and preferences between populations, developing and validating a FFQ specific for a given population is a prerequisite to use this FFQ to assess diet among said population (14).
Few studies were found to examine the reproducibility and validity of a FFQ to estimate the intake of food groups among children and adolescents in various countries (15,16). Moreover, there are no available studies for developing and validating FFQs to assess the intake of food groups among children and adolescents in the Arab world. Therefore, developing a reliable and valid FFQ to estimate the intake of food groups among children and adolescents in Jordan is essential. The present study aimed to develop and test the reproducibility and relative validity of an FFQ for estimating intakes of food groups among Jordanian children and adolescents.
MATERIALS AND METHODS
STUDY DESIGN AND PARTICIPANT DESCRIPTION
This was a validation study conducted at public and private schools in the Greater Amman area, Jordan, from September 2017 to May 2018. One hundred and thirty-six children and adolescents aged between 6 and 18 years were approached to participate in this validation study. The obtained sample size was in accordance with the sample size recommendations for FFQ validation studies that guidelines suggest, namely 50 to 100 participants per demographic group (17). Twelve schools were randomly selected from the Ministry of Education list of schools in the Greater Amman area; 7 public schools (3 schools from East Amman and 4 schools from West Amman) and 5 private schools (3 schools from East Amman and 2 schools from West Amman). All eligible students from the selected schools were given an invitation letter to participate in this study, which was addressed to their parents. In this letter the objectives of the study, eligibility criteria (inclusion/exclusion) to participate in the study, and the risks and benefits of participating in the study were defined. The eligibility criteria to participate in the study were: being Jordanian; aged between 6 and 18 years at enrollment; healthy and normal body weight children and adolescents (with no medical conditions that require specific dietary recommendations affecting food intake). All participating parents/caregivers provided their written informed consent by signing an informed consent form. Participants above the age of seven were also asked to sign an informed consent form to indicate their approval to participate in this study.
Seventy-two children aged between 6 and 12 years (24 boys and 48 girls) and their parents/caregivers, and 64 adolescents aged between 13 and 18 years (26 boys and 38 girls) were enrolled to complete an interviewer-administered quantitative FFQ. During the initial interview data on parental age, education level, marital status, and occupation, and on the child's/adolescent's age and gender were collected by means of an interviewer-administered questionnaire. Anthropometric measurements of the child/adolescent were obtained using standardized procedures and calibrated equipment. The participants were weighed without shoes using a digital scale (Tanita, Japan) to the nearest 0.1 kg, and height was measured without shoes to the nearest 0.1 cm using a plastic wall-mounted stadiometer (Tanita, Japan). Of 136 children and adolescents, 50 were enrolled in the reproducibility part. This sample size was expected using the methodology recommended by Walter et al. (1998) for approaching the number of participants required for test-retest reliability. Assuming 0.40 to be the minimally acceptable level of reliability, but hypothesizing a reliability of 0.70 with the administration of the questionnaire on two different occasions, a sample size of at least 33 participants was required (p < 0.05; 80 % power) to perform the reliability test (18). To account for attrition between the first and second administration, the sample size target was increased to 50 participants. The FFQ was administered by a trained dietitian at the time of enrollment and one month later to evaluate FFQ reproducibility. The FFQ took 35 to 45 minutes to complete. Four nonconsecutive 24-HRs (three working days and one weekend day) were collected from participants during the duration of the study. The first 24-HR was collected during the first face-to- face interview. The remaining 2 working days and weekend day were collected at three different times over one month. The same trained dietitian carried out all the interviews.
The study protocol was approved by the Institutional Review Board of the Ministry of Education in Jordan (3/10/26579), and carried out according to the ethical standards of the responsible committee on human experimentation and with the Declaration of Helsinki of 1975.
DIETARY ASSESSMENT METHODS
The FFQ
A 120 food item, quantitative paper-and-pencil FFQ form was used to assess the usual intake of energy and of macro and micronutrients over a period of one year. The FFQ was a modified version of a previous Arabic-language FFQ for adults that involved 112 food items (20). The food list was developed based on the results from a pilot study. The pilot study was conducted in 50 children and adolescents aged between 6 and 18 years who were asked to recall their dietary intake during the past 24 hours in order to identify commonly consumed foods and their serving sizes. Those children and adolescents who participated in the pilot study were not included in the validation and reliability study.
The participants in the current study were asked how often, on average, they had consumed each food item over the past year. Each food item in the FFQ had either 10 frequency choices that ranged from “never” during the past year to “≥ 6/day” for a beverage, or nine frequency choices that ranged from “never” during the past year to ≥ 2/day” for food (12,19). The participants were also asked to indicate the portion size in three categories: small, medium, and large. The portion sizes of each food item were defined according to commonly used portions as identified for an earlier Jordanian FFQ (20) including household measures (e.g., cups, tablespoons and teaspoons). For some foods (e.g., fruits, eggs, crackers, pastries, and soft drinks) natural units or typical units (e.g., an apple, an egg, one cracker, a can of soft drink) were used. Food models were used to help participants estimate the consumed portion size of foods that cannot be measured using standard measuring units. The participants were asked to indicate portion size in three levels: small, medium and large. For each classification, a metric amount in grams or milliliters was assigned. Participant responses were converted into average daily intake (in grams for foods or milliliters for beverages) according to the frequency and portion size of a specific food item. Besides, the FFQ provided data on food preparation and cooking methods, and the use of specific types of oil, butter, and margarine.
The 24h-DRs
The formal weekend days are Friday and Saturday, and working days are from Sunday to Thursday in Jordan. In the first face-to-face interview the first 24h-DR was collected, then the second and third 24h-DRs were conducted by phone at a weekday and weekend day, and the fourth after one month in the second face-to-face interview. Paper-based forms that matched the five-stage, multiple-pass interviewing technique were used to collect the 24h-DRs (21). In the first pass, the participant was asked to give a complete overview of all the foods and beverages consumed during the previous day from midnight to midnight. In the second pass, the participant was asked about any forgotten foods, including a checklist of foods and beverages that are often forgotten such as snacks, candy, and added milk and sugar. Then details concerning the time and occasions where each food and beverage were consumed were obtained. The amount and a description of the foods consumed were reported. This included type of product, brand name, cooking technique, amount, and food leftovers. In this step standard measuring tools and food models were used to facilitate estimation of portion size. In the last step the information was summarized and reviewed to ensure that all food items were recorded correctly (21).
ANALYSIS OF FOOD CONSUMPTION DATA
Based on similarities amongst types of food and nutrient compositions, the 120 food items listed in the FFQ were grouped into 25 food groups (Table I). The American food exchange list for weight management was used as a reference to classify food items into food groups (22). The mean daily intake of each food item obtained by the FFQ and the four 24h-DRs was entered in a Microsoft Excel spreadsheet by a trained dietician. The daily intake of each food group was calculated as the sum of all daily intakes of its corresponding food items as mentioned in table I. The estimated intake of food groups was exported from Excel and imported into the Statistical Package for the Social Sciences, version 3, to assess the relative validity and reproducibility of the FFQ.

STATISTICAL ANALYSIS
The statistical analysis was performed using the SPSS version 20.0. The significance level was set at a p-value < 0.05 for all data. Means and standard deviations (SD) were calculated for continuous data. Frequencies and percentages were calculated for categorical data. For the reproducibility of the FFQ, the mean ± SD of each food group intake was calculated for the two FFQs. Intraclass correlation coefficients based on absolute agreement and 2-way mixed-effects model were estimated to test the reproducibility between the two FFQ administrations.
The mean ± SD was calculated for each food group intake obtained from the FFQ-1 and the mean of four 24h-DRs in the validation part. The normality of the distribution of food group intakes was evaluated by the Shapiro-Wilk test. When the variables were not normally distributed, they were log-transformed before the analysis. Pearson's correlations were calculated to assess the strength of the linear association between intake from the FFQ-1 and the 24h-DRs. As most of the food groups were correlated with total energy intake, the energy adjustment method was applied using Willett's residual method (2012), in which residuals are calculated based on a regression model (12). De-attenuated Pearson's correlation coefficients were calculated to account for the effect of random within-person variation in the 24h-DRS, as mentioned by Willett et al. (2012), using the following formula (12):
rde = robs√1 + (Varw / Varb) / n
where rde is the de-attenuated correlation coefficient, robs is the observed correlation coefficient for adjusted energy food group intake, Varw is the within-person variance of the 24h-DRs, Varb is the between-person variance of the 24h-DRs, and n is the number of 24h-DRs per individual. The Varw and Varb values were calculated from simple variance components analysis of the within- and between-person variability of the 24h-DRs. The mean daily intake obtained from 24h-DRs was divided into quartiles and compared with those calculated from the FFQ. Quartile agreement between the two dietary tools was assessed by calculating the percentage of individuals classified into the same, adjacent (same ± 1 quartile), and opposite quartile (misclassification by same ± 2 or 3 quartiles). Furthermore, the analysis proposed by Bland and Altman (1986) was used to graphically examine the agreement between FFQ and mean 24h-DRs. The difference in intake between the two dietary tools was plotted against the mean intake of the two tools - FFQ + mean 24h-DRs) / 2, with the 95 % CI calculated as the limits of agreement, defined as mean difference ± 1.96 x SD (23).
RESULTS
Table II shows the socio-demographic characteristics and anthropometric measurements of the study participants and their parents. Among the 136 children and adolescents who participated in the validation study, 50 were boys and 86 were girls. The mean ages for boys and girls were 11.7 and 12.0 years, respectively. Mean body weights for boys and girls were 42.1 kg and 40.3 kg, respectively; and mean height was around 148 cm for both boys and girls. Most of the girl participants were enrolled from private schools (75.6 %). There were no significant differences between boys and girls on their mother and father socio-demographic characteristics.
Table II. Average daily intakes of energy and macronutrients, Pearson's correlation coefficients, and agreement between the mean of four 24-HRs and FFQ administered to 136 children and adolescents participating in a validation study from September 2017 to May 2018
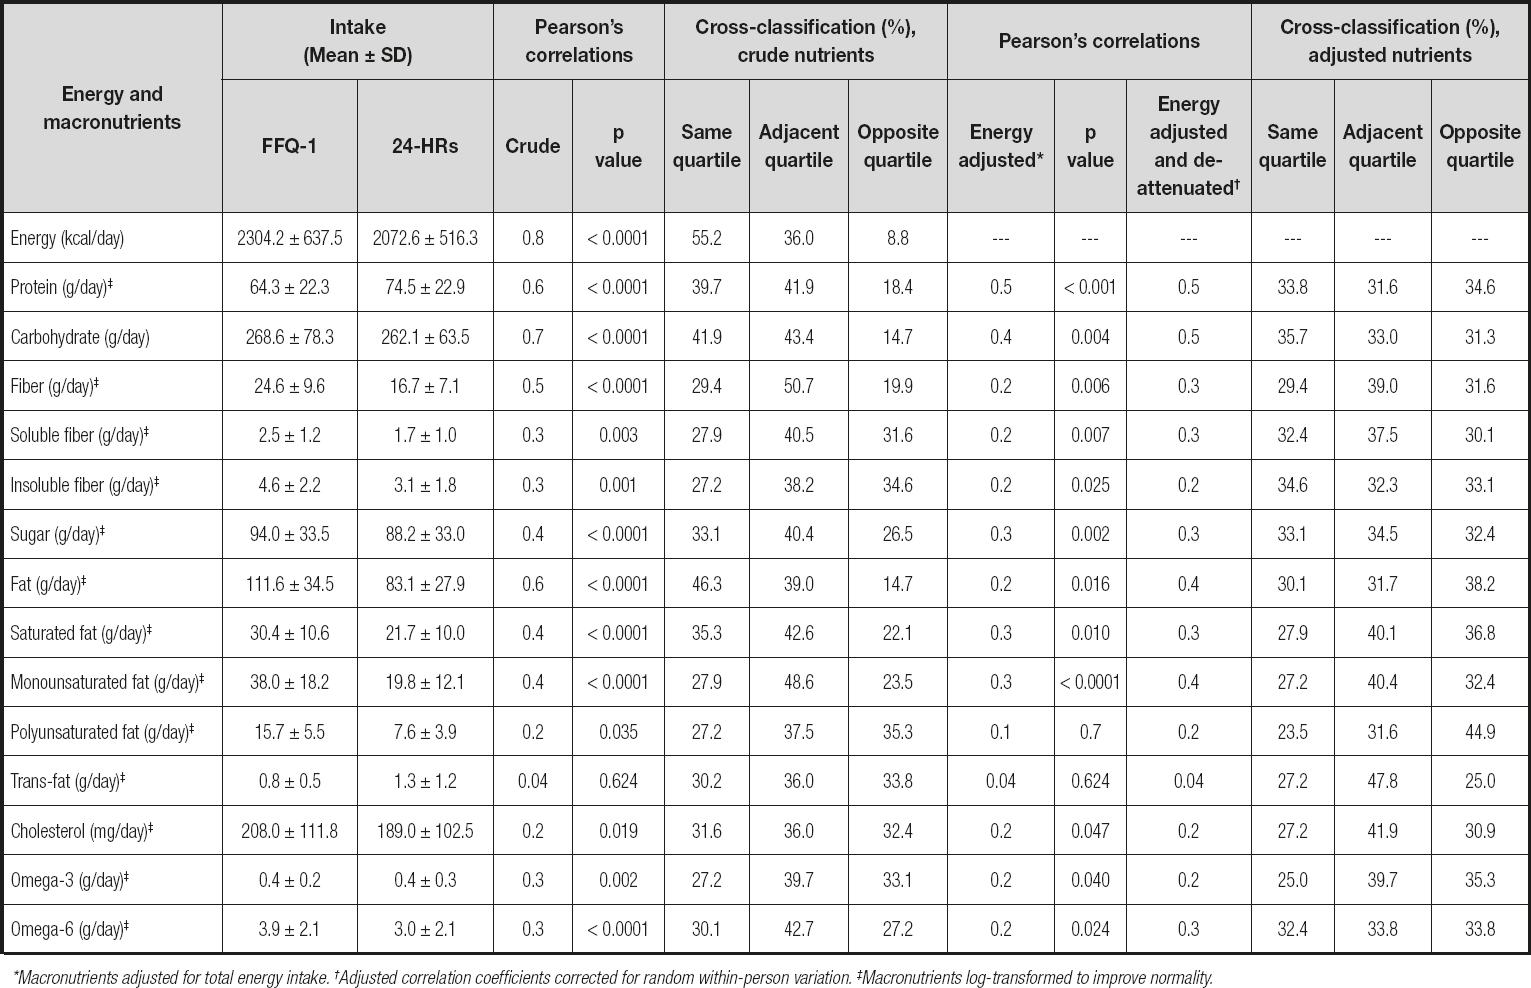
*Macronutrients adjusted for total energy intake. †Adjusted correlation coefficients corrected for random within-person variation. ‡Macronutrients log-transformed to improve normality.
REPRODUCIBILITY OF THE FFQ
The mean daily intake of food groups and intraclass correlation coefficients between the two FFQs administered to 50 Jordanian children and adolescents are given in table III. The mean intake of some food groups was higher when estimated by the FFQ-1 than by the FFQ-2. The intraclass correlation coefficients between the two FFQs ranged from 0.18 for nuts to 0.98 for tea, and all correlations were statistically significant except for nuts. The average of all intraclass correlation coefficients was 0.80.
Table III. Average daily intake of micronutrients. Pearson's correlation coefficients and agreement between the mean of four 24-HRs and FFQ administered to 136 children and adolescents participating in a validation study from September 2017 to May 2018
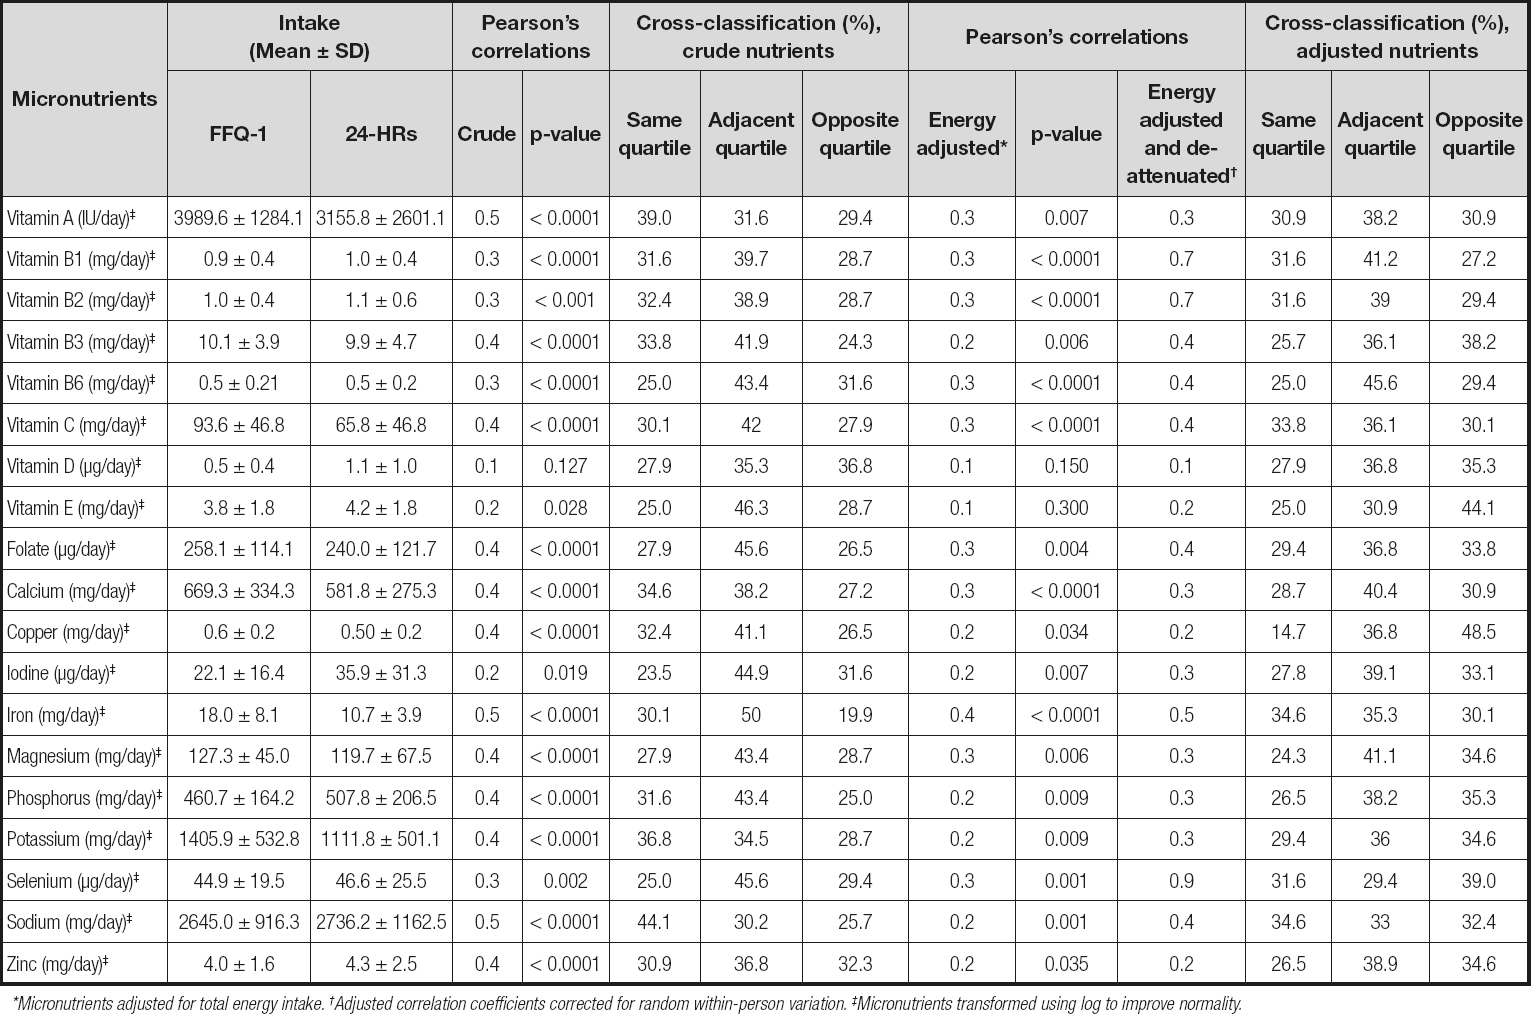
*Micronutrients adjusted for total energy intake. †Adjusted correlation coefficients corrected for random within-person variation. ‡Micronutrients transformed using log to improve normality.
RELATIVE VALIDITY OF THE FFQ
Table IV shows the mean daily intake of food groups obtained from the FFQ-1 and the four 24h-DRs. The mean daily intake of food groups estimated by the FFQ-1 was higher than that obtained by the 24h-DR except for milk and milk products, bread, cereals and grains, vegetables, cheese, sugary drinks, and vegetable oils. Unadjusted and energy-adjusted Pearson's correlation coefficients between the FFQ-1 and the 24h-DRs of 136 Jordanian children and adolescents are presented in table IV. The unadjusted Pearson's correlation coefficients ranged from 0.31 for animal fats to 0.80 for coffee. Adjustment for total energy intake decreased the correlation coefficient for most food groups. The most obvious change after energy adjustment occurred in fruits and fruit juices and nuts. The adjusted Pearson's correlation coefficients ranged from 0.06 for nuts to 0.63 for bread. The energy-adjusted coefficients were statistically significant except for nuts and animal fats. The mean of the correlation coefficients decreased from 0.56 to 0.42. After correction for random within-person variation, the energy-adjusted correlations increased and ranged from 0.08 for nuts to 0.95 for vegetable oils, with a mean of 0.48. Milk and milk products, bread, cereals and grains, vegetables, eggs, cheese, white meats, red and processed meats, sugary drinks, pickled olives, olive oil, vegetable oils, coffee, and tea had de-attenuated correlations of about 0.50 or greater (Table IV).
Table IV. Average daily intakes of energy and macronutrients. intraclass correlation coefficients and weighted kappa between the two food frequency questionnaires (FFQ1 and FFQ2) administered to 50 children and adolescents participating in the reproducibility part of a FFQ validation study

aIntraclass correlation coefficients based on absolute agreement and two-way mixed-effects model. *p < 0.001. †p < 0.0001.
Table V. Average daily intake of micronutrients, intraclass correlation coefficients, and weighted kappa between the two food frequency questionnaires (FFQ1 and FFQ2) administered to 50 children and adolescents participating in the reproducibility part of a FFQ validation study
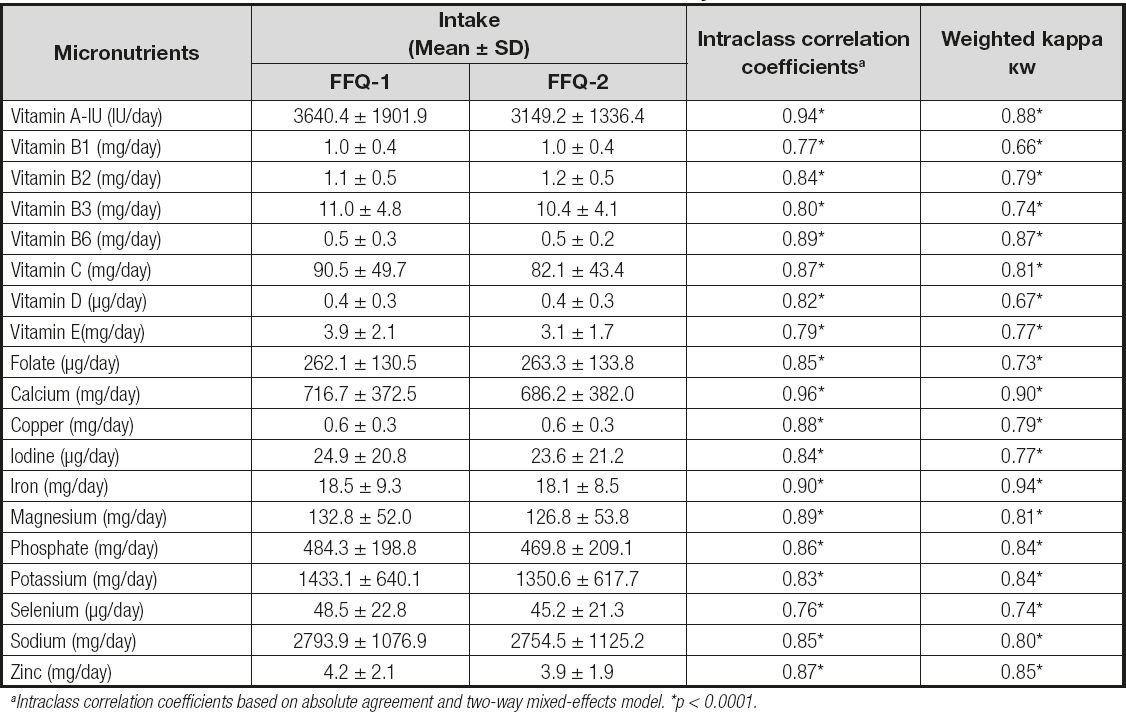
aIntraclass correlation coefficients based on absolute agreement and two-way mixed-effects model. *p < 0.0001.
The percentage of participants who were ranked into the same quartile or the adjacent quartile or the opposite quartile by the FFQ and the four 24h-DRs is shown in table IV. On average, 46.6 % and 43.6 % of participants were classified by the FFQ-1 and the 24h-DRs into the same quartile based on their crude and energy-adjusted food group intake, respectively. However, 19.0 % and 17.6 % of participants were classified into the opposing quartile for the crude and energy-adjusted food group intake, respectively. The highest levels of misclassification were found for legumes, whereas the lowest levels of misclassification were found for pickled olives and olive oil.
Bland-Altman analysis
The Bland-Altman plots for milk and milk products and vegetables are presented in figures 1 and 2. The mean absolute difference in the estimated intake of milk and milk products between the FFQ-1 and the four 24h-DRs was -21.2 grams. After adding a ± 1.96 SD for the limits of agreement (LOA), an interval from -251.3 g/day (lower agreement limit) to 208.9 g/day (upper agreement limit) was obtained. The number of participants observed to be within the LOA value was 128 out of 136 (Fig. 1).
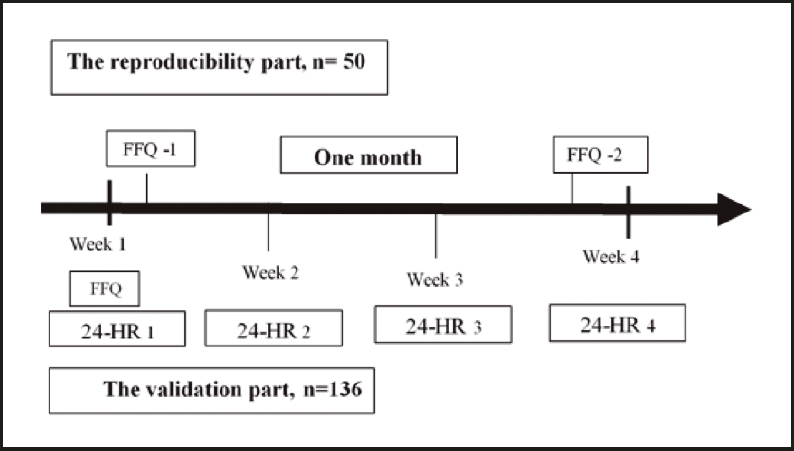
Figure 1. Schematic representative of the design for assessing the validation and reliability of the developed FFQ.
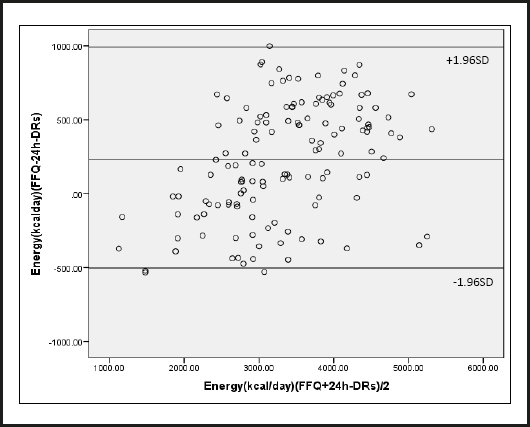
Figure 2. Bland-Altman plot of energy intake. Differences in daily intake of energy estimated with the mean of four 24-HRs and FFQ, plotted against the mean daily intake estimated by the two methods. The middle line represents the mean difference between the two dietary methods, and the upper and lower lines represent the limits of agreement corresponding to ± 1.96 standard deviations (SD) (participants = 136 children and adolescents). September 2017 to May 2018.
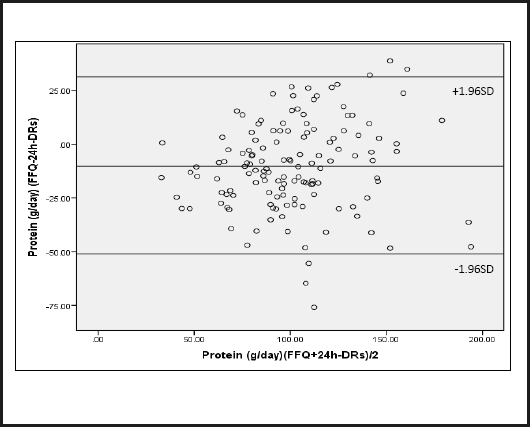
Figure 3. Bland-Altman plot of protein intake. Differences in daily intake of protein estimated with the mean of four 24-HRs and FFQ, plotted against the mean daily intake estimated by the two methods. The middle line represents the mean difference between the two dietary methods, and the upper and lower lines represent the limits of agreement corresponding to ± 1.96 standard deviations (SD) (participants = 136 children and adolescents). September 2017 to May 2018.
The mean absolute difference in estimated intake of vegetables between the FFQ-1 and the four 24h-DRs was -12.4 g (Fig. 2). After adding a ± 1.96 SD for the LOA, an interval from -141.8 g/day (lower agreement limit) to 117.0 g/day (upper agreement limit) was obtained. The number of individuals observed to be within the LOA value was 126 out of 136.
DISCUSSION
To investigate the associations between diet and health outcomes during childhood and adolescence a 120-food item quantitative FFQ was designed to evaluate the intake of food groups among Jordanian children and adolescents. The developed FFQ showed excellent reproducibility and acceptable relative validity to classify participants regarding their food group intake when compared with four 24h-DRs. Intraclass correlation coefficients ranged from 0.18 for nuts to 0.98 for tea, and all correlations were statistically significant except for nuts. The majority of the food groups (20 out of 21) had intraclass correlation coefficients equal to 0.75 or greater. The findings of reproducibility testing in the current study were similar to the values obtained with other FFQs. Saeedi et al. (2016) reported that intraclass correlation coefficients ranged from 0.35 for sweet snacks to 0.78 for white bread, and more than half of their food groups had intraclass correlation coefficients of more than 0.50 (16). Moreover, Wong et al. (2012) found that intraclass correlation coefficients ranged from 0.26 for red meat and processed meat to 0.92 for meat alternatives (tofu, vegetarian sausages, and falafel) among children and adolescents aged between 4 and 16 years (24). A validation study carried out in northern China among female adolescents reported intraclass correlation coefficients between two FFQs that ranged from 0.56 for beans to 0.73 for red meat (25). In this study, the intraclass correlation for nuts consumption was weak. One possible reason for the poor reliability of nuts was the low frequency of nut consumption. Recalling weekly, monthly, or yearly food intakes would be more difficult and less accurate than daily intakes.
Diet records and 24-h recalls have been used commonly to validate FFQs (25-27). In the current study, the 24h-DR was used as the reference method. The 24h-DR is the most accurate dietary assessment method for children (28). The unadjusted Pearson's correlation coefficients ranged from 0.31 for animal fats to 0.80 for coffee. In a New Zealand validation study conducted in adolescents crude Spearman's correlation coefficients ranged from 0.04 for convenience foods to 0.70 for standard milk (whole-fat milk) (24). In contrast, Saeedi et al. (2016) showed that crude Spearman's correlation coefficients ranged from -0.11 for tomato sauce and ketchup to 0.58 for peanut butter and sweetened hazelnut cocoa spread (16).
Correction for total energy intake decreased the correlation coefficients for some food groups, whereas adjustment for within-person variation in the 24h-DRs increased correlation coefficients for most food groups. According to Willett (2012), the correlations for food groups will increase after energy adjustment, if the variability of food consumption is associated with energy intake; however, energy adjustment decreases correlation coefficients when the variability depends on systemic errors of overestimation or underestimation (12). In the current study, the energy adjustment resulted in decreased correlation coefficients for most food groups. Similarly, Xia et al. (2011) showed that energy-adjusted Spearman's correlation coefficients were lower than crude coefficients (25).
However, adjustment for measurement error in the 24H-DRs resulted in acceptable correlations. Over half of food groups (13 out of 21) had a de-attenuated and energy-adjusted correlation equal to or greater than 0.50, with a mean of 0.48. The de-attenuated and energy-adjusted correlation coefficients ranged from 0.08 for nuts to 0.95 for vegetable oils. Two validation studies conducted among adolescents revealed that de-attenuated and energy-adjusted correlation coefficients ranged from 0.03 for fish to 0.61 for dairy products (27), and from 0.53 for milk to 0.63 for fruits, red meats, and eggs (25). Bread and vegetable oils had the highest de-attenuated and energy-adjusted correlation, while legumes, nuts, and animal fats had the lowest de-attenuated and energy-adjusted correlations in the current study. Bread is the most commonly consumed food in Jordan. A Brazilian study also showed a high correlation for rice groups that included bread, grains, and starches in adolescents (29). Conversely, a validation study conducted among Danish adolescents reported a low correlation for bread consumption (27). The pronounced effect of de-attenuation was for vegetable oils, which could be explained because participants had the greatest within-person variation in the intake of vegetable oils. However, vegetable oils used for cooking are usually for the whole family, and estimating oil intake through cooked foods for each individual was difficult.
There were several reasons for the poor relative validity of nuts, legumes, and animal fats: estimating the exact amount of food items consumed is difficult since nuts and animal fat were consumed in mixed dishes. Consumption of nuts, legumes and animal fats is rare among the Jordanian population, and using the mean of four 24h-DRs as a reference method may not be appropriate. Furthermore, children might not be able to recall the frequency of these foods, which are usually consumed as a part of the main dishes (30).
Cross-classification based on intake quartiles showed reasonable agreement between the two dietary methods. For most food groups, about 40 % or more of the participants were classified into the same quartile of crude and energy-adjusted intakes. Approximately 19.0 % and 17.6 % of participants were grossly misclassified into opposite quartiles of crude and energy-adjusted food group intakes.
The proportion of participants classified into the same or adjacent quartiles in this study is similar to that seen in other studies. Bjerregaard and colleagues (2018) reported that 35 % of Danish adolescents were classified by 24h-DRs and FFQ into the same quartile according to their food intake, whereas 7.5 % were classified into opposite quartiles in their study (27). The proportion of participants classified in the same tertile by the 24h-DRs and FFQ varied from 53.7 % for oil to 71.3 % for sugars among Brazilian adolescents (29). On the other hand, the FFQ used by Xia and colleagues (2011) and validated against dietary recalls was able to classify 83.7 % of participants into the same category based on their food intake (25).
In the current study a Bland-Altman analysis was used to provide further confirmation of agreement between the FFQ and the mean four 24h-DRs. The Bland-Altman analysis demonstrated that negative differences increased as mean intakes increased. The 24-h DRs overestimated intakes of milk and milk products and vegetables as compared with the FFQ. The mean differences in intakes of milk and milk products and vegetables was below zero, confirming an underestimation by the FFQ. Conversely, Bjerregaard et al., (2018) reported that the Bland-Altman plots for beverages, dairy, and meat/poultry showed some outliers, but no systematic patterns were observed (27).
A main strength of the present study was the development of a FFQ containing foods culturally adapted to Jordanian children and adolescents. Furthermore, a trained nutritionist conducted face-to-face interviews to gather all the required information and to minimize missing data. Data collection took place in different seasons of the year to obtain a wider spectrum of dietary intake across seasons, and also the FFQ included seasonal foods items to minimize errors of seasonal variation. Food models and measuring tools were used to estimate portion size correctly.
However, this study had a few limitations. First, the fact that the FFQ and 24h-DRs had similar sources of recall bias and of overestimation or underestimation of food intake (12). Second, the time between the two administrations of the FFQ was short and participants may simply have recalled their previous responses. However, the aim of this study was to examine the FFQ reproducibility and not actual changes in the diet. Third, the validation of the FFQ by comparing food intake with their relevant concentrations in plasma was not measured in this study. Fourth, there was a tight schedule for the reporting of the 24h-DRs. Ideally, 24h-DRs should be collected within the coverage period of the FFQ. On the contrary, participants may have been lost to follow-up with longer periods of collection of the reference method.
CONCLUSION
The developed FFQ showed excellent reproducibility and good relative validity in evaluating dietary intake for most food groups among Jordanian children and adolescents. Based on the results of the present study, this FFQ seems to be a useful tool for investigating food group intake during the childhood period.

