


 Serviços customizados
 Espanhol (pdf)
 Artigo em XML
 Referências do artigo
 Enviar este artigo por email
 Citado por SciELO
  Citado por Google
  Similares em
SciELO
Similares em
SciELO  Similares em Google
 Permalink
INTRODUCTION
Recently, important changes have occurred in nutritional patterns; unhealthy habits, such as high consumption of simple carbohydrates, have risen sharply among people (1–3), and are being associated with the etiology of numerous metabolic disorders related to obesity and metabolic syndrome (4). Among the factors that lead to metabolic disorders the consumption of large amounts of sugars in the diet, in particular the monosaccharide fructose, which can also be found in the form of a disaccharide (sucrose) or polysaccharide (fructan), has stood out. It is estimated that the consumption of fructose increased by 16 % between 1986 and 2007 (5,6); it is mostly consumed as a sweetener in drinks and processed foods (such as high fructose corn syrup (HFCS or sucrose), and is commonly found in products such as soft drinks, breakfast cereals, breads, condiments, and desserts (4,7,8).
However, due to lack of control on food labeling the fructose content in foods and beverages made with HFCS, fruit juice concentrate, or crystalline fructose has been increasing considerably in the food industry (9). Some studies have shown that the fructose content in sugar-sweetened drinks made with HFCS can be as high as 65 % of total sugar content, greater than that suggested by the fructose content of HFCS-55 (55 % fructose), for example (10).
Owing to its metabolic fate fructose has specific effects on lipid and carbohydrate metabolism (11). Studies have shown that consumption of sweetened beverages, especially with fructose but not with glucose, has the potential to increase visceral adiposity as well as serum and liver lipids, in addition to favoring an increase in lipogenesis (12), insulin resistance, dyslipidemia (13), and an increase in the prevalence of non-alcoholic fatty liver disease (NAFLD) (11,14-17).
NAFLD is a chronic liver disease and an important public health problem that affects approximately 25 % of the world population (18).
The pathogenesis of this disease begins with the ectopic accumulation of lipid droplets rich in triacylglycerol (TAG) in hepatocytes, characterizing hepatic steatosis. In addition, there may be a redox imbalance due to greater production or inability to inactivate the free radicals produced during β-oxidation, which favors inflammatory and fibrotic processes related to the disease progression (19,20).
Dietary factors that influence NAFLD have become an important focus of attention. Experimental animal models suggest the effects of fructose consumption on liver function in different ways. However, there is no consistent scientific evidence that clearly demonstrates the effects of fructose consumption in relation to exposure length and the concentration of this monosaccharide, and in terms of biochemical and oxidative stress parameters. Hence, to determine the effect of fructose on the development of metabolic disorders in an animal model we conducted a study to evaluate the consumption of different concentrations of fructose (10 %, 30 %, and 60 %) diluted in water for 8 or 12 weeks by Wistar rats.
MATERIAL AND METHODS
ANIMALS AND ETHICS APPROVAL
The use of animals was approved by the Ethics Committee on the Use of Animals (CEUA) (protocol number: 8872180418). Sixty-four Wistar rats aged 4 to 6 weeks, from the Animal Science Center (CCA) at UFOP, were used. They were housed in groups of four animals under a 12 h:12 h light/dark cycle and controlled temperature (24 ± 1 °C). The rats were fed a standard diet (Nuvilab CR, Quimtia) and were divided into a control (C) group (n = 7), and fructose 10 % (F10; n = 7), fructose 30 % (F30; n = 7), and fructose 60 % (F60; n = 7) groups, and treated for 8 or 12 weeks ad libitum. Water was changed weekly, and body mass, food intake, and water consumption were evaluated. At the end of 8 or 12 weeks of treatment the mice were euthanized with 3 % isofuran for further analysis. There were no animal deaths during the experimental period.
SERUM METABOLIC ASSAYS
Serum samples were collected using cardiac puncture methods and used for glucose assay, lipid profile (total cholesterol and fractions, TAGs), liver function (ALT and AST), and kidney function (creatinine, urea, and albumin) tests with commercial kits from LABTEST® laboratories (Lagoa Santa, MG, Brazil).
HEPATIC LIPID EXTRACTION
Total lipids were extracted from a 200 mg aliquot of liver tissue. This was homogenized in 3.8 mL of chloroform/methanol solution (2:1, v/v). Then, 800 µL of methanol was added to the homogenate, followed by centrifugation at 3,000 g for 10 min. The supernatant was transferred to another tube and 1.6 µL of chloroform and 1.3 mL of 0.73 % NaCl were added, followed by centrifugation at 3000 g for 10 min. The supernatant was discarded and the precipitate was washed thrice with Folch's solution (3 % chloroform, 48 % methanol, 47 % water, and 2 % 0.2 % NaCl). The lipid extracts were dried in a semi-open oven at 37 °C. After evaporation the tubes were placed in a desiccator to cool and weighed again to calculate the amount of liver fat, which was obtained from the difference between the final weight (g) of the tube and the initial weight of the tube (g) multiplied by 100 (21). The lipid extracts were re-suspended in 1 mL of isopropanol and subsequently used to measure total cholesterol and TAGs using LABTEST® kits (Lagoa Santa).
ANALYSIS OF CELLULAR REDOX STATUS
Catalase (CAT)
The activity of catalase was determined based on its ability to hydrolyze hydrogen peroxide (H2O2) to water and molecular oxygen (22). The method was based on the decomposition of H2O2 by the enzyme for 3 min, which was monitored by UV spectrophotometry at 240 nm. A 100 mg liver sample was homogenized with 1 mL of 0.1 M phosphate buffer (pH: 7.2) and then centrifuged for 10 min at 4 °C. The supernatant was removed and used as the biological sample. The samples were diluted in H2O2 (10 mM) and every 30 sec a reading was performed on the spectrophotometer at 240 nm to determine the absorbance of the samples until 2 min were completed. Distilled water was used as blank. Catalase activity was calculated using the absorbance delta over 2 min (final absorbance − initial absorbance / 2) and the molar extinction coefficient of H2O2 (ε = 39.4 L mol−1 cm−1); 1 U of catalase was equivalent to the hydrolysis of 1 µmol of H2O2. The results were expressed in nmol per mg of protein.
Superoxide dismutase (SOD)
In this method, the SOD enzyme competes with the superoxide radical, formed by the auto-oxidation of pyrogallol, which is responsible for the reduction of MTT to formazan crystals. Briefly, 100 mg of tissue was homogenised in 1 mL of 0.1 M phosphate buffer (pH: 7.2). Then, the homogenate was centrifuged at 12,000 rpm for 10 min at 4 °C, and the supernatant was collected and used for dosing. The plate was incubated in an oven at 37 °C for 5 min, and the reaction was stopped by adding 150 µL of DMSO. A reading was performed at 570 nm using an ELISA reader. The results were expressed in U of SOD per mg of protein, where a unit of SOD was defined as the amount of enzyme required to inhibit 50 % of MTT reduction.
CONCENTRATION OF TOTAL, OXIDIZED, AND REDUCED GLUTATHIONE
The levels of total glutathione (GSH) were determined using 100 mg liver homogenate in 1 mL of 5 % sulfosalicylic acid buffer (SSA). After the samples were homogenized, they were centrifuged at 10,000 rpm for 10 min at 4 °C. The intracellular contents of GSH and glutathione disulfide (“oxidized” form, GSSG) were determined in liver homogenates using the 5,5'-dithio-bis-(2-nitrobenzoic acid) (DTNB) recycling method and the GSSG reductase method proposed by Griffith (23). Reduced glutathione concentration was determined by the difference between GSH and GSSG. This assay uses a kinetic method based on the reduction of DTNB to TNB (5-thio-2-nitrobenzoic acid), which can be detected by a spectrophotometer at 412 nm.
LIPID PEROXIDATION IN LIVER USING TBARS
Thiobarbituric acid (TBA) can bind to oxidised lipids, allowing the quantification of TBARS using a spectrophotometric method (24). Briefly, 100 mg of liver was homogenised in 1 mL of tris-HCl buffer (20 mM), and the homogenate was centrifuged at 10,000 g for 10 min at 4 °C. Then, 0.5 mL of the supernatant was mixed with 0.25 mL of trichloroacetic acid (TCA) (28 % w/v in 0.25 N HCl), 0.25 mL of TBA (1 % in 0.25 N acetic acid), and 12.5 mL of butylhydroxytoluene (BHT) (125 mM in ethanol), heated for 15 min at 95 °C, and placed in an ice bath. A part (0.6 mL) of the mixture was transferred to a polypropylene tube and 0.6 mL of butanol was added. The tubes were shaken and centrifuged at 10,000 g for 10 min at 4 °C, and 200 µL of the supernatant was collected and placed in a 96-well microplate. A reading was performed using an ELISA reader at 535 nm. The concentration of TBARS was determined based on the equation of the line, according to the Beer-Lambert law; 1,3,3-tetramethoxypropane (TMP) was used as the standard. The results were expressed in nmol per mg of protein.
CARBONYLATED PROTEIN
Carbonylated proteins are markers of protein oxidation by reactive oxygen species (ROS). Carbonyl derivatives can be measured by sensitive methods, particularly those using 2,4-dinitrophenylhydrazine (DNPH). In this method, DNPH reacts with carbonyl groups to generate the corresponding hydrazone, which can be analyzed spectrophotometrically (25). To determine the dosage, a 200 mg sample of liver tissue was homogenised in 1 mL of 50 mM phosphate buffer (pH: 6.7), and then the homogenate was centrifuged at 10,000 g for 10 min at 4 °C. The supernatant was removed and used for the experimental procedure. The test was performed using a UV spectrophotometer at a wavelength of 370 nm, and the procedure was carried out by adding 10 % TCA reagent, DNPH, ethanol/acetate, and SDS, followed by centrifugation and incubation at room temperature in the dark. The results were expressed in nmol of incorporated DNPH per mL.
HISTOLOGICAL ANALYSIS OF THE LIVER
Liver fragments were fixed in methanol (80 %) and DMSO (20 %). Then, the fragments were cut transversely, processed with a decreasing series of alcohols, and embedded in paraffin. Paraffin sections (4 µm) were cut in a rotating microtome (Leica, Germany), mounted on microscope slides, and stained with hematoxylin and eosin (H&E). Histological analyses of the liver were performed using images obtained at random under a Leica DM5000B microscope and photographed at 40× magnification (Leica Application Suite, Version 2.40R1, Germany). To evaluate the degree of steatosis, a semi-quantitative scoring system was adopted and 10 microscopic fields were examined in each image. The grading of hepatic steatosis was done based on the work by Brunt et al. (1999) (26), considering the presence of macrovesicular steatosis (simple steatosis), as follows: grade 0: without steatosis; grade 1 (mild): < 33 % fat accumulation in hepatocytes; grade 2 (moderate): between 33 % and 66 % of affected hepatocytes; grade 3 (severe): > 66 % of affected hepatocytes.
DETERMINATION OF IL-6 AND TNF PRODUCTION
Serum was employed to measure IL-6 and TNF levels with the ELISA immunoenzymatic method using Peprotech® kits.
STATISTICAL ANALYSIS
Data were expressed as means ± standard errors of the means (SEM). The data were subjected to statistical analysis by two-way ANOVA (time and concentration of fructose as independent variables), with a Bonferroni post-hoc test. Prism 8.0 (GraphPad, La Jolla, CA, USA) was used to perform the analysis. Differences were considered significant at p < 0.05.
RESULTS
EFFECT OF CONSUMPTION OF DIFFERENT CONCENTRATIONS OF FRUCTOSE AND TIMES OF EXPOSURE ON BODY MASS, FOOD INTAKE, AND WATER INTAKE
As shown in table I, there were no significant variations or differences in the initial body masses of the animals in the different groups at the beginning of the experiment. However, at the end of 8 and 12 weeks there was a statistical increase in the final masses in groups C, F10, F30, and F60 during their respective weeks. The data showed that the concentration of fructose was responsible for 19.76 % of total variance, and length of exposure for 49.72 % [p < 0.0001, F (3, 48) = 10.54; and p < 0.0001, F (1, 48) = 79.55, respectively].
Table I. Body mass, food intake, and water intake of rats in relation to consumption of fructose at different concentrations and for different periods
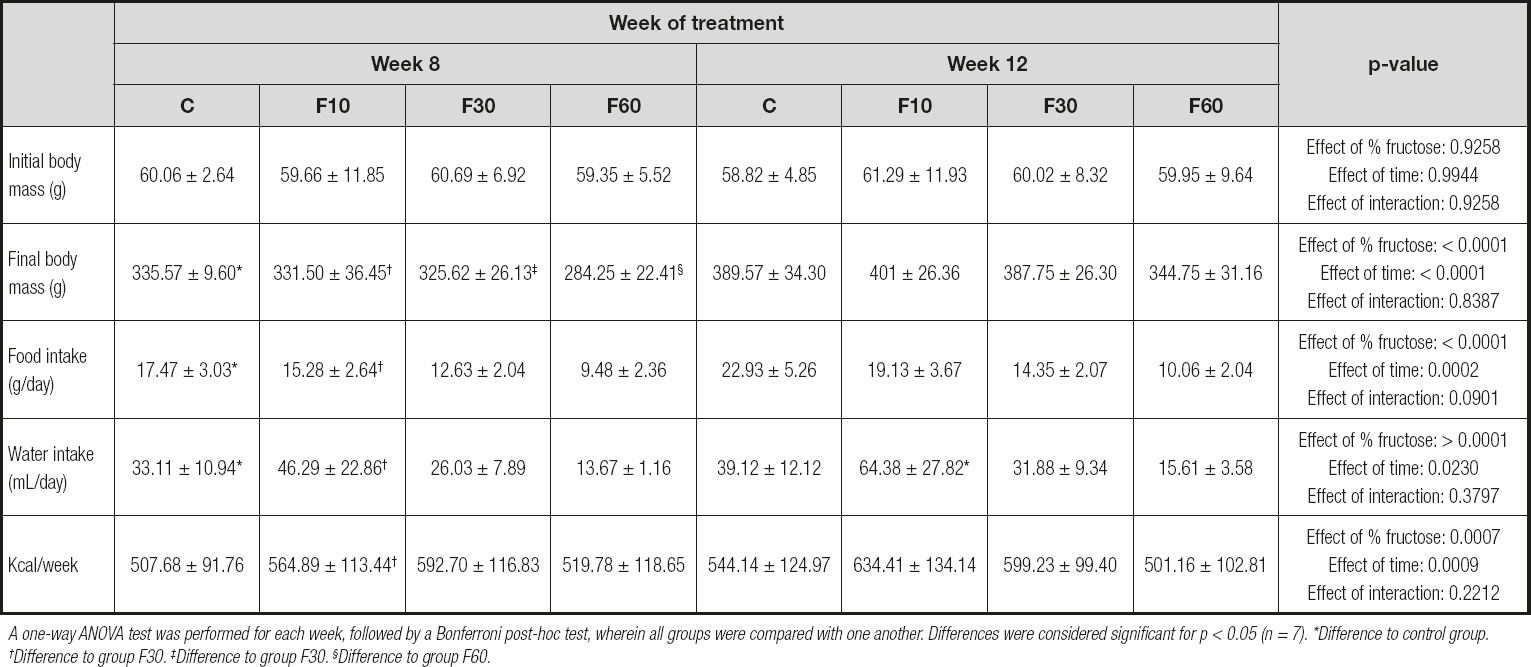
A one-way ANOVA test was performed for each week, followed by a Bonferroni post-hoc test, wherein all groups were compared with one another. Differences were considered significant for p < 0.05 (n = 7). *Difference to control group. †Difference to group F30. ‡Difference to group F30. §Difference to group F60.
There was a significant increase in the food intake of the animals at 12 weeks compared with that at 8 weeks in groups C and F10. In addition, concentration was responsible for 51.07 % of the total variation, and the time of exposure for 7.01 %, with no interaction [p < 0.0001, F (3, 72) = 38.85; p < 0.0002, F (1, 72) = 15.99; and p = 0.090, F (3, 72) = 2.24, respectively].
For water intake there was an increase in group F10 at 12 weeks compared with that at 8 weeks. We found that fructose concentration was responsible for 44.85 % of total variance, and the time for 3.31 % [p < 0.0001, F (3, 72) = 24.31; and p < 0.023, F (1, 72) = 5.39, respectively].
We found that animals supplemented with 10 % fructose for 12 weeks exhibited a higher caloric intake when compared to those treated for 8 weeks. Nevertheless, concentration was responsible for 17.14 % of total variation, and time of exposure for 10.88 % [p < 0.0007, F (3, 72) = 6.31; and p < 0.0009, F (1, 72) = 12.02, respectively].
FRUCTOSE CONSUMPTION PROMOTES CHANGES IN BIOCHEMICAL PARAMETERS ACCORDING TO CONCENTRATION AND EXPOSURE TIME
Given the differences found in body mass, food and water intake, and kcal per week between the groups evaluated, we decided to check the possible effects of time and fructose concentration on biochemical parameters, as shown in table II.
Table II. Biochemical and inflammatory profile of rats subjected to fructose consumption at different concentrations and for different periods
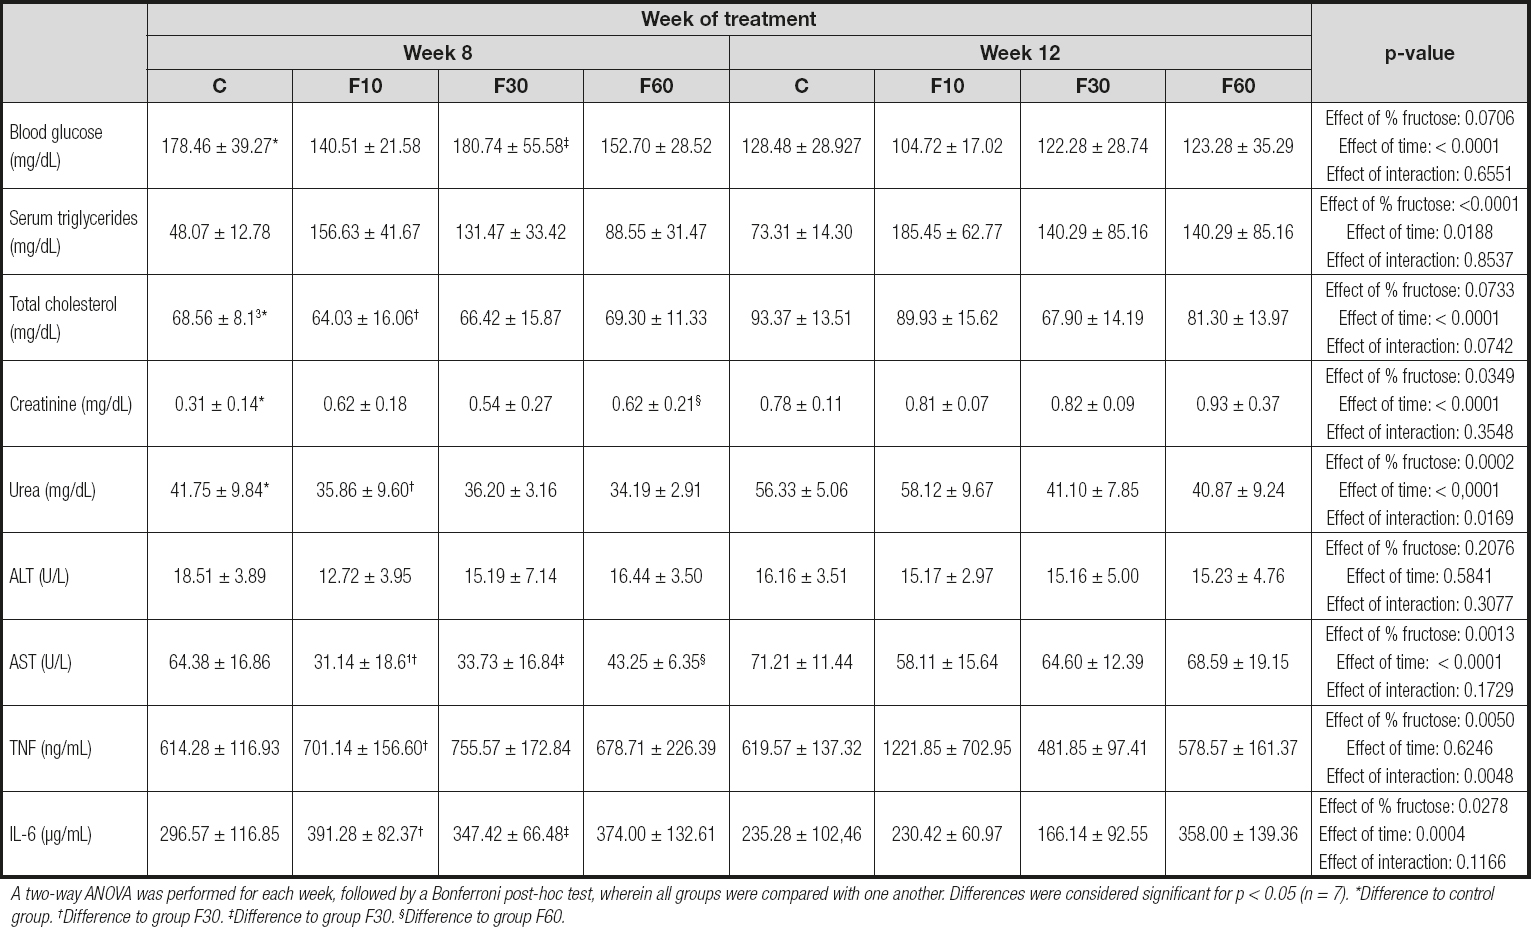
A two-way ANOVA was performed for each week, followed by a Bonferroni post-hoc test, wherein all groups were compared with one another. Differences were considered significant for p < 0.05 (n = 7). *Difference to control group. †Difference to group F30. ‡Difference to group F30. §Difference to group F60.
A two-way ANOVA test revealed that the time of exposure to fructose had a statistically significant effect on the reduction in blood glucose, being responsible for 28.91 % of total variance [p < 0.0001, F (1, 48) = 23.23]. In addition, there was a significant reduction in glycemia in groups C and F10 at 12 weeks when compared with that at 8 weeks.
The period of exposure to fructose statistically increased the concentration of total cholesterol, especially when comparing the mice in group C to those in group F10 for the period of 8 and 12 weeks. For this parameter, exposure time promoted a total variation of 23.12 % [p < 0.0001, F (1, 48) = 18.88].
Although we did not observe statistical differences in the serum triglyceride profiles of the groups evaluated, it was possible to verify that fructose concentration was responsible for 41.24 % of total variance, and time of exposure for 6.35 % [p > 0.0001, F (3, 48) = 12.80; and p = 0.0188, F (1, 48) = 5.91, respectively].
For the creatinine parameter we found a significant increase at 12 weeks compared with that at 8 weeks when we performed intergroup comparisons of groups C and F60 for both evaluated periods. In addition, fructose concentration was responsible for 10.09 %, and time of exposure for 34.41 % of total variance [p = 0.0349, F (3, 48) = 3.11; and p < 0.0001, F (1, 48) = 31.83, respectively]. No interaction effect was observed.
We observed a statistical increase in urea levels in group C at 12 weeks compared with those at 8 weeks, with group F10 exhibiting a similar profile. However, fructose concentration was responsible for 20.31 % of total variance, time of exposure for 29.38 %, and an interaction between these two parameters for 9.55 % [p = 0.0002, F (3, 48) = 7.97; p < 0.0001, F (1, 48) = 34.60; and p = 0.01, F (3, 48) = 3.74, respectively].
No statistical variations or differences were observed in the ALT levels. In contrast, for AST, we observed an effect of fructose concentration representing 18.02 % of total variance, and 29.95 % for time of exposure to fructose, with no interaction effect [p = 0.0013, F (3, 48) = 6.14; and p < 0.0001, F (3, 48) = 30.62, respectively]. In addition, there was an increase in the concentration of AST at 12 weeks in groups F10, F30, and F60 as compared with 8 weeks.
For the cytokines evaluated our results demonstrated a significant increase in TNF levels at 12 weeks compared with those at 8 weeks in the F10 group, with no differences between the other groups. Nevertheless, there was an interaction between exposure time and fructose concentration, representing 18.95 % and 18.79 % of total variance, respectively [p = 0.0048, F (3, 48) = 4.89; and p = 0.005, F (3, 48) = 4.85, respectively].
Despite the absence of an interaction effect, we observed a total variance of 12.62 % in IL-6 concentration with respect to fructose concentration, and 18.49 % with respect to time of exposure [p = 0.0278, F (3, 48) = 3.30; and p = 0.0004, F (1, 48) = 14.55, respectively]. A statistically significant reduction was observed for IL-6 levels in group F30 at 12 weeks as compared with those at 8 weeks.
FRUCTOSE CONSUMPTION PROMOTES CHANGES IN ANTIOXIDANT ENZYMES AND LIVER DAMAGE MARKERS ACCORDING TO CONCENTRATION AND LENGTH OF EXPOSURE
As shown in table III, there was a significant increase in GSH activity at 12 weeks as compared with 8 weeks in both group C and F60. Nevertheless, fructose concentration was responsible for 22.20 % of total variance, and time of exposure for 36.60 %. No significant interactions were observed [p < 0.0001, F (3, 48) = 10.64; p < 0.0001, F (1, 48) = 55.52; and p = 0.0502, F (3, 48) = 2.79, respectively].
Table III. Redox status and damage markers of rats subjected to fructose consumption at different concentrations and for different periods
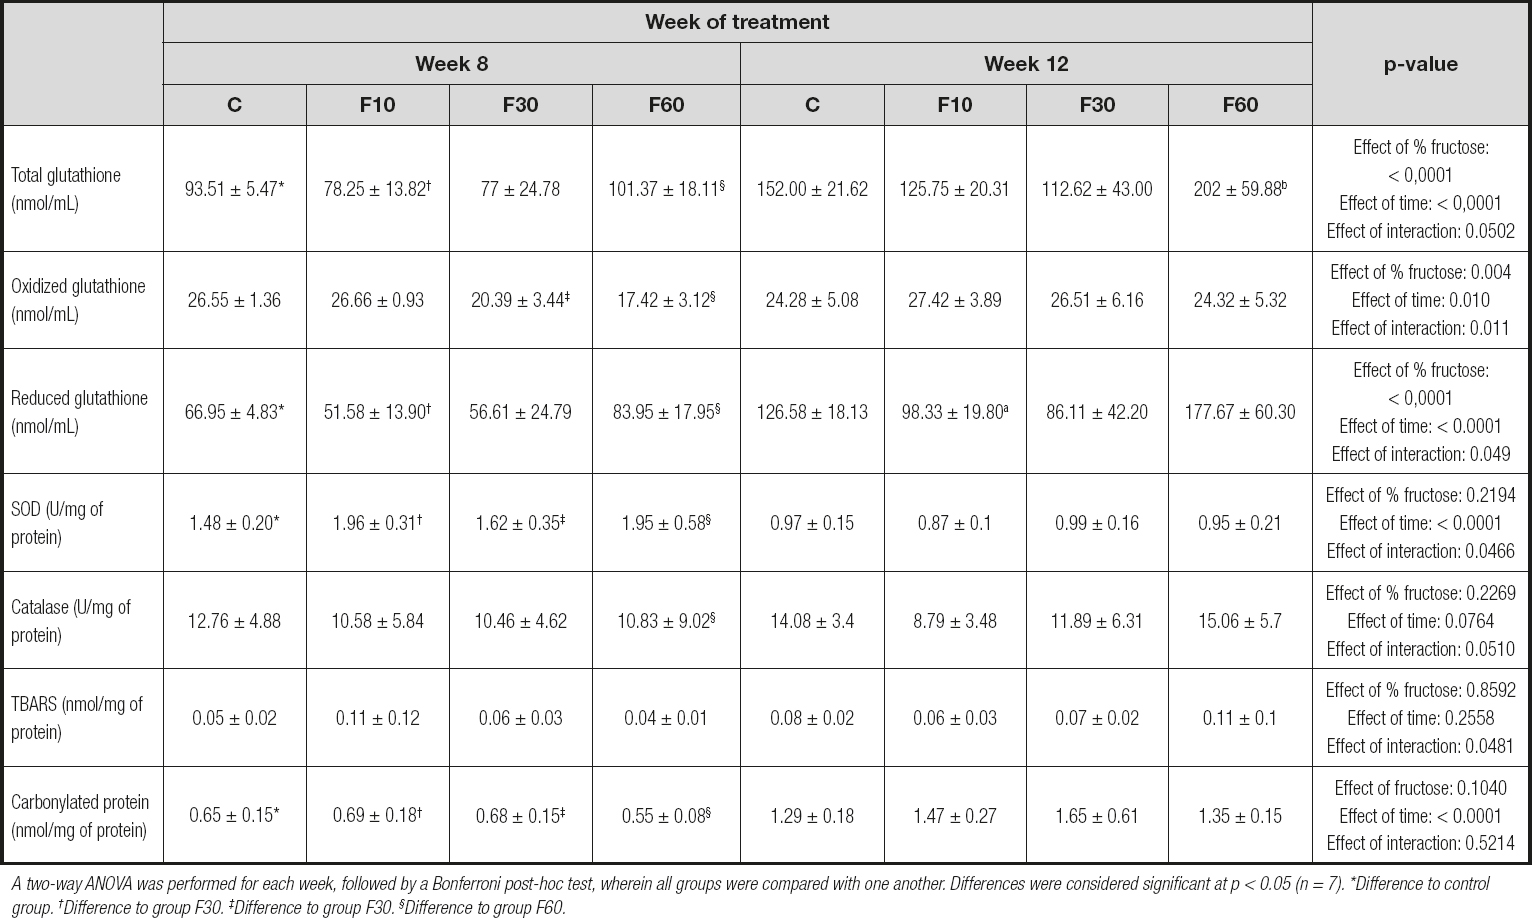
A two-way ANOVA was performed for each week, followed by a Bonferroni post-hoc test, wherein all groups were compared with one another. Differences were considered significant at p < 0.05 (n = 7). *Difference to control group. †Difference to group F30. ‡Difference to group F30. §Difference to group F60.
The mice in groups F30 and F60 showed an increase in GSSG levels when we evaluated the differences between these groups after 12 weeks of exposure in relation to 8 weeks. In addition, there was a significant interaction between fructose concentration and time, which accounted for 14.79 % of total variance [p = 0.011, F (3, 48) = 4.07]. Fructose concentration was responsible for 18.36 % of total variance, and time of exposure for 8.72 % [p = 0.004, F (3, 48) = 5.05; and p = 0.001, F (1, 48) = 7.202, respectively].
There was a significant reduction in glutathione levels in groups C and F60 at 8 weeks compared with those at 12 weeks. In addition, 24.86 % of total variation was due to the effect of fructose concentration [p < 0.0001, F (3, 48) = 11.85] and 35.69 % due to exposure length [p < 0.0001, F (1, 48) = 51.05]. No interaction was observed [p = 0.0495, F (3, 48) = 2.80].
When evaluating SOD levels, we observed an effect of exposure time representing 60.24 % of total variation, and an interaction between fructose concentration and time representing 5.57 % of total variation [p = 0.046, F (1, 48) = 2.86; and p < 0.0001, F (3, 48) = 1.52, respectively].
In addition, there was a significant increase in catalase levels in group F60 at 12 weeks compared with that at 8 weeks. No variation was observed.
When evaluating oxidative damage markers, we did not observe statistical differences between the groups evaluated for TBARS, but we did observe an interaction between fructose concentration and time representing 14.50 % of total variance [p = 0.0481, F (3, 48) = 2.83]. There was a significant increase in carbonylated protein levels in groups C, F10, F30, and F60 at 12 weeks compared with those at 8 weeks of exposure. In addition, time was responsible for 71.52 % of total variance [p < 0.0001, F (1, 48) = 142.6].
EFFECT OF FRUCTOSE CONSUMPTION ON THE HISTOLOGICAL AND METABOLIC PROFILE OF THE LIVER AND THE HISTOLOGICAL PROFILE OF ADIPOSE TISSUE
As shown in table IV, no statistical differences were observed between the groups for triglycerides and total liver cholesterol; however, we found that fructose concentration was responsible for 17.22 % of total variation [p = 0.0249, F (3, 48) = 3.405] for liver triglyceride levels and 14.47 % [p = 0.040, F (3, 48) = 2.98] for total liver cholesterol levels. When we analyzed total hepatic fat, we observed a statistical increase in group F60 at 12 weeks as compared with 8 weeks. No variation was observed.
Table IV. Liver assessment of rats subjected to fructose consumption at different concentrations and for different periods
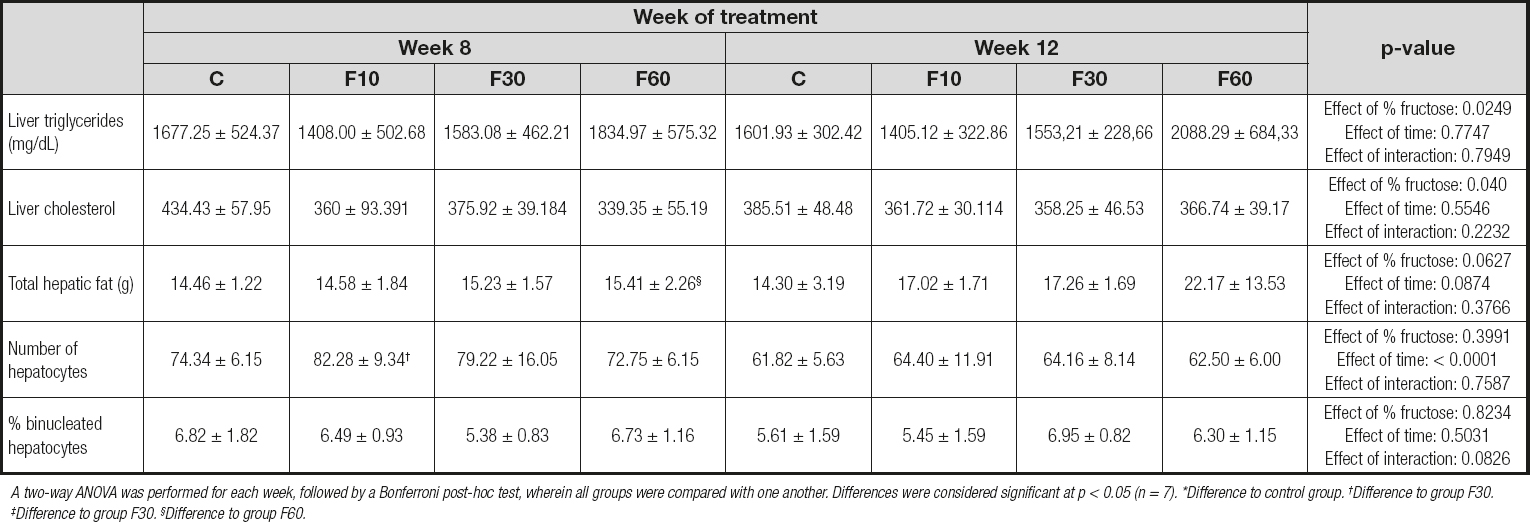
A two-way ANOVA was performed for each week, followed by a Bonferroni post-hoc test, wherein all groups were compared with one another. Differences were considered signifi cant at p < 0.05 (n = 7). *Difference to control group. †Difference to group F30. ‡Difference to group F30. §Difference to group F60.
Table V. Evaluation of the impact of fructose consumption at different concentrations and for different periods on histological grading of hepatic microsteatosis
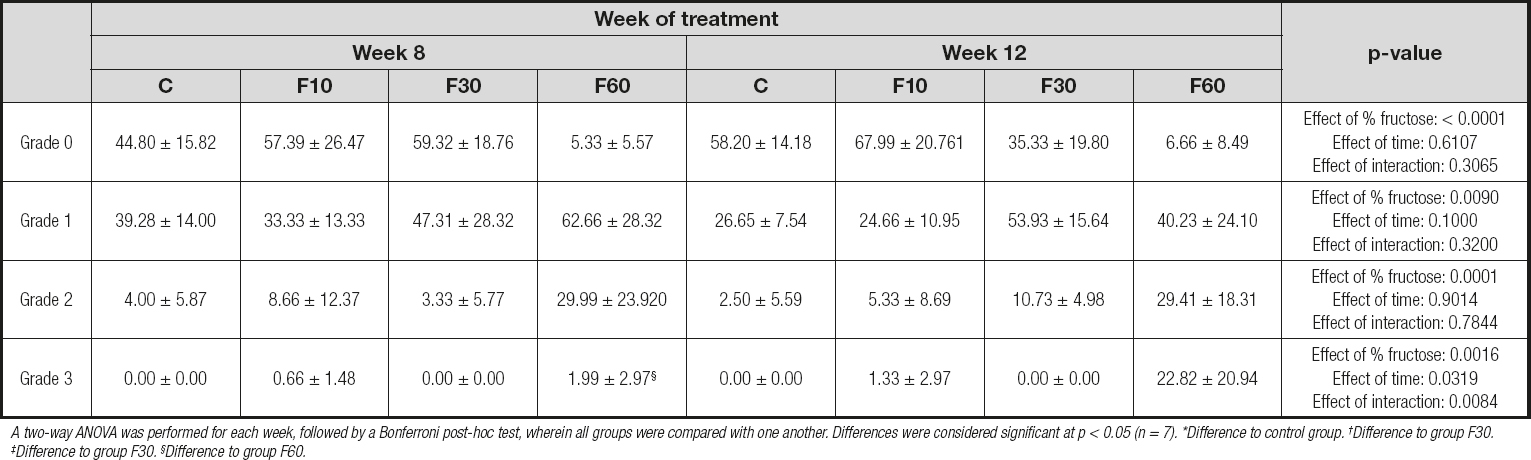
A two-way ANOVA was performed for each week, followed by a Bonferroni post-hoc test, wherein all groups were compared with one another. Differences were considered significant at p < 0.05 (n = 7). *Difference to control group. †Difference to group F30. ‡Difference to group F30. §Difference to group F60.
We found a significant reduction in the number of hepatocytes when we compared group F10 at 12 weeks and 8 weeks. In addition, time was responsible for 38.90 % of total variation [p < 0.0001, F (1, 32) = 23.06]. There were no statistically significant variations or differences between groups for the percentage of binucleated hepatocytes.
As shown in figure 2 the consumption of 60 % fructose diluted in water for 12 weeks stimulated the formation of more accentuated microsteatosis in relation to that at 8 weeks (Fig. 2D and 2H). There were no significant differences between the other groups.
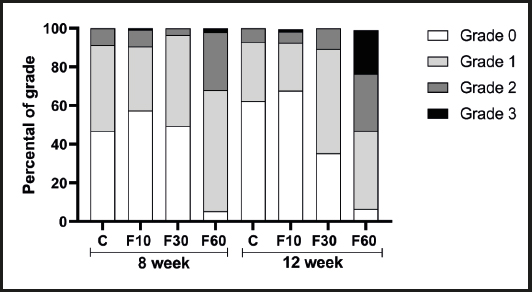
Figure 1. Evaluation of the impact of fructose consumption at different concentrations and for different periods on histological grading of hepatic microsteatosis.
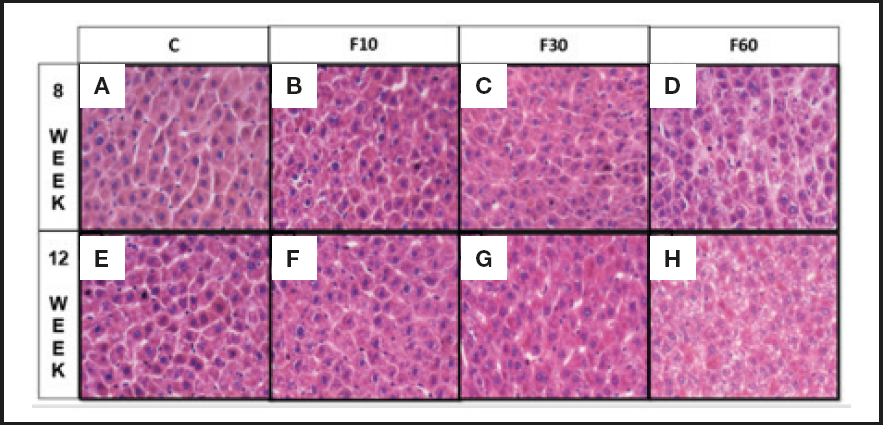
Figure 2. Sections of liver of Wistar rats fed with fructose diluted in water at different concentrations for different periods. (A) Rats C induced to consume water without fructose for 8 weeks, (B) rats induced to consume 10 % diluted fructose for 8 weeks, (C) rats induced to consume 30 % diluted fructose for 8 weeks, (D) rats induced to consume 60 % diluted fructose for 8 weeks, (E) Rats C induced to consume water without fructose for 12 weeks, (F) rats induced to consume 10 % diluted fructose for 12 weeks, and (G) rats induced to consume 30 % diluted fructose for 12 weeks and (H) rats induced to consume 60 % diluted fructose for 12 weeks. Two-way ANOVA test was performed, followed by the Bonferroni post-hoc test, wherein all the groups were compared with one another. Differences were considered significant at p < 0.05 (n = 7).
In addition, in a complementary way, figure 1 shows the interference of each grid analysis with respect to microsteatosis. Fructose concentration had effects of 62.28 %, 26.23 %, and 45.75 % on the total variation of grade 0 (p < 0.0001, F (3, 32) = 19.83], grade 1 [p < 0.0001, F (3, 32) = 4.56], and grade 2 [p = 0.0001, F (3, 32) = 9.29] steatosis, respectively. No differences were found between groups. With regard to grid 3, we observed a significant increase in group F60 at 12 weeks compared with 8 weeks, and we also observed an interaction between variables responsible for 19.81 % of total variation [p = 0.0084, F (3, 32) = 4.62], in addition to a total variation of 27.38 % with respect to fructose concentration [p = 0.0016, F (3, 32) = 6.40] and 7.18 % with respect to time [p = 0.0319, F (1, 32) = 5.035].
DISCUSSION
Fructose is often used in experimental animal models to promote the development and progression of NAFLD and other chronic metabolic diseases (4). However, there is a great variation in the concentration administered, the form of fructose offered (diluted with water or as part of diets), and the offer period. Therefore, this study was aimed at understanding the impact of fructose at different concentrations and exposure times on the metabolic parameters of Wistar rats using ANOVA.
Our data demonstrate that both fructose concentration and exposure time are capable of promoting variations in the parameters of body mass, food consumption, water intake, and kcal per week (Table I). Some studies have shown that fructose consumption can lead to a modulation of body mass, water, and food intake in animals under treatment (27,28). Hence, for 8 or 12 weeks we offered the animals commercial additives and fructose diluted in water at concentrations of 10 %, 30 %, or 60 % “ad libitum” to evaluate these effects.
Our data indicate an increase in the final body mass of the animals. Ng et al. (2018) (29) demonstrated that Sprague-Dawley rats supplemented with a 60 % fructose diet for 3 or 5 months achieved body mass gain. A meta-analysis carried out by Toop and Gentili (2016) (30) demonstrated a great heterogeneity in the effect of fructose on body mass throughout studies; 10 out of 24 studies performed with a 10 % fructose drink were associated with an increase in animal body mass. In contrast, rats supplemented with 10 % fructose diluted in water for 18 weeks did not show any increases in body mass (31). Another study with Wistar rats supplemented with 30 % fructose diluted in water for 16 weeks also demonstrated that there was no variation in the distribution of body mass (32).
Our data demonstrate the importance of the period of exposure to fructose in inducing modulations in the biochemical profiles of glycemia and total cholesterol. Furthermore, they demonstrate the role of fructose concentration and exposure time in promoting effects on triglycerides, creatinine, AST, TNF, and IL-6, as shown in table II. Comparative studies on the period of fructose exposure and fructose concentration are scarce; however, when we evaluated other studies, we found that the biochemical profile of the animals was affected by their consumption. Sprague-Dawley rats fed a 60 % high-fructose diet for 3 or 5 weeks showed an overall increase in serum triglyceride levels, blood glucose, total cholesterol, and urea over time (29).
When evaluating redox status and oxidative damage markers (Table III), we observed that fructose concentration and exposure time had an effect on GSH and reduced glutathione levels. For SOD, we evaluated the effects of time and the interaction between time and concentration. A significant interaction was observed for TBARS. For carbonylated protein levels, we observed a statistical increase in all groups at 12 weeks when compared with those at 8 weeks, with exposure time being a fundamental factor in generating an effect.
Studies have demonstrated that the administration of 10 % fructose in water for 3 weeks to healthy Wistar rats is associated with a state of oxidative stress due to an imbalance between production of ROS and antioxidant capacity (33,34). In addition, it is known that the incidence and progression of various health conditions, such as liver steatosis and other conditions, correlate with variations in oxidative stress and antioxidant defense enzyme levels (35).
An assessment of the hepatic profile (Table IV) indicated that fructose concentration is important in generating an effect on the concentration of hepatic triglycerides and total cholesterol, and that length of exposure to fructose can influence the number of hepatocytes.
Hepatic fructose metabolism generates intermediate products that are later used for glycogen synthesis, glyconeogenesis, and de novo lipogenesis (36-38). Therefore, oxidative stress can generate liver modulations associated with biochemical and related modulations. Hence, our data suggest an effect of fructose concentration in modulating the levels of hepatic triglycerides and total cholesterol, which is fundamental in reducing the number of hepatocytes, especially in group F10 at 12 weeks as compared to 8 weeks. Furthermore, they demonstrate that consumption of 60 % fructose for 12 weeks can induce microsteatosis, characteristic of hepatic steatosis, by increasing the concentration of fat in grade 3 steatosis (Fig. 1 and 2). Therefore, the data indicate that fructose consumption at concentrations of 10 % for 12 weeks (39), 15 % for 25 weeks (40), 20 % for 12 weeks (16), and 30 % for 28 days and 25 weeks (40,41) leads to fructose hepatic steatosis and contributes to an increase in de novo lipogenesis in the liver (6,42), leading to accumulation of lipids in hepatocytes. However, data from Miranda et al. (2019) (43) indicate that the consumption of 7 % fructose diluted in water for 12 weeks does not alter the lipid profile of treated rats, and does not lead to steatosis. We observed extensive variability with respect to the length of exposure and concentration of fructose used.
Our data suggest that exposure time and concentration of fructose are capable of promoting modulations in feeding and drinking behavior, as well as in animal body mass. They clearly show changes in the biochemical profiles and redox status, and hence, the fructose concentrations, exposure times, and interactions between these two parameters have a significant effect on the metabolic parameters that lead to the development of NAFLD.

