


 Custom services
 English (pdf)
 Article in xml format
 Article references
 Send this article by e-mail
 Cited by SciELO
  Cited by Google
  Similars in
SciELO
Similars in
SciELO  Similars in Google
 Permalink
INTRODUCTION
It is well known that being physically active at a young age has a myriad of benefits (1), where reduction of risk of chronic diseases in later years is particularly important (2). Since physical fitness presents a measurable set of characteristics of an individual closely related to its ability to perform physical activity, it is not surprising that a growing body of evidence indicates that low levels of physical fitness in schoolchildren are associated with increased risk of cardio-metabolic diseases, all-cause mortality, and a variety of physiological and psychological problems (3). Therefore, identifying individuals with low levels of physical fitness and forehand intervention through their engagement in physical activities could be an effective protective measure for health risk factors regardless of age, gender, ethnicity, and socioeconomic factors (4).
Although there is no unified approach in the selection of physical fitness tests, how frequently they should be conducted, or how should the standards be constructed, there is general agreement that regular monitoring of physical fitness contributes to the formation of age- and gender-related norms, education of children and parents regarding the importance of being fit and prescription and evaluation of individual exercise programs (5). Moreover, when incorporated and systematically conducted within the education system through physical education (PE) classes, it becomes a powerful tool in building national/international strategies for a healthy population (6).
Measurement of activity amount and intensity is conducted mainly through indirect or direct assessment of energy consumption (7). Even though direct measurements (i.e., activity monitors, pedometers, heart rate monitors, doubly labeled water, and indirect calorimetry), offers more accurate data regarding the amount of physical activity (8), due to high expenses, limited ability to collect data over wider periods of time, and usually small samples available for these types of measurements, validated questionaries are more suitable for the collection of data on the larger scale. It has been shown that the Physical Activity Questionnaire developed for children (PAQ-C) and adolescents (PAQ-A) enables reliable assessment of the type, frequency, and duration of children's physical activity (9).
Based on the presumed close relationship between physical activity and physical fitness, it seems reasonable to expect that being physically active would result in sufficient physical fitness levels. However, due to the tremendous number of factors affecting both constructs, the relationship between physical activity and fitness is not so plausible and needs deeper exploration (10). Surprisingly, a literature review on this issue in the school-age population shows a lack of publications addressing this topic.
An additional issue that makes it difficult to generalize the relationship between physical activity and fitness in schoolchildren is the diversity of activities involved, in both qualitative and quantitative manner. Namely, the sport-related organized activities available for schoolchildren, widely vary in frequency, duration, and intensity and therefore in metabolic costs (12). Furthermore, engagement in specific sports could favor only particular components of physical fitness (13). Finally, age and other factors (i.e., social, economic, demographic, cultural) could also affect the relationship between physical activity and fitness in schoolchildren (14), making it challenging to explore and explain.
Having all these in mind, we performed a study aimed to explore: a) the potential variation in physical activity level across the gender, school grade, and nutritional status; and b) the effects of physical activity levels, gender, and nutritional status on physical fitness test outcomes. We hypothesized that the activity of schoolchildren will decline with age and nutritional status and that physically active children will achieve better scores in all physical fitness tests, regardless of nutritional status. We expect that our findings will provide some new insights toward understanding the factors which affect the relationship between physical fitness, activity, and nutritional status in schoolchildren and motivate further research on this topic.
MATERIAL AND METHODS
SUBJECTS
Within a wider national study, 5409 (2795 male and 2614 female) participants, 5th-8th grade (11-14 years old) students of 19 elementary schools from the Belgrade region, participated in the study. In terms of age distribution, there were 1438 (26.6 %) students in fifth grade, 1363 (25.2 %) in sixth, 1298 (24.0 %) in seventh, and 1310 (24.2 %) students in eighth grade. During the study, all participants were healthy and regularly participated in physical education classes. The parents or legal guardians gave their written consent for all participants. The study protocol adhered to the tenets of the Declaration of Helsinki, and the Ethical Committee of the School of Medicine, University of Belgrade, approved it (2650/IV-5, dated 10 April 2018).
MEASUREMENTS AND TESTING
Physical Activity Questionnaire for Adolescents
To assess the physical activity (PA) level of subjects we administered the Physical Activity Questionnaire for Adolescents (PAQ-A) (15). The PAQ-A is an 8-item, self-administered 7-day recall questionnaire designed and validated to assess the participation of adolescents in different physical activities during the school year and is not used for assessment of physical activity during school breaks. Each item has a joint 5-point Likert-type scale. We used the Serbian version of the PAQ-A (B38). On item 1 (spare time activity), the respondents assess the mean of all activities on the scale ranging between 1 (“no”) to 5 (“7 times or more”). On items 2 to 7 (physical education, lunch, right after school, evenings, weekends), the scale ranges from 1 (lowest activity response) to 5 (highest activity response). Item 8 targets the mean of all days, and the scale ranges from 1 (“none”) to 5 (“very often”). The last item, no. 9, is used to identify if the student had unusual activity during the previous week or was prevented from practicing physical activities. The overall PAQ-A score is derived from the first 8 items, while the last item is not included in the overall score. The internal consistency obtained here is 0.72 and is in line with previously reported data (9). Based on their overall scores, subjects were further classified into three groups (Low, Moderate and High Activity) using a K-means cluster analysis.
Anthropometric measurements
Body height was measured using a Seca 208 stadiometer (Seca Instruments Ltd., Hamburg, Germany). During the measurement, the subjects were barefoot, wearing only physical education garments. The subjects' task was to straighten their back as much as possible, put their heels together, and keeping their heads in the Frankfurt plane position. The results were read on a scale of a stadiometer headpiece with an accuracy of 0.1 cm.
Body mass was measured to the nearest 0.1 kg using the pre-calibrated weighing scale (Tanita Inner Scan Model BC-532, Tanita Europe GmbH., Sindelfingen, Germany). The scale was placed on a solid horizontal surface. The subjects were barefoot, wearing only physical education clothing. During the measurement, they were standing in an upright position in the center of the scale, looking straight ahead and remaining motionless until the measurement was completed. The readings were shown on the scale display and read by an examiner.
Body mass index (BMI) was calculated by dividing body mass in kilograms by body height in square meters (kg/m2). The classification of children on those being overweight or with obesity, was performed based on the approach developed by the Childhood Obesity Working Group of the International Obesity Task Force. Based on provided international gender and age-specific BMI cut-off points for children (16), those whose BMI corresponded to an adult BMI between 25 and 30 were considered as overweight, and children with a BMI corresponding to an adult BMI of ≥ 30 were categorized as obese.
Physical fitness testing
Evaluation of the health-related physical fitness was done using a battery of tests consisting of tests for flexibility, muscular strength (abdominal endurance strength, lower limb explosive strength, and upper body strength and endurance), speed of movement, agility and coordination, and cardiovascular endurance.
To assess flexibility we used the Sit and Reach test. The subject was seated on the floor with both legs fully extended, shoulder-width apart, and feet placed flat against the box. The task was to slowly reach forward (without jerking), sliding the hands across the top of the ruler, and hold the final position for at least two seconds. A reach distance of 15 cm on the ruler corresponded with the position of the feet against the box. The better record (in cm) in two attempts was recorded (6).
To assess abdominal endurance strength we used the Sit-ups test. The subjects lied down in the supine position on a mat with their knees bent at 90 degrees and their feet flat on the floor, held down by the examiner. The hands were placed at the back of the head, with fingers interlocked. On the mark “Go!” the subject had to contact the knees with their elbows and return to the starting position as many times as possible in 30 s. The total number of repetitions completed in 30 s was recorded (6).
To evaluate lower-limb explosive strength we used the Standing Long Jump test. The subject stood behind the starting line and was instructed to push off vigorously and jump as far as possible. They had to land with the feet together and to stay in reached position, without falling. The distance was measured from the take-off line to the point where the back of the heel nearest to the take-off line lands on the floor. A further attempt was allowed if the subject fell or touched the floor with any other part of the body. The best record, measured in centimeters, in two attempts was recorded (6).
To evaluate upper-body muscle strength and endurance we used the Flexed (Bent) Arm Hang test, by timing how long someone can remain with the chin above a horizontal bar. The subject is assisted into position, the body lifted to a height so that the chin is level with the horizontal bar. The bar is grasped using an overhand grip with the hands shoulder width apart. The timing starts when the subject is released. They should attempt to hold this position for as long as possible. Timing stops when the person's chin falls below the level of the bar, or the head is tilted backward to enable the chin to stay level with the bar (6).
The test 4 x 10 m Shuttle Run test was used to measure speed of movement, agility, and coordination. Two parallel lines are drawn on the floor (with tape) 10 m apart. In the start line there is one sponge (B) and in the opposite line there are two sponges (A, C). When the start is given, the child (without sponge) runs as fast as possible to the other line and returns to the starting line with the sponge (A), crossing both lines with both feet. The sponge (A) is changed by the sponge B in starting line. Then go back running as fast as possible to the opposite line and change the sponge B by the C one and run back to the starting line (6).
To assess cardiovascular endurance we used 20-meter Shuttle Run test. All subjects were required to run between two lines 20 m apart with the time indicated with an audio signal. The initial speed of the signal was 8.5 km/h and was increased by 0.5 km/h/min (1 min equal to 1 stage). The test ended when subject stopped running due to fatigue or failed to reach the line before the next signal for two consecutive times. The time of the last completed lap was recorded, in seconds (6).
STATISTICS
Descriptive statistics (mean, SD, range) were calculated for all variables across genders and school grades. Before performing statistical analysis, all variables were checked for normality. In cases where necessary, an adequate transformation has been applied. However, for the final interpretation of the results, the data were back-transformed.
The chi-square test was performed to explore potential variations in the distribution of differently active children concerning age, school grade, and nutritional status. Differences in physical fitness test outcomes (Standing Long Jump test, sit-ups for 30 s, 20-meter Shuttle Run, Sit And Reach, 4 x 10 agility test, and hanging bent arms) between boys and girls of different activity levels (low, moderate, and high) were investigated using the three-way MANOVA with fitness test outcomes as dependent variables and gender, nutritional status, and activity levels as independent variables, followed by ANOVA and Bonferroni correction. All statistical analyses, except the LMS method, were performed using JASP computer software (Version 0.14.1). Statistical significance was set for all tests at the alpha level of 0.05. Please note that for each school grade and gender, individual fitness tests outcomes were converted to Z-values and then further to percentiles using the LMS statistical method (B44). Calculation of Z-values and power transformation (calculating lambda-Box Cox transformation parameter by maximizing the profile log-likelihood of a linear model fitted to the corresponding variable) was applied using R with RStudio (17) and the “Forecast” package (18).
RESULTS
Descriptive statistics for all variables are presented in table I. The distribution of children of different activity levels across nutritional statuses, school grades, and genders are presented in figure 1. The distribution of high, moderate, and low activity children among boys and girls was different (χ2 [2, n = 5017] = 151.4, p < 0.01), where 14 % of boys and 22 % of girls were low-activity, while 29 % of boys and 16 % of girls were highly active.
Table I. Descriptive statistics of applied physical fitness tests (mean [standard deviation] and range [minimum-maximum])


Figure 1. Distribution of low, moderate, and high activity in boys and girls across grades and relative to their nutritional status
The distribution also varied across grades (χ2 [6, n = 5409] = 90.4, p < 0.01)— whereas the percentage of high activity was highest in 5th grade (27 %) and lowest in 8th grade (19 %), the percentage of low activity was lowest in 5th grade (13 %) and highest in 8th grade (25 %), being more prominent in girls (14 % with low activity in 5th and 33 % in 8th grade; 23 % highly active in 5th and 9 % in 8th grade) than in boys (12 % with low activity in 5th and 18 % in 8th grade; 30 % highly active in 5th and 27 % in 8th grade).
Using Pillai's trace in MANOVA, there was a significant effect of gender (V = 0.009, F [6, 3669] = 5.29, p < 0.01), nutritional status (V = 0.193, F [12, 7340] = 65.16, p < 0.01) and physical activity levels (V = 0.043, F [12, 7340] = 13.60, p < 0.01) on physical fitness test outcomes, with no interactions among them. Further separate univariate ANOVAs revealed significant treatment effects of nutritional status and activity levels on all dependent variables (except for activity levels on Sit And Reach), while a significant effect of gender was only detected on sit-ups for 30 s (Table II).
Table II. Main effects obtained through ANOVAs (F and corresponding p values), and effect size measures (η², eta squared) for applied physical fitness tests

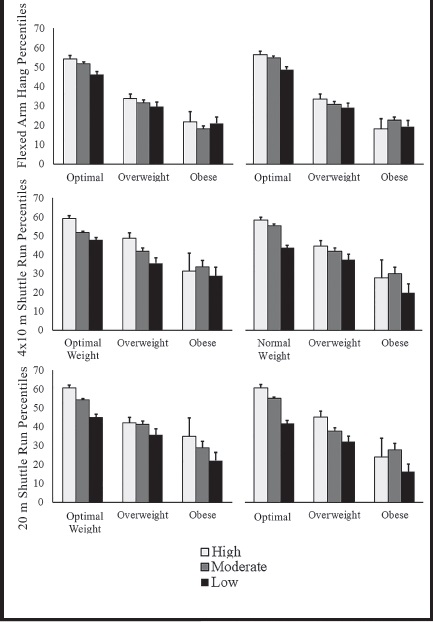
Finally, a post hoc analysis indicated that children with higher activity levels and optimal weight achieved better scores in almost all physical performance tests, while being overweight or obese had the highest effect on the tested outcomes (Fig. 2).

Figure 2. Test outcomes (percentiles) for boys and girls (mean [SE]), averaged across school grades and relative to nutritional status.
DISCUSSION
The study aimed to explore the potential variation in physical activity level across the genders, school grades, and nutritional statuses, and the effect of physical activity level, gender, and nutritional status on physical fitness test outcomes. Our results revealed that activity level declines with age and nutritional status, particularly in girls and children with obesity. Specifically, the decline in physical activity in boys was present due to a decline in boys with overweight and particularly with obesity, while the proportion of activity levels in optimal-weight children was stable across the school grades. However, in girls the fall in physical activity was recorded regardless of nutritional status. In addition, physically active, optimal-weight children achieved higher scores in most physical fitness tests, while children with obesity achieved lower scores regardless of their physical activity levels relative to nutritional status.
Due to its apparent importance for health status, schoolchildren's physical activity and fitness have attracted interest from researchers and practitioners for decades (1). Although differences in physical activity assessment methodology, variation in age groups covered, and sample size make comparing the outcomes difficult, most studies have registered a decline in physical activity with age, and boys are more active than girls (19). In addition, in their systematic review, Jiménez-Pavón and coworkers (20) reported that consistent negative associations between physical activity and nutritional status were observed. Therefore, it is not surprising that findings in our study revealed that the Serbian older schoolchildren, particularly girls, are less active than their younger counterparts. This trend is most prominent in children with overweight and obesity.
The main findings of our study are: a) with respect to physical activity and nutritional status, boys and girls scored similarly in all tests; b) nutritional status had the highest impact on the physical fitness tests (except for Sit And Reach test), whereas c) even highly active children with overweight and obesity scored lower than scarcely active, optimal-weight children. The first one was expected since we used relative data (percentiles) for comparison, keeping in mind that the structure of physical fitness is invariant over gender and age (21). However, previous studies exploring gender differences in physical fitness, using mainly absolute values, have reported higher scores in boys than girls, except for the Sit And Reach test (22,23). The findings regarding the effect of nutritional status on physical performance tests revealed that for both boys and girls, in tests of muscle fitness, agility, and cardiorespiratory fitness, optimal-weight children achieved higher scores than children with overweight or obesity. These findings are also in line with studies from other countries (24-27).
The most important finding of our study is that in all tests (except for Sit And Reach) highly active, but overweight and particularly obese children have achieved lower scores when compared to little active, optimal-weight counterparts. Previous studies investigating the relationship between fitness and nutritional status reported that more active children were likely to be relatively fit and lean (50) and that their performance on fitness tests was positively associated with organized physical activities, but not with their participation in non-organized physical play outside school (28). Furthermore, fitness was a stronger correlate and could better predict obesity than physical activity (26), while the nutritional status of boys and girls was inversely related to fitness and activity (29). However, a study on eight- and nine-year-old schoolchildren reported that daily physical activity and participating in organized sports activities strongly correlated with nutritional status and positively associated with children's physical fitness. It should be noted that although these studies contributed to a better understanding of the relationship between activity, nutritional status, and fitness, the differences in their sample size, age group observed, and methodologies applied do not allow generalization of the presented findings. In addition, the interaction between nutritional status and activity and their effect on physical fitness scores has attracted less attention. Therefore, results those high active children with overweight and particularly obesity achieve lower scores than low active, optimal-weight children deserve further attention and question the traditional approach of assessing muscular and cardiorespiratory fitness. Namely, it is well known that the outcome of muscle strength and power tests, as well as tests of cardiorespiratory fitness, are confounded with body dimensions (30-33), whereas most of the test batteries assessing physical fitness in schoolchildren consist of tasks resulting in scores that do not account for body size. Consequently, children with higher body mass could be penalized because the tests mentioned above consist of tasks where they must perform more work to achieve equal outputs than their optimal-weight counterparts.
When interpreting our results, certain limitations should be taken into consideration. Firstly, physical activity was assessed using a questionnaire and providing a summary activity score, without caloric expenditure or specific frequency, time, and intensity information. Thus, not being able to directly assess activity levels could have an impact on the current findings. However, it has been proved that PAQ-A represent the valid and reliable measure of general physical activity levels when applied on a large-scale sample in school settings (15,34). Another limitation originates from the study's cross-sectional design, not allowing us to draw any conclusions regarding developmental trends or causal relationships. Nevertheless, the large sample size, the methods of study sample selection, as well as the standardized protocols and the qualified measurers guarantee the validity and usability of the revealed data. With this in mind, we believe that the findings presented here are a valuable contribution to a better understanding of the interplay between children's physical fitness, activity, and nutritional status, and the attempts to emphasize the importance of monitoring physical fitness at an early stage when prevention measures could be more effective in suppressing health risk problems.
CONCLUSION
Our study has shown that activity level in Serbian schoolchildren, particularly girls, declines with age, and that this decline is affected by nutritional status. In addition, nutritional status represents a significant factor confounding physical fitness scores, regardless of activity levels. Future studies with data regarding caloric expenditure or specific frequency, time, and intensity information measurement, as well as controlling other potential contributing factors (i.e., diet, genetic predisposition, environment), should elucidate the complex relationship of physical activity with fitness and nutritional status.
WHAT DOES THIS ARTICLE ADD?
This is the first study exploring: a) variations in Serbian schoolchildren's physical activity with age and nutritional status; and b) physical activity and nutritional status on physical fitness scores. It provides evidence that, like in other countries, physical activity in Serbian schoolchildren declines with age. In addition, the findings that nutritional status has a stronger influence on physical fitness scores than physical activity, pose essential questions. Namely, the traditional approach when assessing muscular fitness and aerobic capacity tests in school settings does not account for body size. Therefore, children with overweight and obesity due to higher body mass, could be penalized in these tests since they have to do more work to achieve an equal output than their optimal-weight counterparts. Potential clarification of this issue could be considering reevaluation of the current approach in the assessment of physical fitness by introducing body size-independent physical fitness tests.

