


 Serviços customizados
 Inglês (pdf)
 Artigo em XML
 Referências do artigo
 Enviar este artigo por email
 Citado por SciELO
  Citado por Google
  Similares em
SciELO
Similares em
SciELO  Similares em Google
 Permalink
INTRODUCTION
Autosomal dominant polycystic kidney disease (ADPKD) is an inherited and systemic disease characterized by bilateral kidney cysts which progressively cause nephron loss and end-stage renal disease (1). The normal parenchyma is replaced by numerous fluid-filled cysts (2), and the total kidney volume (TKV) becomes enlarged bilaterally (3). The enlarged kidneys take up more space in the abdomen and cause abdominal distension. An increased prevalence of obesity in patients with ADPKD has been shown in some studies (4-8). A recent study of kidney transplant patients with ADPKD found overweight and obesity ratios of 31.4 % and 24.3 %, respectively (9). In addition, the rate of kidney transplantation in patients with ADPKD is high, and body mass index (BMI) is an important factor for the exclusion or inclusion criteria of transplantation (10). Obesity increases the risk of kidney disease in the general population and negatively affects the progression of kidney disease in patients with kidney-related diseases (11). It is also an independent risk factor for the development and progression of chronic kidney disease (CKD) (12) and end-stage renal disease (13,14). Obesity is one of the risk factors for rapid ADPKD progression (15-17) and has been associated with an increase in TKV and a decline in glomerular filtration rate (8).
Kidney patients should be routinely evaluated with anthropometric measurements to determine the degree of obesity (18). Examples of such measurements are BMI and the triceps, biceps, subscapular, and suprailiac skinfold thicknesses (SFT). Waist circumference (WC) and waist to hip ratio (WHR) are used to determine abdominal obesity (i.e., visceral fat) (19). Skinfold thickness evaluates subcutaneous fat and is not sensitive to changes in visceral fat (20). BMI is affected by variable factors such as muscle mass, sex, ethnicity, age, and health status. It has been reported that SFT, WHR, and multifrequency bioelectrical impedance analysis are superior to BMI in measuring body fat in patients with CKD (21). However, previous studies on patients with ADPKD reported that WHR and WC may be affected by the presence of enlarged kidneys and unfortunately, ADPKD is associated with abdominal obesity (22,23). The study hypothesis was that WC and WHR, which are used in the evaluation of obesity in the general population, are not correct evaluation methods in patients with ADPKD due to the presence of bilaterally enlarged kidneys.
The primary objectives of this study were to investigate the accuracy of WC and WHR in the evaluation of abdominal obesity in patients with ADPKD by comparisons with MRI data, and the secondary objectives were to investigate the associations of energy and macronutrient intake with WC and WHR.
METHODS
STUDY DESIGN AND PARTICIPANTS
This was a cross-sectional cohort study conducted at a nephrology outpatient clinic from April to July 2014. An offer to participate was extended to a total of 312 patients consecutively diagnosed with ADPKD at the clinic between April and July of 2014. Sixty adult patients accepted to participate in the study and were included. ADPKD was diagnosed from family history and imaging methods according to Ravine criteria. Patients were followed up at the same center. The cohort was used for the doctoral thesis entitled “The relationship between anthropometric measurements and diet & renal functions on patients with autosomal dominant polycystic kidney disease” (24).
Patients who were pregnant, had chronic liver or lung disease, hyperthyroidism, active infection, malignancy, malnutrition, or used drugs that could affect cyst volume (tolvaptan, rapamycin, lithium, etc.), or were receiving renal replacement therapy were excluded.
ETHICAL APPROVAL
The study was approved by the ethics committee of the hospital (research registration: 112), and conducted according to the Declaration of Helsinki guidelines. After being fully informed about the study, participants voluntarily signed a consent form prior to study start.
DATA COLLECTION AND PROCEDURES
Patient age, sex, duration of qualifying ADPKD diagnosis, presence of comorbidities (diabetes mellitus, hypertension, ischemic heart disease) were collected through face-to-face interviews.
ANTHROPOMETRIC MEASUREMENTS
All measurements were performed by the same trained researcher. Measurements were made three times and the mean value was calculated. Height was measured to the nearest 0.5 cm using a stadiometer. Body weight was measured to the nearest 0.1 kg using an electronic scale. This measurement was repeated twice, and the mean value was calculated. BMI (kg/m2) was calculated as weight (kg) divided by the squared height (m2). The participants were divided into two groups, non-obese (BMI < 30 kg/m2) and obese (BMI ≥ 30.0 kg/m2) according to the World Health Organization (WHO) BMI-based classification (25).
To measure the hip circumference, the researcher stood beside the patient, and the measurement was made with a non-elastic measure under the crista iliaca and at the widest portion of the hip. To measure the waist circumference, the midpoint between the lowest rib and the crista iliaca was marked and the circumference was measured at this height with a non-elastic measuring tape. The patients were divided into two groups with WC < 88 cm versus ≥ 88 cm for women, and WC < 102 cm versus ≥ 102 cm for men, according to the WHO WC-based classification method. WHR was calculated by the formula, WHR = (waist circumference, cm)/(hip circumference, cm). The patients were divided in two groups with WHR < 0.85 versus ≥ 0.85 for women and WHR < 0.90 versus ≥ 0.90 for men according to the WHO WHR-based classification method (26).
When measuring the upper middle arm circumference (UMAC), the arm was bent 90° at the elbow, the midpoint between the acromial protrusion on the shoulder and the olecranon protrusion on the elbow was marked, and the circumference was measured with a measuring tape. Triceps, biceps, subscapular, and suprailiac SFT were measured with a Holtain skinfold caliper. When measuring the triceps SFT, the patients stood upright, the left arm was bent 90° at the elbow, the midpoint between the acromion and olecranon protrusions was marked, the arm was released, the layer was held with the left index finger and thumb, and the measurement was made at the marked place with a caliper. Biceps and triceps SFT were measured by placing a mark on the cubital fossa in the anterior part of the middle arm. To measure the subscapular SFT, the inferior corner of the left scapula bone was marked and the layer was held at an angle of 45° to the spinal cord. Suprailiac SFT was measured by placing a marker on the midaxillary line 2 cm above the iliac bone (27).
BIOCHEMICAL PARAMETERS
Complete blood count was analyzed by a Sysmex XT 1800i device (ROCHE-2011, Kobe, Japan) and biochemical parameters (glucose, urea, uric acid, creatinine, C-reactive protein, prealbumin, albumin, total protein, aspartate aminotransferase, alanine aminotransferase, total cholesterol, low density lipoprotein cholesterol, high density cholesterol, triglycerides, sodium, potassium, calcium, phosphorus, and ferritin) were analyzed by a COBAS 8000 device (ROCHE-2007, Tokyo, Japan) the morning after an overnight fast.
Urine protein and creatinine levels were analyzed in fresh midstream urine collected in the morning on the first outpatient visit. The protein to creatinine ratio in urine specimens was measured by dividing urine protein by urine creatinine, both measured in the same concentration units.
The estimated glomerular filtration rate (eGFR) was calculated using the Creatinine Equation published by The Chronic Kidney Disease Epidemiology Collaboration (CKD-EPI) (28).
The equation is:

SCr (standardized serum creatinine) = mg/dL (to convert to mmol/L, multiply by 0.0884).
eGFR (estimated glomerular filtration rate) = mL/min/1.73 m2; Scr = standardized serum creatinine (mg/dL); κ = 0.7 if female or 0.9 if male, α = -0.329 if female or -0.411 if male, min = the minimum of Scr/κ or 1; max = the maximum of Scr/κ or 1; age = years.
CALCULATION OF KIDNEY VOLUME AND TOTAL SUBCUTANEOUS AND INTRAPERITONEAL ADIPOSE TISSUE FROM MRI DATA
MRI scans were acquired with a gradient strength of 48 mT on a 1.5-T ACHIEVA NOVA MRI system (Philips, The Netherlands). The imaging protocols were: 16-channel XL-TORSO body coil, 4-mm slice thickness, T2, T1, and fat-suppressed T2, and continuous sections in the transverse and frontal planes over the entire abdominal region. Images were processed with an Extended MR Workstation (4.2.3.2) and an Extended Brilliance Workspace workstation (3,2,1,2; Philips) running on CT viewer workstations. Post-processing was performed with Hounsfield-intensity tissue separation and the manual staining method. The volumes of bilateral polycystic kidneys were calculated in cm3 (mL). Total subcutaneous and intraperitoneal adipose tissue volumes were calculated from fat areas in slices between the xiphoid process and pubis, passing through the L2-3 and L4-5 intervertebral discs, respectively. Abdominal slices from the xiphoid process to the pubis were included in the calculation of total subcutaneous fat tissue. The workstation software separated the adipose tissue from other tissues by making use of the Hounsfield difference of the adipose tissue, whose boundaries were determined by the automatic painting program. The measured tissue amount is given in cm³. Since the density of fat and water are very similar, they were directly converted to liters (L). For the determination of intra-peritoneal adipose tissue, solid organs and intestinal structures were manually traced and removed, to ensure that only fat remained.
EVALUATION OF DIETARY INTAKE
Food consumption records for three days (two weekdays and one weekend day) were collected to determine the dietary intakes of the patients. Initially, patients trained with a dietitian on how to self-record food consumption using supporting materials such as photographs and replicas of various foods. After training, dietary intakes were recorded by the participants for 3 days, and the records were collected by a dietitian.
All dietary analyses were performed by a dietitian. Daily intakes of energy and macronutrients were calculated from the diet record data using the nutrition information system Ebispro for Windows, Turkish Version 2010 (BeBiS 7.2), which contains composition data on food and drink from the U.S. Department of Agriculture, the Diyetturk Nutrient Database, and the German Food Code and Nutrient Database (29). Standardized recipes and values were used when the dietary records were ambiguous (30). When a food was unavailable from a dietary database, a new food was added to the software based on the composition data on the food package.
STATISTICAL ANALYSIS
Statistical analysis was performed with the IBM SPSS Statistics for Windows, version 20.0 package (31). Categorical variables were given in numbers and percentages, and numerical variables were given as mean ± standard deviation if homogeneous and as median (interquartile range: 25 %-75 %) if nonhomogeneous. The Kruskal-Wallis test was used to evaluate the distributions. When the participants were grouped according to the BMI-based WHO classification, a Mann-Whitney U-test was used for parametric data and a chi-square test was used for non-parametric data. The relationships between the variables were investigated using Pearson's correlation test. Linear regression analysis was used for multivariate analysis of data related to the WC and WHC measures in women and men. A p-value < 0.05 was considered statistically significant.
RESULTS
This study was performed on 60 adult patients with ADPKD; 38 (63.3 %) were women and 25 (41.6 %) were obese. The numbers of patients in CKD stages 1, 2, 3, 4, and 5 were: 14 (23.3 %), 13 (21.7 %), 16 (26.7 %), 12 (20 %), and 5 (8.3 %), respectively.
Table I shows the general characteristics of the patients, broken down by the BMI-based classification of obese versus non-obese. The diabetes mellitus ratio was higher in the obese group than in the non-obese group. Age, sex, duration of qualifying ADPKD diagnosis, hypertension ratio, and ischemic heart disease ratio were similar in the two groups.
Table I. General characteristics of the patients according to their body mass index.
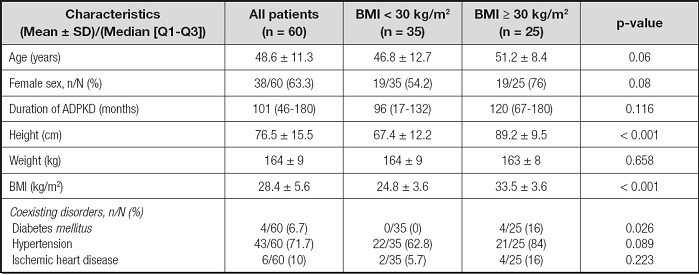
BMI: body mass index; ADPKD: autosomal dominant polycystic kidney disease. p-value was obtained from the Mann-Whitney U-test for parametric data, and the Chisquare test for non-parametric data.
Clinical characteristics such as laboratory findings, kidney function, and TKV are shown in table II. C-reactive protein was higher in the obese group (p = 0.001). Kidney functions, TKV, and laboratory findings were similar in the two groups. Table III shows anthropometric measurements of patients according to BMI. Women and men in the obese group had higher WC, TSF, TIF, UMAC, and triceps, biceps, subscapular, and suprailiac SFT values when compared with the non-obese group. However, WHR in obese versus non-obese men was similar. Women in the obese group had higher WHRs than those in the non-obese group (p = 0.034). In the all-patients group, the WHRs of obese and non-obese patients were similar.
Table II. Clinical characteristics of the patients according to their body mass index.
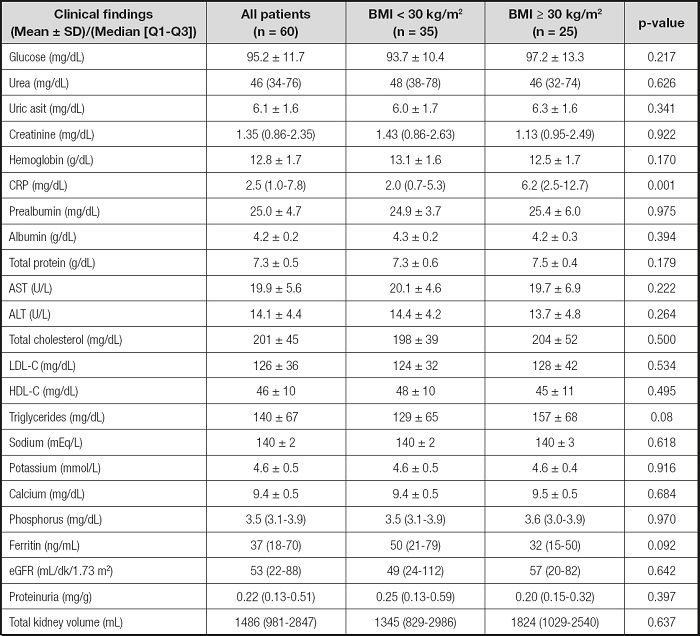
BMI: body mass index; CRP: C-reactive protein; AST: aspartate aminotransferase; ALT: alanine aminotransferase; eGFR; estimated glomerular filtration rate; HDL-C: high density lipoprotein cholesterol; LDL-C: low density lipoprotein cholesterol. p-value was obtained from the Mann-Whitney U-test for parametric data, and the Chisquare test for non-parametric data.
Table III. Anthropometric characteristic of the patients according to their body mass index.
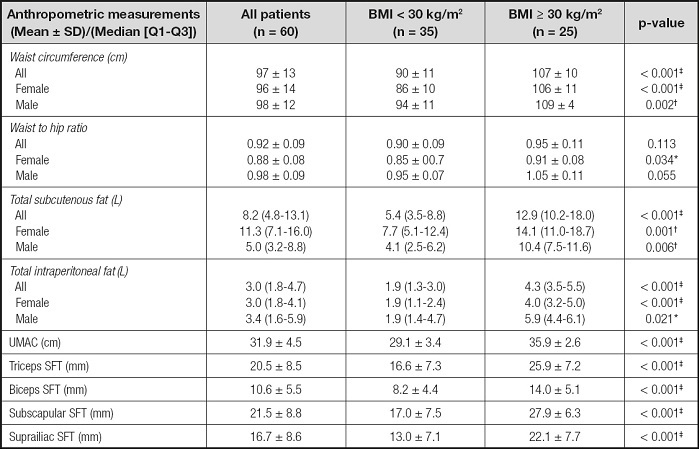
BMI: body mass index; UMAC: upper middle arm circumference; SFT: skinfold thickness.
*p-value < 0.05;
†p-value < 0.01,
‡p-value < 0.001, obtained from the Mann-Whitney U-test for parametric data, and the Chi-square test for non-parametric data.
Table IV shows daily energy and macronutrient intakes stratified by the BMI, WC, and WHR classifications. Although the percentage of dietary fat in obese patients was higher than non-obese patients, the dietary fat percentages of groups with and without abdominal obesity according to WC and WHR were similar (p = 0.017, 0.285, and 0.837, respectively). The percentage of dietary fat was positively correlated with TSF and BMI, and there was no correlation between dietary fat and either WHR or WC. Pearson's correlation analysis of the anthropometric measurements, kidney function, total kidney volume, and daily intakes of energy and macronutrients are given in table V. WHR was negatively correlated with eGFR and positively correlated with age, TKV, UMAC, biceps, triceps, subscapular, and suprailiac SFT in all patient groups. WC was negatively correlated with eGFR and positively correlated with TIF, TSF, and BMI in all patient groups. TKV was positively correlated in all patients only with WHR. There was no correlation between TKV and other anthropometric measurements such as BMI, TIF, or TSF. While TKV was positively correlated with WC and WHR in women, no such correlation was observed in men (Fig. 1).
Table IV. Daily energy and macronutrient intakes calculated through the 3-day food records according to body mass index, waist circumference, and waist-to-hip ratio classifications in patients.

*p-value < 0.05,
†p-value < 0.01,
‡p-value < 0.001, obtained from the Mann-Whitney U-test for parametric data, and the Chi-square test for non-parametric data.
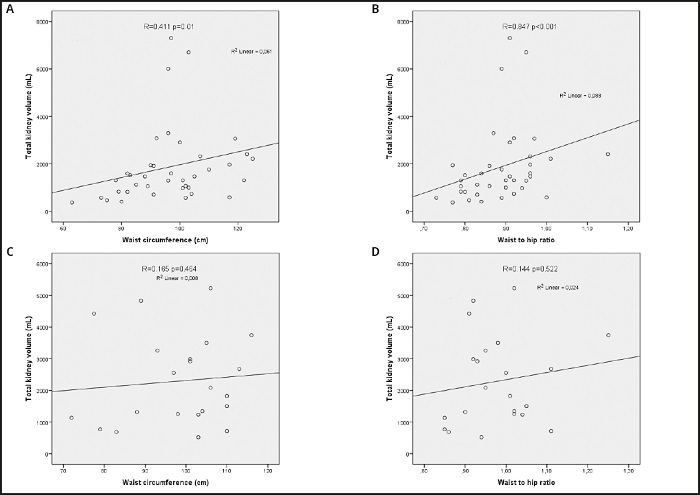
Figure 1. Correlation analysis between waist circumference, waist-to-hip ratio and total kidney volume of the patients with autosomal dominant polycystic disease recruited to a cross-sectional study investigating the feasibility of anthropometric measurements for evaluation of abdominal obesity. A. Correlation analysis between waist circumference and total kidney volume of women. B. Correlation analysis between waist-to-hip ratio and total kidney volume of women. C. Correlation analysis between waist circumference and total kidney volume of men. D. Correlation analysis between waist-to-hip ratio and total kidney volume of men.
Table V. Correlation matrix between anthropometric measurements, kidney function, total kidney volume, daily intakes of energy, and macronutrients in the patients.

eGFR: estimated glomerular filtration rate; TKV: total kidney volume (mL) from magnetic resonance images; TSF: total subcutenous fat (L); TIF: total intraperitoneal fat (L); BMI: body mass index; CHO: carbohydrate; WC: waist circumference (cm); WHR: waist-to-hip ratio; UMAC: upper middle arm circumference (cm); SFT: skinfold thickness. p-values obtained from Pearson's test.
*Correlation is significant at the 0.05 level; †Correlation is significant at the 0.01 level.
Table VI shows the results of the multivariate analysis of the independent parameters affecting WC and WHR stratified by sex. In the linear regression analysis, BMI, TKV, and UMAC were factors affecting WC in women; BMI, TKV, biceps and UMAC were factors affecting WHR in women. Age was the only factor affecting WHR in men. Age and UMAC were factors affecting WC in men.

DISCUSSION
In this single-center, cross-sectional study the accuracy of WC and WHR for the evaluation of obesity in adult patients with ADPKD was investigated. The WHR values of obese versus non-obese men were found to be similar. Total kidney volume was positively correlated with WC and WHR in women. In the multivariate analysis, TKV was an independent factor affecting WC and WHR in women. With age, the number of cysts in patients with ADPKD increases and TKV becomes enlarged bilaterally (3). Enlarged kidneys take up more space in the abdomen and cause abdominal distension. Therefore, while WC and WHR can be used to determine abdominal obesity in the general population, they may not be the accurate for evaluation of obesity in patients with ADPKD. It has been reported that SFT, WHR, and multifrequency bioelectrical impedance analysis are superior to BMI for measuring body fat in patients with CKD (21). The Reasons for Geographic and Racial Differences in Stroke Study (REGARDS; 2011) reported that WC alone reflects abdominal obesity, especially when applied with BMI in adults with CKD (32). Previous studies on patients with ADPKD reported that WHR and WC may be affected by the presence of enlarged kidneys, and that ADPKD is associated with abdominal obesity (22,23). In a study comparing ADPKD patients with control groups, WHR was found to be significantly higher, and WC was almost 3 cm greater in the ADPKD group (22). A six-year follow-up of that study found a significant increase in weight, BMI, and WC, and a significant decrease in eGFR in the ADPKD group. In addition, the follow-up study showed that the ADPKD group had higher rates of obesity when compared to the control group (23). Another previous study suggested that overweight and obesity may have a significant impact on the progression of ADPKD. Obesity was associated with an increase in TKV and a decline in eGFR. The percentage increase in TKV was associated with increases in BMI (8). In the current study, 25 of 60 patients (41.6 %) were obese. Moreover, WHR was negatively correlated with eGFR and positively correlated with TKV in patients with ADPKD.
The acceptable macronutrient distribution ranges (AMDRs) were determined by the Institute of Medicine, which has developed AMDRs for macronutrients, carbohydrates, fat, and protein intake. Excessive consumption of macronutrients above the AMDR limit has the potential to increase the risk of chronic disease or cause inadequate intake of essential nutrients (33). In Turkey, the AMDRs were determined by the Ministry of Health. The AMDR for carbohydrates is 45-60 %, for fat is 20-35 %, and for protein is 10-20 % of energy intake for Turkish adults (34). In this study, when daily energy intake (kcal/day) was examined, neither the obese nor the non-obese group showed excessive values. The percentage of dietary energy from fat exceeded the AMDR in the all-patients group, but the carbohydrate and protein ratios were within the AMDR limits.
In the present study, obese patients had a significantly higher percentage of dietary energy from fat than did non-obese patients. The percentages of dietary energy from fat in the high-WC group and in the high-WHR group were similar to those in the normal-WC and normal-WHR groups. These results suggest that the percentage of dietary energy from fat may not be associated with high WC or high WHR. Similarly, in a previous study in which body fat and lean mass were measured with dual-energy X-ray absorptiometry and abdominal and hepatic fat were measured by computed tomography, the macronutrient content of the diet was not found to cause any changes in abdominal fat or hepatic fat (35).
The results of this study raise the question of which anthropometric measurements should be used to determine abdominal obesity in women with ADPKD. The results suggested that WC and WHR may not be an accurate anthropometric measurement for evaluating abdominal obesity in women with ADPKD, and that the percentage of dietary energy obtained from fat may be unrelated to either WHR or WC.
This study has several limitations. Our data are limited to a single center, and therefore may not be generalizable to other centers. Since this study is designed cross-sectionally, causal inferences cannot be made. Sample size was small, participants were Caucasian only, and there was no control group. Moreover, a three-day food consumption record may not be reflective of the usual intake. The strengths of our study include investigating the accuracy of WC and WHR measurements for the evaluation of obesity in ADPKD by comparisons with MRI data, SFT, and UMAC.
More research is needed to investigate optimal methods for evaluating obesity in patients with ADPKD. Future research should evaluate the accuracy of the anthropometric measurements used to determine obesity in patients with ADPKD in other cohorts, including cohorts representative of other races and geographical regions.
CONCLUSIONS
In women with ADPKD, total kidney volume was positively correlated with waist circumference and waist-hip ratio, and an independent factor affecting waist circumference and waist-hip ratio. Therefore, WC and WHR may not be accurate anthropometric measurements for the evaluation of abdominal obesity in women with ADPKD.

