


 Servicios personalizados
 Inglés (pdf)
 Articulo en XML
 Referencias del artículo
 Curriculum ScienTI
 Enviar articulo por email
 Citado por SciELO
  Citado por Google
  Similares en
SciELO
Similares en
SciELO  Similares en Google
 Permalink
Dear Editor,
The literature reveals associations between anti-seizure medications (ASM) and metabolic and nutritional changes, mineral and vitamin deficiencies, changes in energy expenditure and consumption, and weight gain in patients with epilepsy (1,2). Investigations in this area, especially in connection with epileptic patient’s assessment of 25-hydroxyvitamin D (25[OH]D) levels and anthropometric measurements nutrition have recently been published (3,4). Obesity and higher 25-hydroxyvitamin D (25[OH]D) deficiency levels in patients with epilepsy (3) have been reported.
In view of this background and considering the vast experience accrued in the Neurology Service of a large university hospital in the state of São Paulo, Brazil, where we operate, after evaluating and treating patients with epilepsy and outpatient clinic patient follow-up, a research project was developed starting in the year 2020 with the purpose of investigating extensively these patients’ different nutritional and metabolic aspects. The project was approved by the Ethics and Research Committee of the Institution.
Hence, we developed a pilot study to investigate the relationship between 25-hydroxyvitamin D (25[OH]D) levels and nutritional status using anthropometric measurements in patients with epilepsy undergoing routine outpatient follow-up, and to assess vitamin D levels and the prevalence of malnutrition or obesity. This is a preliminary study carried out with thirty-two (n = 32) adult epileptic patients, aged over 18 years, who were in regular routine outpatient follow-up at the Neurology Service with a closed diagnosis of epilepsy, and who were not receiving 25-hydroxyvitamin D (25[OH]D) supplementation. All data were collected and evaluated during patient care. Blood samples were collected for the assessment of serum 25-hydroxyvitamin D (25[OH]D) levels. For the interpretation and classification of 25-hydroxyvitamin D (25[OH]D), the international guidelines (3,5) and cutoff points established in the past by the Brazilian Society of Endocrinology (5,6) were used. Blood concentration of 25-hydroxyvitamin D (25[OH]D) was assessed in the laboratory of the hospital’s neurology service. The competitive chemiluminescent immunoassay method was used in the analysis.
For the nutritional status assessment anthropometric indicators such as body weight, body mass index (BMI), arm circumference (AC), triceps skinfold (TSF), arm muscle circumference (AMC), and calf circumference (CC) were used. BMI was classified according to the cut-off points set by the WHO (7). The body composition parameters AC, TSF and AMC were classified according to the reference values of percentile distribution established by Frisancho (1990) (8). CC was evaluated according to the recommendations of the WHO (7). All indicators were assessed according to standardized procedures. In the analysis of these data, for the comparison of proportions the chi-square test or Fisher’s exact test was used, when necessary. For the comparison of continuous measures between 2 groups, the Mann-Whitney test was applied, and for 3 groups the Kruskal-Walllis test. To evaluate the relationship between numerical variables Spearman’s linear correlation coefficient was used. The significance level adopted for the statistical tests was 5 %.
In this preliminary assessment based on 32 patients, the patients’ mean age was 49.91 ± 16.00 years; 53.1 % (n = 17) were female and 46.9 % (n = 15) were male. The mean values of their nutritional anthropometric indicators were: BMI = 29.37 ± 6.52 kg/m2, AC = 32.95 ± 5.47 cm, TSF = 22.50 ± 9.71 mm, AMC = 25.88 ± 4.24 cm, and CC = 39.38 ± 5.45 cm. The mean serum levels of 25-hydroxyvitamin D (25[OH]D) were 23.33 ± 11.12 ng/ml (median = 21.20 ng/ml; minimum = 9.58 ng/ml; maximum = 48.20 ng/ml). According to the cutoff points established by the Brazilian Society of Endocrinology, 40.6 % (n = 13) patients had levels below 20 ng/ml and 78.1 % (n = 25) below 30 ng/ml.
The prevalent age range was between 40 and 60 years (53.1 %); 25 % of patients were under 40 years of age and 21.9 % were over 60. Based on BMI, 75 % (n = 24) patients were overweight, 21.9 % (n = 7) had an adequate body weight, and 3.1 % (n = 1) had low body weight. In the analysis of the variables studied and the comparison between genders and between age groups no statistical differences were observed (p > 0.05). There was also no statistical difference between the variables age, gender and anthropometry with 25-hydroxyvitamin D (25[OH]D).
Finally, in the evaluation of the relationship between anthropometric indicators and 25-hydroxyvitamin D (25[OH]D) levels, using Spearman’s linear correlation coefficient no significant linear correlation between variables and 25-hydroxyvitamin D (25[OH]D) (Table I) was found. There was also no linear correlation between anthropometric indicators and 25-hydroxyvitamin D (25[OH]D) when stratified by gender.
Table I. Correlation between 25-hydroxyvitamin D (25[OH]D) and anthropometric indicators in the total group of patients with epilepsy (n = 32).
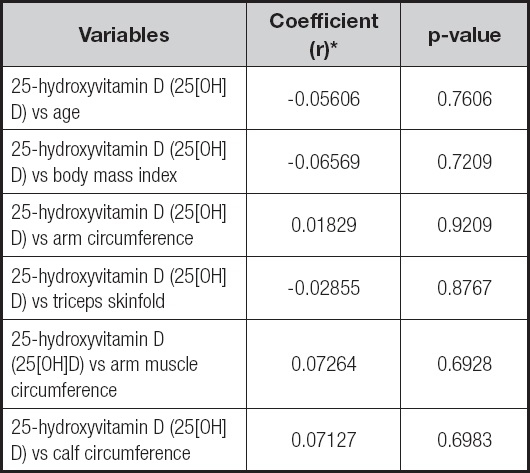
*Spearman´s Correlation Coefficient, p < 0,05.
The data found in our investigation showed high rates of overweight and obesity and mid values of 25-hydroxyvitamin D (25[OH]D) (21.20 ng/ml), although no relationship between these indicators of nutritional status and 25-hydroxyvitamin D (25[OH]D) was observed. Perhaps this is due to the small sample size, as this was a preliminary analysis in our investigation. The prevalence of patients with reduced levels of 25-hydroxyvitamin D (25[OH]D) and the prevalence of overweight and obesity are noteworthy, although no statistical association was observed between these two conditions, considering all the nutritional indicators evaluated. Patients whose 25-hydroxyvitamin D (25[OH]D) levels were below 20 ng/ml had BMI = 30.47 ± 6.72 kg/m2 (p = 0.4200) and CC = 39.85 ± 5.76 cm (p = 0.6580), although both indicators were without statistical significance.
Deficiency of 25-hydroxyvitamin D (25[OH]D) in obese individuals is well documented in the literature, and there are reports indicating a reduction in vitamin D levels in people with obesity and that this situation may not always reflect a clinical condition (9); the supplementation of vitamin D remains a therapeutic option for individuals with this vitamin deficiency (10). A recent cohort study (4) on 25-hydroxyvitamin D (25[OH]D) deficiency in 92 subjects with epilepsy investigated the 25-hydroxyvitamin D (25[OH]D) deficiency risk factors and drug influence. The study showed that 79.3 % of patients had abnormal levels: 56.5 % (14) had levels of deficiency similar to those found in our study. The studies further showed that statistically significant risk factors for vitamin D deficiency were: number of antiepileptic drugs, treatment with antiepileptic drugs, reduced sun exposure, high BMI and high frequency of epileptic seizures (4). The higher BMI values found in those studies in patients with 25-hydroxyvitamin D (25[OH]D) deficiency is another interesting factor that corroborates our findings.
Our study showed that there was no association between 25-hydroxyvitamin D (25[OH]D) levels and nutritional anthropometric indicators, and point out the need for further investigation for the development of future guidelines of nutritional changes in patients with epilepsy.

