Custom services
 English (pdf)
 Article in xml format
 Article references
 Send this article by e-mail
 Cited by SciELO
  Cited by Google
  Similars in
SciELO
Similars in
SciELO  Similars in Google
 Permalink
INTRODUCTION
Liver function damage can be caused by various factors, such as viruses, drugs, heavy metals, and immune factors. Recently, the prevalence of liver function damage in adolescents has increased, resulting in an increasing burden for the health care system (1). Unexplained childhood hepatitis has been rampant in many countries, which can lead to elevated transaminases, including alanine aminotransferase (ALT) and aspartate aminotransferase (AST). Additionally, the incidence of nonalcoholic liver disease in American adolescents increased 2.7-fold from 1988 to 2010 (2). However, liver impairment in adolescents is often overlooked, possibly due to a lack of routine physical examination and insufficient attention to adolescent health, leading to delays in diagnosis and intervention. Therefore, it is crucial to better understand the potential risk factors for liver function damage, especially in adolescents.
Iron is an essential metal element in our body, and ferritin, an iron storage protein, is essential for cellular iron homeostasis. Ferritin can sequester excess intracellular iron and store it in a redox-inactive form. In addition to iron status, systemic ferritin levels are important indicators of immunological and inflammatory disorders (3,4). Aberrant iron homeostasis or iron distribution may be involved in liver dysfunction, so serum iron may be a potential marker for liver function (5,6). Several studies have indicated that high levels of serum ferritin may be associated with liver diseases in adults (7,8). Additionally, a previous study showed an independent association between elevated serum ferritin and elevated ALT in Korean children and adolescents (9), and another study indicated that serum ferritin was corelated with liver fat in male adolescents with obesity (10). However, a meta-analysis showed that the connection between serum ferritin and non-alcoholic steatohepatitis against non-alcoholic fatty liver group in pediatric or adolescent populations was inconsistent with adults (11). Therefore, the correlation between serum ferritin levels and liver function in adolescents remains to be further explored since different populations, such as those from different countries or with different states, may affect the results. The present study aims to investigate the association of serum levels of ferritin and iron with liver transaminases (serum ALT and AST) using a representative sample of adolescents from the National Health and Nutrition Examination Survey (NHANES).
METHODS
STUDY POPULATION
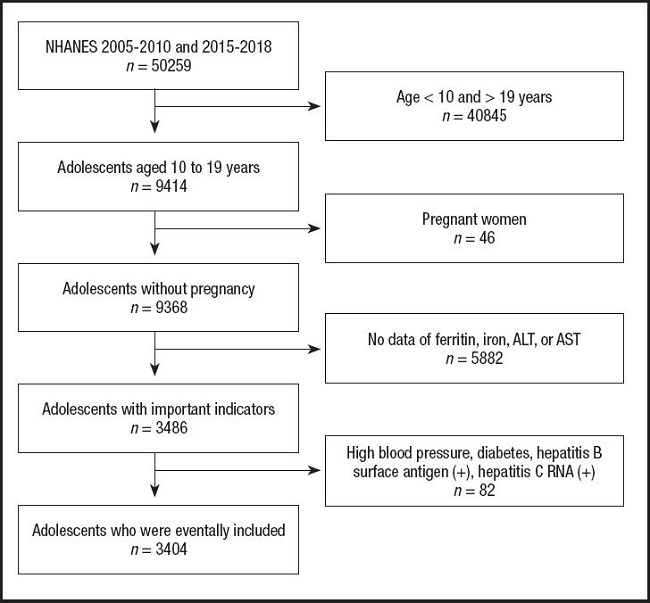
The present study included adolescents aged ten to 19 years old from NHANES 2005-2010 and 2015-2018. NHANES is a cross-sectional survey that provides a large amount of information about nutrition and health of the United States population, and its details have been previously described (12). The present study is a cross-sectional analysis which was approved by the Ethical Review Committee of the National Center for Health Statistics. After excluding those whose age did not meet the requirements, those who were pregnant, those without the necessary data, and those with high blood pressure, diabetes, hepatitis B surface antigen (+) or hepatitis C RNA (+), a total of 3,404 adolescents were eventually included in the present study (Fig. 1).
EXPOSURE AND OUTCOME VARIABLES
The exposure variables are serum ferritin and iron, and the outcome variables are ALT and AST. According to the NHANES, serum ferritin was measured using the Roche/Hitachi 912 clinical analyzer in 2005-2008, the Roche Elecsys®170 clinical analyzer in 2009-2010 and 2015, and the Roche Cobas®e601 in 2016-2018. Iron concentration was measured by a timed-endpoint method using the Beckman Synchron LX20 or Beckman UniCel®DxC800 Synchron in 2005-2010 and 2015-2016, and measured using the Roche Cobas®6000 (c501 module) analyzer in 2017-2018. In this method, the system monitors absorbance changes at 560 nm at fixed-time intervals and these changes in absorbance are proportional to the iron concentration. The activity of serum ALT and AST was measured by an enzymatic rate method or a kinetic rate method using the Beckman Synchron LX20 or the Beckman UniCel®DxC800 Synchron. The system monitors absorbance changes at 340 nm at fixed-time intervals and these changes in absorbance are proportional to the activity. According to the guidelines from the North American Society for Pediatric Gastroenterology, Hepatology, and Nutrition (NASPGHAN), ALT ≥ 26 U/l in male adolescents and ≥ 22 U/l in female adolescents were defined as elevated ALT, and AST ≥ 37 U/l was defined as elevated AST. More details are available from http://www.cdc.gov/nchs/nhanes/.
OTHER COVARIABLES
Several covariates were included as potential confounders, including age, body mass index (BMI), race (Mexican American, other Hispanic, non-Hispanic white, non-Hispanic black, and other races), education (less than high school, high school or equivalent, and more than high school), family income-poverty ratio (< 1, ≥ 1 and < 3, ≥ 3, and unknown), and smoking exposure. Therein, the smoking exposure was reflected by serum cotinine levels: a cotinine level below the detection limit was defined as “unexposed”, a cotinine level between the detection limit and 10 ng/ml was defined as “low-exposure”, and a cotinine level ≥ 10 ng/ml was defined as “high-exposure” (13). Additionally, participants with high blood pressure, diabetes, hepatitis B surface antigen (+), and hepatitis C RNA (+) were excluded. Therein, high blood pressure and diabetes were defined as positive responses to the questions “Have you been told by a doctor or other health professional that you had hypertension, also called high blood pressure?” and “Have you ever been told by a doctor or health professional that you have diabetes?”, respectively. Hepatitis B surface antigen was measured by an immunometric immunoassay using the VITROS™ HBsAg Reagent Pack and VITROS™ Immunodiagnostic Products HBsAg Calibrator on the VITROS™ ECi/ECiQ Immunodiagnostic Systems and the VITROS™ 3600 Immunodiagnostic System, or an AUSZYME Monoclonal test. The quantitation of hepatitis C virus RNA was performed using the COBAS®AMPLICOR®HCV MONITOR Test on the COBAS®AMPLICOR®Analyzer. A detailed description of these methods can be found on the NHANES.
STATISTICAL ANALYSIS
NHANES sample weight was used to calculate all estimates. The continuous variables were expressed as the mean ± standard deviation and the categorical variables were expressed as number (percentage). Weighted linear regression models or weighted Chi-squared tests were used to evaluate the differences of indicators between different groups. Weighted multivariate linear regression models were used to estimate the association of the levels of serum ferritin and iron with ALT and AST. Multivariate logistic regression models were used to investigate the association of serum ferritin and iron with elevated ALT and elevated AST. Packages R (http://www.R-project.org) and EmpowerStats software (http://www.empowerstats.com) were used for all of the data analyses. Statistical significance was set at p< 0.05.
RESULTS
CHARACTERISTICS OF THE PARTICIPANTS
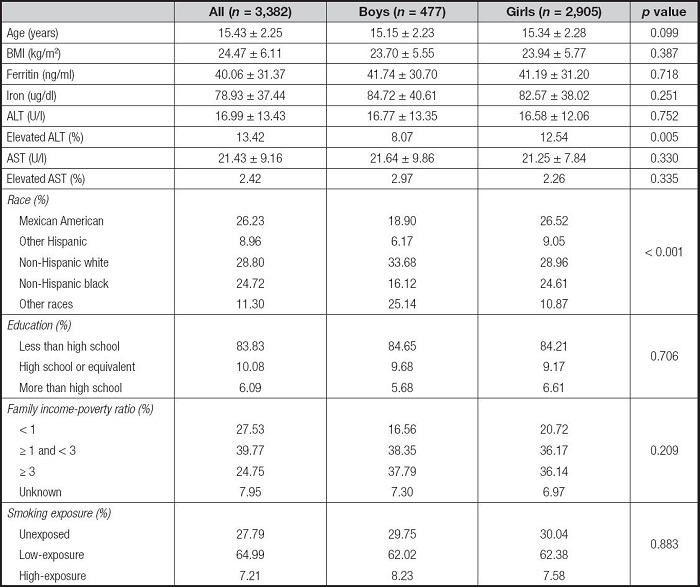
A total of 3,404 adolescents, including 480 boys and 2,924 girls, were eligible for the present study. Table I shows the characteristics of the study population. The population included 26.23 % Mexican Americans, 8.93 % other Hispanics, 28.76 % non-Hispanic whites, 24.79 % non-Hispanic blacks, and 11.28 % other races. There were no statistical differences in basic characteristics between boys and girls, except for race.
Table I. Characteristics of the study population.

Mean ± SD for continuous variables: p values were calculated by weighted linear regression model; (%) for categorical variables: p values were calculated by weighted Chi-squared test. All p values were used for comparisons between different genders. ALT: alanine aminotransferase; AST: aspartate aminotransferase; BMI: body mass index.
RELATIONSHIPS BETWEEN SERUM FERRITIN LEVEL AND ALT AND AST
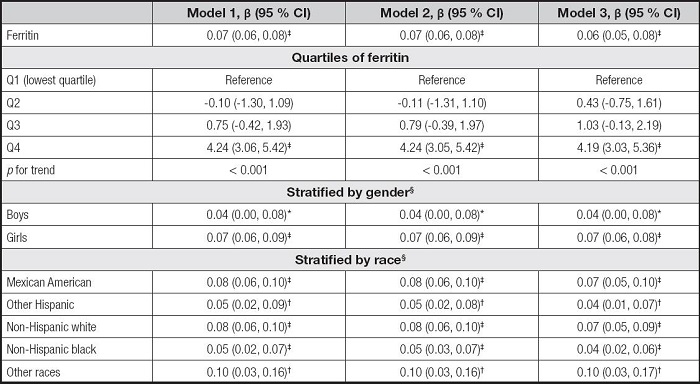
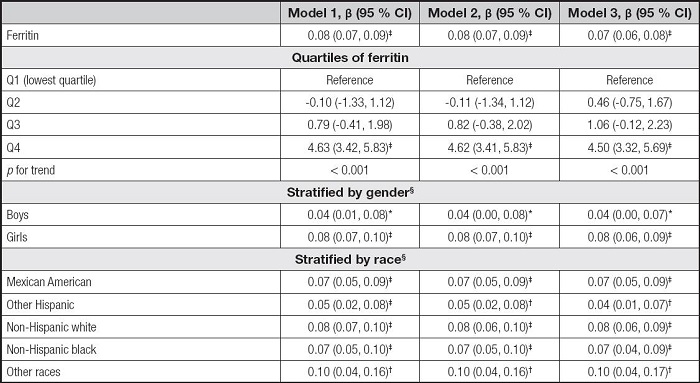
We built three models in the multivariate regression analyses: model 1 (unadjusted), model 2 (adjusted for gender, age, and race), and model 3 (adjusted for gender, age, race, education, family income-poverty ratio, BMI, and smoking exposure). According to the results in table II, the serum ferritin levels were positively correlated to ALT in the model 1 (β = 0.08, 95 % CI: 0.07-0.09, p< 0.001), the model 2 (β = 0.08, 95 % CI: 0.07-0.09, p< 0.001), and the model 3 (β = 0.07, 95 % CI: 0.06-0.08, p< 0.001). Then, we obtained the quartiles of ferritin levels (first quartile: 20.00 ng/ml, second quartile: 33.70 ng/ml, and third quartile: 53.00 ng/ml) and divided the ferritin levels into Q1, Q2, Q3, and Q4. We found that the pfor trend was less than 0.001 in the three models, but only the Q4 of ferritins and ALT levels showed significant positive correlations (p < 0.001). In the subgroup analyses, the associations of serum ferritin with ALT remained positive in all genders and races.
Table II. Association between serum ferritin and ALT.
* p < 0.05,
†p < 0.01,
‡p < 0.001.
Model 1 was not adjusted. Model 2 was adjusted for gender, age, and race. Model 3 was adjusted for gender, age, race, education, family income-poverty ratio, BMI, and smoking exposure.
§In the subgroup analyses stratified by gender or race, the model was not adjusted for the stratification variables themselves.
ALT: alanine aminotransferase; BMI: body mass index; CI: confidence interval.
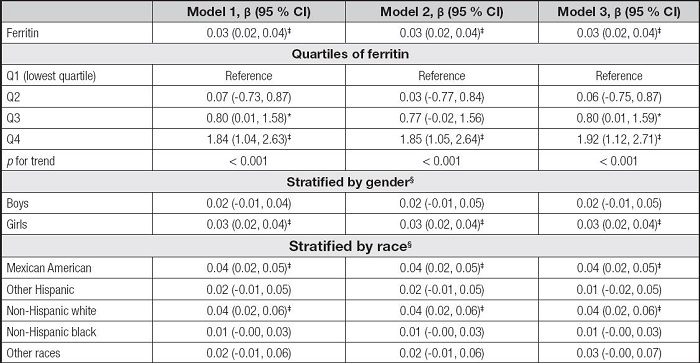
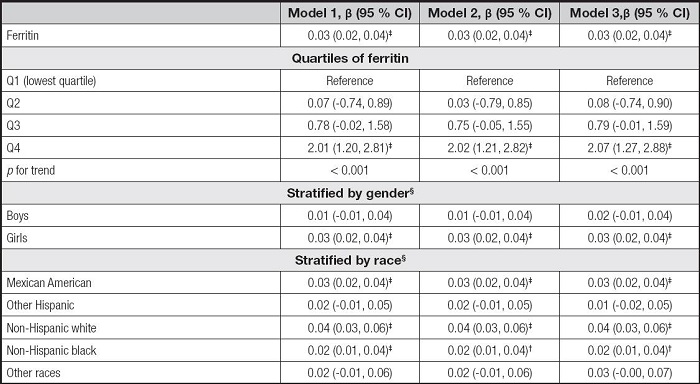
Table III shows the association between serum ferritin and AST. The serum ferritin levels were also positively correlated to AST levels in the three models (β = 0.03, 95 % CI: 0.02-0.04, p < 0.001). For ferritin quartiles, also only the Q4 was positively correlated with AST levels (p < 0.001). However, the associations of serum ferritin with AST remained positive only in girls and some races, including Mexican American, non-Hispanic white, and non-Hispanic black, in the subgroup analyses.
Table III. Association between serum ferritin and AST.
* p < 0.05,
†p < 0.01,
‡p < 0.001.
Model 1 was not adjusted. Model 2 was adjusted for gender, age, and race. Model 3 was adjusted for gender, age, race, education, family income-poverty ratio, BMI, and smoking exposure.
§In the subgroup analyses stratified by gender or race, the model was not adjusted for the stratification variables themselves.
AST: aspartate aminotransferase; BMI: body mass index; CI: confidence interval.
RELATIONSHIPS BETWEEN SERUM IRON LEVEL AND ALT AND AST
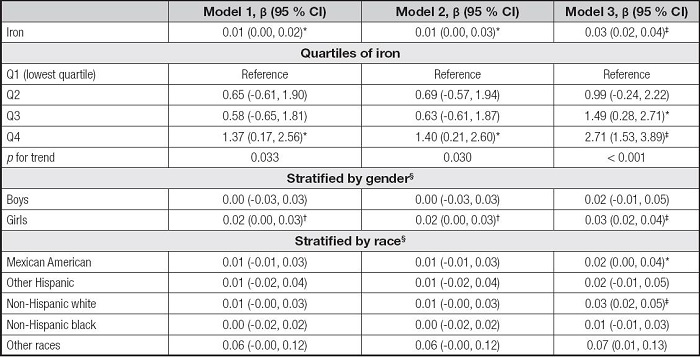
As shown in table IV, the serum iron levels were positively correlated to ALT in the model 1 (β = 0.01, 95 % CI: 0.00-0.02, p< 0.05), the model 2 (β = 0.01, 95 % CI: 0.00-0.03, p< 0.05), and the model 3 (β = 0.03, 95 % CI: 0.02-0.04, p< 0.001). The Q4 of iron levels and ALT levels also showed significant positive correlations in the three models and all the pfor trend were less than 0.05. In the subgroup analyses, the associations of serum iron with ALT remained positive in the girls, but there were few significant associations across race stratification.
Table IV. Association between serum iron and ALT.
*p < 0.05,
†p < 0.01,
‡p < 0.001.
Model 1 was not adjusted. Model 2 was adjusted for gender, age, and race. Model 3 was adjusted for gender, age, race, education, family income-poverty ratio, BMI, and smoking exposure.
§In the subgroup analyses stratified by gender or race, the model was not adjusted for the stratification variables themselves.
ALT: alanine aminotransferase; BMI: body mass index; CI: confidence interval.
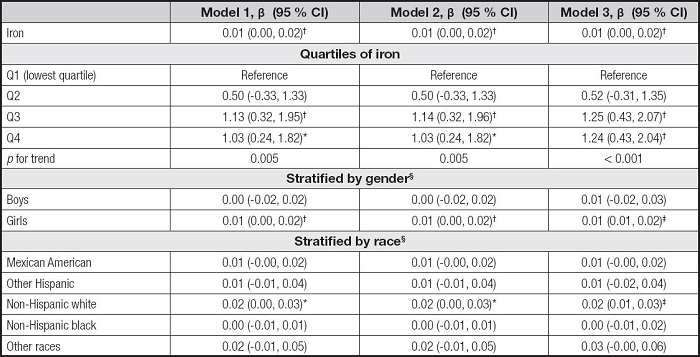
Table V shows the association between serum iron and AST. The serum iron levels were also positively correlated to AST levels in the three models (β = 0.01, 95 % CI: 0.00-0.02, p< 0.01). For iron quartiles, the Q3 and Q4 were positively correlated with AST levels in the three models, and the pfor trend was 0.005, 0.005, and < 0.001, respectively. The associations of serum iron with AST remained positive only in the girls and the non-Hispanic white in the subgroup analyses.
Table V. Association between serum iron and AST.
*p < 0.05,
†p < 0.01,
‡p < 0.001.
Model 1 was not adjusted. Model 2 was adjusted for gender, age, and race. Model 3 was adjusted for gender, age, race, education, family income-poverty ratio, BMI, and smoking exposure.
§In the subgroup analyses stratified by gender or race, the model was not adjusted for the stratification variables themselves.
AST: aspartate aminotransferase; BMI: body mass index; CI: confidence interval.
RELATIONSHIPS BETWEEN SERUM FERRITIN, IRON, ELEVATED ALT AND ELEVATED AST
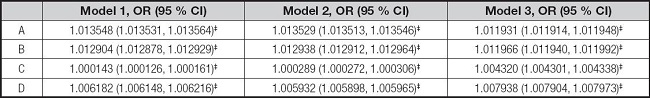
Whether it is serum ferritin or iron, their levels were positively correlated with elevated ALT and elevated AST in the three models according to the results of binary logistic regression analysis (Table VI).
Table VI. Associations between serum ferritin, iron, elevated ALT and elevated AST.
*p < 0.05,
†p < 0.01,
‡p < 0.001.
A: serum ferritin and elevated ALT. B: serum ferritin and elevated AST. C: serum iron and elevated ALT. D: serum iron and elevated AST. Elevated ALT: ALT ≥ 26 U/l in male adolescents and ≥ 22 U/l in female adolescents. Elevated AST: AST ≥ 37 U/l. Model 1 was not adjusted. Model 2 was adjusted for gender, age, and race. Model 3 was adjusted for gender, age, race, education, family income-poverty ratio, BMI, and smoking exposure. ALT: alanine aminotransferase; AST: aspartate aminotransferase; BMI: body mass index; CI: confidence interval.
SMOOTH CURVE FITTINGS AND SENSITIVITY ANALYSIS
We used smooth curve fittings to characterize the associations of serum ferritin, iron, ALT, and AST (Fig. 2). Overall, serum ferritin and iron levels were positively correlated with ALT and AST levels. However, in the relationships between ferritin and ALT and AST (Fig. 2Aand B), the curve showed a slight downward slope when the ferritin concentration reached about 200 ng/ml. According to the World Health Organization (WHO) recommendations, the upper limit of normal for serum ferritin could be set to 200 ng/ml (14). Therefore, we performed a sensitivity analysis by excluding 22 subjects with serum ferritin > 200 ng/ml from the original population. Characteristics of the new population (n = 3,382) are shown in the supplementary table I. Through the same methods, we found that the main results remained the same basically about the associations between serum ferritin, ALT, AST, elevated ALT, and elevated AST in the sensitivity analysis (Supplementary Tables II III–IV), reflecting the robust of the present results.

Figure 2. Associations between serum ferritin, iron, and liver transaminases. A. Serum ferritin and ALT. B. Serum ferritin and AST. C. Serum iron and ALT. D. Serum iron and AST. Solid red line represents the smooth curve fit between variables, and blue bands represent the 95 % CI from the fit. Gender, age, race, education, family income-poverty ratio, BMI, and smoking exposure were adjusted. ALT: alanine aminotransferase; AST: aspartate aminotransferase; BMI: body mass index; CI: confidence interval.
DISCUSSION
Since the prevalence of liver disease in adolescents has increased recently, it is necessary to explore more risk factors of liver function and better understand the involved mechanisms to protect the liver health of adolescents. In the present study, we investigated the associations between serum ferritin, iron, and liver transaminases using NHANES data.
Recently, associations between serum ferritin levels and liver diseases have been investigated. For example, a cross-sectional study indicated that serum ferritin levels may be related to advanced liver fibrosis in treatment-naive autoimmune hepatitis (8). Yang et al. (7) found that American adults with non-alcoholic fatty liver disease had higher serum ferritin levels. Additionally, Yan et al. (15) found that serum ferritin levels were associated with non-alcoholic fatty liver disease in middle-aged and older patients with type 2 diabetes. However, it is still necessary to explore the relationship between serum ferritin and liver function in adolescents since different countries or populations may affect the results. Although a previous study, including 150 male pediatric patients, had indicated that serum ferritin levels were correlated with magnetic resonance imaging (MRI) liver fat, visceral adipose tissue content, ALT, and AST levels in male adolescents with obesity (10), the associations between serum ferritin, iron, and liver transaminases remained unclear due to the limited subjects or others. The present study included 3,404 adolescents from NHANES and indicated that serum ferritin and iron levels were positively associated with serum ALT and AST levels, as well as the elevated ALT and elevated AST in adolescents, which provides further evidences that serum ferritin and iron may be potential biomarkers for liver damage.
A positive association was found between serum ferritin and ALT in all genders, but only remained positive in girls between serum ferritin and AST. Additionally, the positive correlations kept present among girls between serum iron and ALT or AST. These results suggest that the relationship between ferritin or iron and liver transaminases differs by sex and this relationship may be more sensitive in girls. Aigner E et al. (16) found a significant correlation of body iron stores and anthropomorphic features of the metabolic syndrome in male students, and additionally found that fasting insulin levels and insulin resistance were related to both ALT levels and soluble transferrin receptor/ferritin in female students. Other study suggested that iron overload is associated with insulin resistance in men, but not in women (17). These studies support our findings that sex may affect the association of iron status and other markers, but the mechanisms are still unknown. Notably, physiological iron status may differ between men and women, and iron deficiency as well as iron overload affect them differently (18). Endocrine changes associated with adolescence may also represent a potential link (16). Additionally, genetic and lifestyle factors, such as dietary habits in different regions or populations, may influence the relationship between them (17). Further studies are required to investigate the pathophysiologic mechanisms by which increased serum ferritin/iron levels are associated with liver transaminases in different genders.
Notably, patients with non-alcoholic fatty liver disease had higher serum ferritin level which was positively associated with liver fat, and had lower hepatic and systemic insulin sensitivity and β-cell function (19). The abovementioned studies demonstrated a hyperferritinemia in patients with various liver diseases, which may be due to hepatic inflammation and adiponectin as a marker of insulin resistance. Additionally, serum iron was commonly elevated in some liver diseases, such as non-alcoholic fatty liver disease, which is also known as metabolic abnormality iron overload syndrome (7). These phenomena may be associated with metabolic derangements or reactive metabolic inflammation. When hepatic iron deposition occurs, iron could catalyze the formation of toxic hydroxyl radicals, which mediate cellular damage (10). However, the potential mechanisms underlying these phenomena still need to be further explored.
In the present study, we have considered several possible confounding factors, including gender, age, race, education, family income-poverty ratio, BMI, and smoking exposure. However, we could not fully consider all potential confounding factors, such as alcohol drinking, since this is a retrospective study and the database has limited variables. We also could not infer a causal relationship between serum ferritin and iron levels and liver transaminases because this is a cross-sectional study. We need to further clarify their relationship and its underlying mechanisms through prospective studies and laboratory studies. Additionally, the results of this study may be highly relevant to the American adolescents because we used nationally representative samples from NHANES. Therefore, further studies are required to investigate these associations in other populations.
CONCLUSIONS
Based on the NHANES data, it was found that serum ferritin and iron were positively correlated to ALT and AST. The association between serum ferritin and ALT remained positive in all genders and races, and remained positive in girls and several races between serum ferritin and AST. The positive correlations kept present among girls between serum iron and ALT, and also kept present among girls and non-Hispanic whites between serum iron and AST. Serum ferritin and iron levels were also positively correlated to elevated ALT and elevated AST. Further studies are required to confirm the exact relationships between serum ferritin, iron, and liver transaminases, and the underlying mechanisms.
Ethics approval and consent to participate:
Ethical approval was not provided for this work on human participants because the data were from the NHANES database. Since NHANES is a publicly available dataset, the current study is exempt from approval by an institutional review board. Written informed consent to participate in this study was provided by the participants' legal guardian/next of kin.