


 Servicios personalizados
 Inglés (pdf)
 Articulo en XML
 Referencias del artículo
 Enviar articulo por email
 Citado por SciELO
  Citado por Google
  Similares en
SciELO
Similares en
SciELO  Similares en Google
 Permalink
INTRODUCTION
Crohn’s disease (CD) is an inflammatory bowel disease (IBD), typified by the presence of chronic inflammation throughout the gastrointestinal tract. It is reported that the incidence of CD in Asia has been increasing since 1990. Guangzhou, in mainland China, has the highest IBD incidence in Asia, followed by Hong Kong (1). Malnutrition is a common challenge in patients with CD, particularly in those with active disease. Inflammation of the digestive tract leads to pain, diarrhea, and nausea that, in turn, result in reduced food consumption, eventually affecting the nutritional status of the patient. Poor nutritional status is represented by weight loss, fatigue, anemia, and reduced immunity, amongst other symptoms. It is estimated that malnutrition occurs in between 20 % and 85 % of IBD patients (2). Nutritional status is usually evaluated by scales such as the Nutrition Risk Screening 2002 (NRS-2002) and the Patient-Generated Subjective Global Assessment (PG-SGA), as well as the BMI. A recent Chinese study using the NRS-2002 reported a 59.5 % incidence of malnutrition in CD patients (3), while another study using the PG-SGA estimated that 80.9 % of patients were malnourished (4). In addition, a systematic review concluded that close to one-third of CD patients have altered body composition (BC), seen as reductions in the BMI (5). The American Society of Parenteral and Enteral Nutrition (ASPEN) has proposed the use of specific parameters, including loss of weight, muscle mass, and subcutaneous fat, as well as handgrip strength, for diagnosing malnutrition (6). As shown by a recent systematic review, reduced muscle mass occurs in approximately 60 % of IBD patients (7). BC indicators such as reduced BMI and upper-arm circumference, amongst others, have been verified in CD patients who were also found to have reduced circumferences of the leg and mid-arm, as well as reduced mid-arm muscle, all of which improved significantly after nutritional treatment (8). The presence of active disease is defined by the Crohn’s disease activity index (CDAI) and using this measure, 7 % of hospitalized CD patients with high CDAI were found to have weight loss or malnutrition (9). CD remission is especially important in adolescents with CD to guarantee normal growth. Remission can be induced by nutritional treatment (10).
Leptin is a special kind of cytokine that is secreted largely by adipose tissue and regulates food consumption and the maintenance of energy homeostasis (11). Leptin induces hypothalamic signaling to reduce appetite and elevate the expenditure of energy; leptin levels are a reflection of both fat tissue mass and energy sufficiency (12). Reductions in adipose tissue in CD are reflected in lower levels of leptin and leptin also mediates the relationship between nutritional status and immune cell function (13). Both leptin and lipid levels are lower during malnutrition or fasting (14). It has been reported that more than 80 % of CD patients are malnourished at the time of diagnosis, often with inadequate levels of fat tissue, reduced energy intake, and deficiencies in many nutrients, including protein and fat; thus, treatment of malnutrition is of major importance in restoring growth in these patients (15). Several studies have found that blood cholesterol and triglycerides are lower than normal in CD, possibly the result of increased inflammation and oxidative stress (16). BMI was found to improve along with increased fat mass, which explains the impact of the lack of fat mass on nutrition in patients with CD (15). Several studies have suggested that leptin levels are reduced in CD patients and those with higher CDAIs (17-20). It is likely that TNF-α is the main cytokine involved in intestinal inflammation in CD, which is related to CDAI. TNF-α has been found to temporarily induce acute release of intracellular leptin pools and to reduce leptin synthesis during chronic inflammation, especially in patients with higher CDAIs (19). Studies have also shown that leptin concentrations levels rise in IBD patients after treatment with the anti-TNF-α drug infliximab (12). Thus, it is possible that circulating leptin levels in CD may be reduced by the increase in inflammation.
The relationship between leptin and nutritional status and inflammation suggests that leptin levels may be useful for the evaluation of disease activity in CD patients. Here, the association between circulating leptin levels and nutritional status was investigated, together with its ability to identify CD disease activity (represented by CDAI) in adults with CD.
METHODS
ETHICS STATEMENT
Permission from the Ethics Committee of the Guangdong Provincial People’s Hospital was obtained before the study (No. GDREC2018091H). The clinical trial registration number was ChiCTR1800015174. The study was conducted according to the principles of the Declaration of Helsinki and the participants provided informed written consent.
PARTICIPANTS
A total of 154 volunteers participated in the study: 77 CD patients and 77 healthy subjects. CD patients had been diagnosed but had not yet begun treatment. The CD diagnosis was based on standard clinical, endoscopic, histological, and cross-sectional imaging criteria (21). Patients were excluded from the study if they were younger than 18 years, or had one of the following diseases: unclassified enterocolitis; pregnancy or breastfeeding; alcohol or drug abuse; previous history of mental and emotional disorders; previous history of severe and chronic cardiovascular, respiratory, urinary, endocrine, reproductive, skeletal, muscular, neurological, and other systemic disorders. Disease activity was assessed by these clinical investigations and was expressed in terms of the CDAI score (22). CDAI scores over 150 indicated the presence of active CD while lower scores indicated quiescent CD or remission.
MEASUREMENTS
Anthropometric and BC assessments were performed in the morning after an 8-12 hours fast, and the same times of assessment were used for each participant. All assessments were conducted by the same investigator (SS).
Body weights were taken to the nearest 100 g with an electronic scale; participants were barefoot and wore minimum clothing. A stadiometer was used to measure height to the closest 0.1 cm, and BMI was determined as weight (kg)/height2 (m). BMI values less than 18.5 kg/m2 indicated malnutrition. The circumferences of the mid-arm and upper-arm muscle were measured with a measuring tape at the mid-point between the olecranon process and acromion on the right side. Skinfold thickness measurements were taken at the same position using Holtain skinfold calipers. Leg measurements included the circumferences of the thickest part and thinnest part of the calf, and the calf average measurement was calculated from three measurements. The NRS-2002 was used to assess nutritional risk, with scores ≥ 3 indicating nutritional risk (+) (23). Nutritional status was determined by PG-SGA, scores ≥ 4 indicating malnutrition.
Blood samples were collected between 07:00 and 08:00 after overnight fast and before treatment. The blood was collected into a heparin sodium tube and a normal tube (5 ml each). The anti-coagulated blood was centrifuged and the plasma stored at -80 °C. The coagulated samples were placed in a 37 °C water bath for 20-30 minutes, followed by centrifugation at 1,580 g for five minutes. Serum triglyceride and cholesterol concentrations were measured on a 7600-210 automatic biochemistry analyzer (HITACHI, Inc., Japan), using Synchron reagents provided by Leadmanbio (Beijing, China). Plasma levels of leptin and total ghrelin were determined by ELISA kits (eBioscience; BMS2039INST, USA, and Millipore, EZGRA-88K, USA, respectively).
STATISTICAL ANALYSIS
The statistical analysis was performed with SPSS version 22.0 (IBM Corp., Armonk, NY, USA). Normality of distribution was assessed using the Kolmogorov-Smirnov test. Normally distributed data were expressed as mean ± standard deviation (SD). The Wilcoxon signed-rank test was used for comparison of repeated measures and correlations between variables were assessed with the Spearman’s correlation coefficient. The discriminatory power of leptin between the groups was examined with receiver operating characteristic (ROC) curves. p-values < 0.05 were considered as statistically significant.
RESULTS
The anthropometric and biochemical parameters of the study subjects are listed in table I. BMI values were significantly greater in the control group than in the CD, active CD, and quiescent CD groups (24,5 ± 3.62 kg/m2 versus 18,31 ± 3.47 kg/m2, 17,76 ± 3.63 kg/m2, 18,9 ± 13.17 kg/m2, respectively, p < 0.05). The NRS-2002 and PG-SGA scores were significantly higher in the CD, active CD (with the highest scores), and quiescent CD groups than in the controls, while leptin levels were significantly lower in the active CD (985 ± 719 ng/ml), quiescent CD (1,060 ± 990 ng/ml), and, particularly, in the CD (1,025 ± 874 ng/ml) groups than in the controls (18,48 ± 1.222 ng/ml). The mean concentrations of ghrelin were significantly higher in the CD (5.04 ± 2.46 pg/ml), active CD (5.05 ± 2.84 pg/ml), and quiescent CD (5.02 ± 2.07 pg/ml) groups compared with the controls (2.25 ± 1.71 pg/ml). Nutritional status assessed by circumferences of the mid-arm, upper-arm muscle, lower leg, and triceps skinfold thickness was significantly reduced in the CD, active CD, and quiescent CD groups in comparison with the controls; the difference was especially marked for the active CD group. Triglyceride levels were significantly reduced in the CD (1.11 ± 0.47 mM) and active CD (0.92 ± 0.32 mM) groups than in the control group (1.75 ± 1.12 mM), while cholesterol levels were significantly lower in the CD (3.97 ± 2.83 mM), active CD (3.97 ± 3.79 mM), and quiescent CD (3.96 ± 1.04 mM) groups than in the controls (5.15 ± 1.09 mM).
Table I. Characteristics of the study subjects.
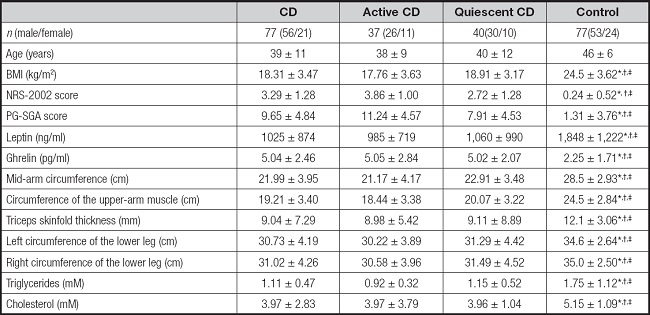
Results are expressed as mean ± SD.
BMI: body mass index; NRS-2002: Nutrition Risk Screening 2002; PG-SGA: Patient-Generated Subjective Global Assessment.
*Compared with CD, p < 0.05.
†Compared with active CD, p < 0.05.
‡Compared with quiescent CD, p < 0.05;
§Compared with control, p < 0.05.
Correlations of leptin with the different parameters are shown in table II. Leptin was negatively correlated with ghrelin in the CD (r = -0.702, p < 0.05), active CD (r = -0.634, p < 0.05), and quiescent CD (r = -0.714, p < 0.05) groups, as well as showing significant positive correlations with BMI in the CD (r = 0.670, p < 0.05), active CD (r = 0.654, p < 0.05), and quiescent CD (r = 0.653, p < 0.05) groups, while the relationship in the control group was non-significant (r = 0.320, p > 0.05). Leptin was also negatively correlated with NRS-2002 scores in the CD group (r = -0.325, p < 0.05). Indicators representing nutritional status (mid-arm circumference, circumference of upper-arm muscle, triceps skinfold thickness, and circumference of the lower legs) all showed positive correlations with leptin in the CD group. Triglyceride levels were positively associated with leptin in the CD (r = 0.435, p < 0.05) and quiescent CD (r = 0.488, p < 0.05) groups, while cholesterol levels were significantly related to leptin in the CD (r = 0.306, p < 0.05) and quiescent CD (r = 0.461, p < 0.05) groups.
Table II. Correlation of characteristics with leptin among different groups.
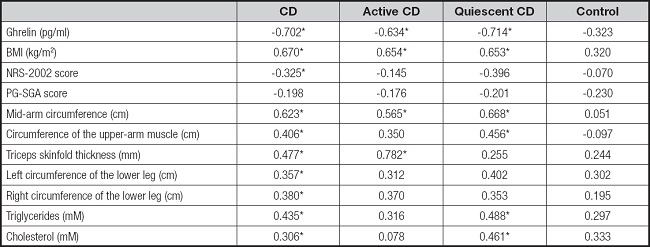
p < 0.05. BMI: body mass index; NRS-2002: nutrition risk screening 2002; PG-SGA: Patient-Generated Subjective Global Assessment.
ROC curves were used to determine the effectiveness of leptin levels in assessing CD severity. The area under the curve (AUC) was found to be 0.77, indicating the leptin is a reliable predictor of the diagnosis of CD. The optimum cut-off point was found to be 803 ng/ml, with a sensitivity and specificity equal to 60.0 % and 88.9 %, respectively (Fig. 1).
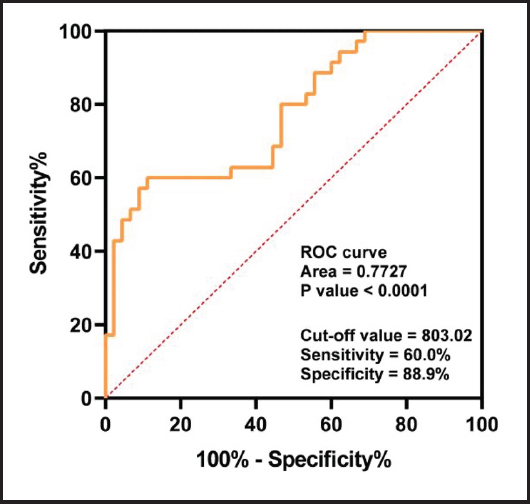
Figure 1. Receiving operating characteristic (ROC) curves comparing leptin levels in CD patients and controls.
Table III shows the correlation analysis of nutritional indicators in the CD groups. The NRS-2002 score was positively associated with the PG-SGA score (r = 0.578, p < 0.001), and both scores were negatively correlated with nutritional indicators, including BMI, mid-arm circumference, upper-arm muscle circumference, triceps skinfold thickness, lower leg circumferences, and triglycerides. BMI and other nutritional indicators showed positive correlations with each other.
Table III. Correlation analysis of nutrition indicators in CD groups.

*p < 0.05.
BMI: body mass index; NRS-2002: nutrition risk screening 2002; PG-SGA: Patient-Generated Subjective Global Assessment.
Figure 2 shows the correlations between the CDAI and nutritional indicators. Although BMI did not show a significant correlation with CDAI (r = -0.093, p = 0.439) (Fig. 2A), both the NRS-2002 and PG-SGA scores had significant positive correlations with CDAI (r = 0.329, p = 0.0047; r = 0.370, p = 0.0015) (Fig. 2B and C). There was a significant negative correlation between the upper-arm muscle circumference and CDAI (r = -0.241, p = 0.0475) (Fig. 2D) and between cholesterol and CDAI (r = -0.281, p = 0.0195) (Fig. 2E).
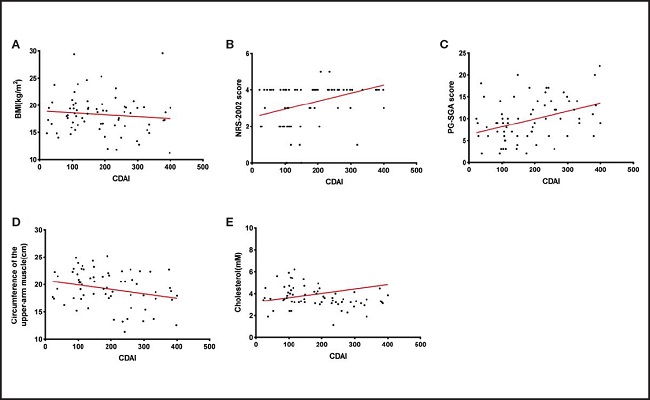
Figure 2. The correlations between the CDAI and nutritional indicators. A. Non-significant negative correlation between CDAI and BMI in CD groups; n = 77; r = -0.093, p = 0.439. B. A significant positive correlation was noted between the CDAI and NRS-2002 score in CD patients; n = 77; r = 0.329; p = 0.0047. C. A significant positive correlation was noted between the CDAI and PG-SGA score in CD patients; n = 77; r = 0.370; p = 0.0015. D. A significant negative correlation was noted between CDAI and circumference of the upper-arm muscle in CD patients; n = 77; r = -0.241; p = 0.0475. E. A significant negative correlation was noted between CDAI and cholesterol in CD patients; n = 77; r = -0.281; p = 0.0195. CDAI: Crohn’s disease activity index; BMI: body mass index; NRS-2002: Nutrition Risk Screening 2002; PG-SGA: Patient-Generated Subjective Global Assessment.
DISCUSSION
Malnutrition frequently occurs in IBD patients and can be identified by protein-energy malnutrition, changes in body composition, and micronutrient deficiencies (2). Studies have shown that patients with CD gradually become malnourished, which can prolong the course of the disease and adversely affect its prognosis (24). An NRS-2002 score ≥ 3 indicates nutritional risk (+), while malnutrition has been defined as a PG-SGA score ≥ 4 and BMI < 18.5 kg/m2 (4). We found that the NRS-2002 and PG-SGA scores of the CD and active CD groups were both higher than the standard values. We also found that both scores were correlated with nutritional indicators and that the BMI and other nutritional indicators were lower in the CD groups. The results showed that the nutritional status of the CD groups was significantly reduced in comparison with the control group; this was especially noticeable in the active CD group, suggesting that patients with CD were more prone to nutritional risk in the active stage of the disease. Studies have found that both anthropometric measurements (such as BMI, triceps skinfold thickness, and mid-arm circumference) and body composition (such as fat mass and muscle mass) are lower in patients with active CD than in those in remission, which may be due to increased energy requirements resulting from inflammation and lower food intake due to CD symptoms (25). This indicates that the nutritional status of active CD patients is worse than that of quiescent CD patients, which is consistent with our report.
Although BMI has been considered as an easily applied gauge of nutritional status, this one-off measure may not be especially useful for assessing lean body mass and nutritional status (26). In addition, the determination of muscle function in CD patients is helpful as this is often adversely affected (26,27). We, therefore, chose to use the mid-arm circumference, the circumference of the upper-arm muscle, triceps skinfold thickness, and the circumference of the lower legs for a comprehensive evaluation of nutritional status. Lin et al. (8) used a combination of triceps skinfold thickness, mid-arm circumference, and thigh scan to investigate trunk and limb body composition in CD patients during treatments. The results showed that adequate nutrition was associated with reduced disease activity and significant increases in body weight, muscle mass, and trunk fat. In terms of limb composition, the increases in arm fat and leg muscle were found to become more significant as the nutrition treatment time progressed. Our study also found that CD patients had a poor nutritional status and that disease activity, specifically, the CDAI, was correlated with nutritional indicators, suggesting that nutritional improvements may be beneficial in reducing disease activity.
Leptin is secreted by human adipose tissue and influences both metabolic activity and inflammation (17). Leptin has been shown to reduce body fat, suppress appetite, and increase physical activity in rodents by inhibiting the release of hypothalamic neuropeptide Y (28,29), thereby controlling body weight. Although it has been suggested that increased leptin levels cause anorexia in mice, this appears to run counter to our findings, since most people with CD regain their appetite when they go into remission (12). However, many studies have shown that leptin appears to influence food consumption differently in humans than in mice. For instance, obese patients may have high leptin levels while continuing to overeat, possibly because they are less sensitive or more resistant to leptin (30). Even patients with anorexia nervosa showed very low leptin levels (29), and the present study demonstrated a significant positive relationship between leptin and BMI. Importantly, further increases in leptin levels above normal thresholds did not seem to affect food intake. The fact that infliximab enhances leptinemia in CD patients without changing the percentage of fat mass suggests that leptin regulation has a physiological mechanism independent of fat mass (12). The study also found that obesity was associated with higher serum leptin levels. Although the raised leptin levels may have resulted from several causes, there was a much greater association between leptin and body fat than with any other variable tested (30). Several studies have observed that circulating leptin is reduced in CD, possibly due to the overactivity of TNF-α (18). Our study confirmed the reduced leptin concentrations in CD patients. The serum leptin concentration is a reflection of the amount of body fat, and there is a positive and strong correlation between them, which may be related to the induction of the ob gene (30). In CD patients, as we found, serum leptin, BMI (it has been reported that BMI is significantly correlated with the body fat percentage in Asians [31]), cholesterol, and triglyceride levels were reduced in comparison with the controls, with leptin being significantly positively correlated with all these factors, which supports the hypothesis that fat cells secrete leptin. Leptin is mainly related to fat content and nutritional status in CD patients, with reduced dominance of its appetite-inhibiting action, but more studies are needed to explain the mechanism.
The results of the correlation analysis suggested that leptin was positively correlated with BMI, other nutrition-related indicators (including the triceps skinfold thickness and calf circumference), and blood lipids. The NRS-2002 and PG-SGA scores were negatively correlated with leptin. In addition, the higher the nutritional status of the subject, the higher the level of serum leptin (32). In protein-energy malnutrition (PEM) patients, leptin levels were found to be lower in patients with low fat storage, regardless of age or state of weakness, and leptin levels were positively correlated with triceps skinfold thickness (33). These results indicate that leptin levels may be related to the nutritional status of CD patients.
Trejo-Vázquez et al. (34) found a significant positive association between leptin and CDAI. Low serum leptin levels were found to be linked with increased risk of CD disease activity, suggesting that the leptin concentration may represent an attractive marker for determining CD risk, and suggesting that low leptin levels may be the consequence of elevated inflammation. Other clinical studies have demonstrated a correlation between the CDAI and serum leptin, suggesting that weight control and dietary habits may be new targets for improving CD treatment (35). Studies have found that leptin and adiponectin levels in active CD patients are often lower than in those with quiescent CD, consistent with our findings, possibly due to lower lipid levels and worse nutritional status in active CD. We found that the leptin level was significantly correlated with the CDAI, suggesting that the serum leptin level may serve as an alternative inflammatory marker in patients with CD (17). However, Peracchi et al. (36) showed that circulating ghrelin was higher in IBD patients with active disease in comparison with controls and patients in remission. Circulating ghrelin responds quickly to food intake and decreases as the amount of fat increases (37), which is consistent with our results. Leptin also affects energy expenditure (38). Ghrelin stimulates food intake and leptin induces satiety (39,40). Therefore, leptin may be considered as a ghrelin antagonist (39). Similarly, our study showed that treated quiescent CD patients had higher blood leptin concentrations, closer to the control group, than active CD patients, which was particularly evident in CD subjects.
ROC curves were used to investigate the discriminatory power of leptin concentration between the CD and control groups. It was found that the AUC was over 0.77 (Fig. 1), with the AUC together with its 95 % CI being 0.77 (0.67-0.88). The Youden cut-off index for the ROC curve (Fig. 1) corresponded to the total leptin median concentration of 803 ng/ml. The cut-off value was 803.02, with sensitivity = 60.0 % and specificity = 88.9 %. This cut-off value, due to its high specificity, shows that leptin is a good indicator for the diagnosis of CD. Sensitivity can detect a decrease to a certain extent, indicating the usefulness of this value as a cut-off for subsequent analyses between leptin and CD. This showed a strong association, with an odds ratio (OR), together with its 95 % CI, of 0.77 (0.67-0.88). These findings indicate that patients with leptin concentrations under 803 ng/ml may be candidates for the development of CD.
Interventions involving both enteral and parenteral nutrition have been shown to be effective in treating CD, reducing the CDAI scores, and alleviating disease progression (40). Some studies suggest that CD can be controlled by enteral nutrition, and the CDAIs of patients receiving nutritional therapy have been found to be significantly reduced, with scores < 150 points after treatment (9). This confirms the association between the CDAI and nutritional indicators as shown in figure 2, in which BMI and other nutritional indicators are negatively correlated with the CDAI, while the NRS-2002 and PG-SGA scores were positively correlated with the CDAI. Clinical trials have established the effectiveness of nutritional therapy in supporting CD and reducing disease activity (24). All these findings suggest that nutrition is inseparable from the CDAI and that poor nutrition will affect disease activity, resulting in a poor prognosis. Therefore, improving the nutritional status and thus promoting leptin regulation is critical in improving the prognosis of CD patients.
Our study has some limitations. We conducted a comprehensive systematic review of the published literature on CD activity index and leptin, but we chose not to do a meta-analysis due to the differences among the studies. Due to human and financial constraints, we may only select qualified groups within our ability, instead of including all regional groups and races. The results may vary depending on the population or race in different regions.
Thus, as leptin was found to be correlated with many nutritional indicators, abnormal leptin regulation may be related to malnutrition in CD patients. Leptin secretion is, therefore, a potential interventional target to improve both nutritional status and disease progression in CD patients.
CONCLUSIONS
Here, a significant relationship between circulating leptin levels and nutritional status in patients with CD was demonstrated. We conclude that disease activity is associated with both serum leptin concentrations and nutritional status, while leptin concentrations are related to nutritional status. Measurement of leptin levels is thus a useful additional tool in the evaluation of CD patients to predict both their disease activity and clinical response. Patients with leptin concentrations lower than 803 ng/ml are more likely to develop CD. These findings suggest the potential usefulness of leptin as an interventional target to improve nutritional status, thus reducing disease activity and improving the clinical outcome. The pathogenesis of CD is complex, as are the actions of hormones associated with appetite, and further studies are needed to elucidate its underlying mechanisms.

