


Meu SciELO
 Serviços customizados
Serviços Personalizados
Journal
Artigo
 Inglês (pdf)
 Artigo em XML
 Referências do artigo
 Enviar este artigo por email
Indicadores
-
 Citado por SciELO
 -
 Acessos
Links relacionados
-
 Citado por Google
 -
 Similares em
SciELO
Similares em
SciELO -
 Similares em Google
Compartilhar

 Permalink
Anales de Psicología
versão On-line ISSN 1695-2294versão impressa ISSN 0212-9728
Anal. Psicol. vol.32 no.3 Murcia Out. 2016
https://dx.doi.org/10.6018/analesps.32.3.259411
A New Measurement of Scientific Creativity: The Study of its Psychometric Properties
Una Nueva Medida de la Creatividad Científica: El estudio de sus propiedades psicométricas
María-Rosario Bermejo, María-José Ruiz-Melero, Javier Esparza, Mercedes Ferrando and Rosa Pons
Murcia University (Spain).
This article has been produced with the financial support of the I+D+i project EDU2014-53646-R sponsored by the Spanish Ministry of Economy and Competitiveness.
ABSTRACT
The purpose of this paper is to study the psychometric proprieties of a new test aimed to measure scientific creativity, the Creative Scientific Ability Test (C-SAT, Sak & Ayas, 2011). The test has been validated in different Turkish samples, showing an adequate reliability (α = .87, Ayas & Sak, 2014). The test is composed of five tasks that measure scientific creativity in different areas of knowledge: Biology, Chemistry, Physics, Ecology and an interdisciplinary task. For each task, a Creative Quotient (CQ) is calculated as a combination of Fluency (number of valid answers) and Flexibility (different approaches in the solution). The test also allows us to differentiate three scientific-creative thinking processes (hypothesis generation, hypothesis evaluation and evidence verification). 344 students from Compulsory Secondary Education took part in this study. The results point out a good reliability (α = .705) and an adequate inter-rater agreement (ranging from average ICC .80 to .98). In addition, the unifactorial structure of the test was verified using CFA, which agree with the authors' previous results (Ayas & Sak, 2014; Sak & Ayas, 2013), even when a structure of three creative process can be considered.
Key words: Gifted, talented, scientific creativity, creative abilities.
RESUMEN
El objetivo del trabajo es estudiar las propiedades psicométricas de un nuevo test para medir la creatividad científica, "The Creative Scientific Ability Test" (C-SAT; Sak & Ayas, 2011). El test había sido validado para distintas muestras de alumnos en Turquía, obteniendo una adecuada fiabilidad (α = .87; Ayas & Sak, 2014). El test está compuesto de cinco tareas que miden la creatividad científica en distintas aéreas de conocimiento: Biología, Química, Física, Ecología y una tarea interdisciplinar. Para cada tarea se calcula un Compuesto Creativo (CQ) que resulta de la combinación de la fluidez (número de respuestas válidas) y la flexibilidad (enfoques utilizados en la solución). El test permite además diferenciar entre los procesos del pensamiento científico-creativo (generación de hipótesis, evaluación de la hipótesis y verificación de la evidencia). En esta investigación, han participado 344 estudiantes de Educación Secundaria Obligatoria. Nuestros resultados indican una buena fiabilidad (α = .705) y un buen acuerdo ínter-jueces (oscilando el ICC promedio de .80 a .98). También se ha verificado a través de AFC la estructura unifactorial de la prueba, según la propuesta de los autores (Ayas & Sak, 2014; Sak & Ayas, 2013), pero considerando factible la estructura de tres procesos creativos compuestos de distintas tareas cada uno.
Palabras clave: creatividad científica, evaluación, superdotación y talento.
Introduction
Nowadays in our technological society where human capital plays a fundamental role in the development of such a society, it is important to assess our students' scientific talents in order to foster them. The present work aims at validating and instrument to measure students' scientific creativity (CSAT, Sak & Ayas, 2013). According to Duschl (1997), most science students (as well as teachers), deal with large amounts of data and information about sciences. However, students continue repeating and memorizing facts and data, without generating new knowledge or transferring their knowledge to new situations, which points out to a certain deficiency in the teaching-learning process. According to the definition given by the specialists of the Organization for Cooperation and Economic Development (OCDE, 2006), scientific competence includes scientific knowledge and its use to make to pose appropriate and valid questions, acquire new knowledge, explain scientific phenomena and draw conclusions based on evidence related to science areas. The three sub-competences referred to in the previous definition could be determined in the following way: 1) identifying scientific issues or topics; 2) explaining phenomena in a scientific way; and 3) using scientific evidence in an efficient way.
The role of creativity in scientific discoveries is intuitively recognised. Thus, scientific research requires creativity to go beyond knowledge, create new ways of understanding the world and solve scientific problems in a non-conventional manner. This requires students to explore their range of knowledge, imagine different ways of solving such problems and create ingenious combinations of knowledge. For this reason, scientific creativity should be considered as an important part within scientific thinking (Weiping & Philip, 2002).
In this sense, creativity is the ability to offer products which are new (original), appropriate to the task and valid (Hennessey & Amabile, 1999; Sternberg & Lubart, 1995/1997). Therefore, it entails the capacity to see new possibilities in the problem solving process and exploit them in an appropriate manner so as to contribute to the progress of society. Also, creativity involves a necessary process of analysing problems and ideas from new approaches, as the solution these problems demands changes and brilliant, non-conventional ideas (Ruiz, Bermejo, Ferrando, Prieto & Sainz, 2014). Regarding creative thinking, it has been described as 'ordinary thinking' (as opposed to an 'extraordinary' way of thinking), (Perkins, 2000/2003; Weisberg, 2014), But some authors have supported the existence of some specific thinking processes that implies 'insight' (Sternberg & Davidson, 1999).
Lin, Hu, Adey and Shen (2003), propose the existence of a domain specific creativity in sciences, which is necessary to solve problems, generate hypotheses, design experiments and technological innovation, requiring a type of creativity which is proper to science.
Why should we talk of a specific creativity in the area of sciences? In the opinion of the experts, scientific creativity encompasses the same mental processes leading any type of creativity, but what makes the area of sciences different is the vast amount of knowledge (theoretical, technical and experimental) that is required to produce an original idea (Baer, 1998; Dunbar, 1999; Han, 2003; Lin et al., 2003). Thus, its specificity may not be especially determined by the mental processes required to create new ideas, but by the previous knowledge needed, or by a combination of both (Plucker & Beghetto, 2004). What has actually been verified is that people can be very creative in a certain domain, such as literature, but little creative in another, such as music (Baer, 1999).
In accordance with the view that scientific creativity is a specific domain, some instruments have been designed to assess it. For example, Frederiksen and Ward (1978) produced their 'Test of Scientific Thinking' (TST). These authors base their work on two classical creativity theories, namely those of MacKinnon (1962) and Guilford (1967). The TST assesses qualitatively and quantitatively the ideas produced when formulating hypotheses, measuring proposals and problems' solutions. The tasks involved feature situations and aspects that are typical of a scientist's work. The data from the research show satisfactory psychometric properties (α=.90).
Another test designed to assess the abilities in scientific creativity is the designed by Hu and Adey (2002), the 'Test of Scientific Creativity' (TSC), which is based on their Structural model of Scientific Creativity. For the construction of this model, the authors found support in different theories on creativity and problem-solving (Einstein & Infield, 1938; Lubart, 1994; Torrance, 1974).
Scientific Creativity
According to the Scientific Structure Creativity Model, scientific creativity is defined as the intellectual ability to produce a certain original product, which has a social and personal value and is designed with a specific purpose, using some given information, as well as the previous knowledge acquired by the individual (Hu &Adey, 2002).
The authors of this model distinguish three dimensions:
a) The first dimension includes three features of creativity taken from Torrance (1974): fluency, which refers to the amount of answers given by the student to a problem; flexibility, understood as the student's capacity to change from one type of thinking to another one when facing a problem; and originality, which refers to the unusual answers given by a specific sample of students.
b) The second dimension is made up of the scientific products, which include: 1) the technical products, i.e. the results from the discovery process or the scientific research (that which is created, invented, discovered); 2) the advances in the scientific knowledge as a result of the latter; 3) the understanding of scientific phenomena; and 4) the solutions to the scientific problems.
c) The third dimension consists in the process, which involves creative thinking and creative imagination. Creative thinking refers to the student's capacity to deal with problem-solving situations in an unusual, non-conventional way; while creative imagination is a powerful process which enables an individual to create new thinking guidelines to find, organise and lead ingenious mechanisms to sort out problems demanding original solutions.
Summing it up, the scientific creativity structure involves seeking and formulating scientific problems as well as elaborating creative experiments. Such creativity includes both cognitive as well as non-cognitive factors (motivation, learning styles, personality features, etc.) which could have an influence on it. It should be added that scientific knowledge, the talent for science and the mental structures develop with age. A fundamental part of scientific creativity, in this model, is the identification of problems posed about scientific knowledge, their formulation and the hypotheses generation to solve them (Einstein & Infield, 1938; Lubart, 1994).
If at some point scientific thinking and scientific creativity had been studied separately, now both constructs come together under the umbrella of 'scientific-creative thinking'. This reunion has been originally motivated by the debates on the creativity field (general versus specific domain). And, later, it has been followed by other debates on scientific creativity and its assessment, in which it was evidenced the need to be creative in the area of the sciences to reach scientific competence and expertise, as the creative process results in a creative product (Simonton, 2011). In some studies it has been questioned the assessment criteria used to measure scientific creativity; in this sense, the following characteristics have been proposed to consider a product as a creative one: appropriateness, functionality and originality (Cropley, 2005; Cropley & Cropley, 2008; Haller, Courvoisier, & Cropley, 2011; Runco, & Charles, 1993).
Thus, a thorough analysis of the studies carried out until now allows us to distinguish between two trends in the assessment of creativity in sciences. The first one, especially determined by the mental processes needed to create new ideas, considers divergent thinking as the basis of creative thinking in sciences, and helps the child to explore different alternatives in problem-solving situations, looking for different possibilities in the face of a new issue and/or question, along with the logical-rational thinking. The tests focusing on the assessment of the abilities proper to the sciences area emerge from this approach. A second approach points out that the creative achievement in sciences requires establishing which ideas are useful and more appropriate to a particular aim. Although the youngest students can offer more divergent (original) responses, these fail in terms of their usefulness or their adjustment to the problem on hands (Albert, 1996). According to Windschitl, Thompson and Braaten (2008), research in the field of science should revolve around the development of evidence based explanations about how the world works. In this research line, others highlight the influence of previous knowledge in scientific creativity (Dunbar, 1999; Plucker & Beghetto, 2004). Recently it has been added the need to bear in mind two conditions in the assessment of scientific creativity: the product must be appropriate, which implies the validity of the responses; and the amount of previous knowledge needed for its solution (Ayas & Sak, 2014; Sak & Ayas, 2011; 2013).
Thus, the C-SAT (Creative Scientific Ability Test), designed by Sak and Ayas (2011), differentiates between valid and invalid answers, and requires previous knowledge for its solution. These authors consider creativity as an interaction process involving the general creativity abilities, those related to scientific knowledge and the knowledge in the different science areas. The test is based on a solid theory of scientific creativity, which includes three components: general creativity abilities (Fluency, Flexibility; and a Creative Compound or Creative Quotient, resulting from the combination of Fluency and Flexibility), abilities related to science (hypotheses generation, assessment of the hypotheses through experiment design and assessment of the evidence); and the students' previous knowledge in the different areas of science (biology, physics, chemistry and ecology). The test comprises five subtests: (1) the fly experiment (biology); (2) interaction graph (interdisciplinary science); (3) the sugar experiment (chemistry); (4) the string experiment (physics); and (5) the food chain (ecology). Subtests 1 and 2 assess the hypothesis generation; sutests 3 and 4 measure the ability to formulate hypotheses; and the subtest 5 assesses the capacity to verify the evidence (see Table 1).
The innovative aspect of the test lies, on the one hand, in the amount of previous knowledge needed to solve the subtests, given that each one focuses on one knowledge area, as can be seen in Table 1; on the other hand, in the proposed approach by each subtest, which makes possible to assess the abilities of the scientific-creative process, namely: Fluency (total number of valid responses); Flexibility (the different categories used); and the Creative Quotient, calculated through the logarithm proposed by Snyder, Mitchell, Bossomaier, and Pallier (2004).
Regarding the research conducted by the authors of the test, it should be mentioned that its psychometrical proprieties were analyzing a first pilot study (Sak, 2010). In this study, the test was given to 71 students in sixth and seventh grades, identified as Maths talents. The data showed an internal consistency of .76 and an inter-rater reliability between .91 and .97. The correlations between the tasks or subtests were between .50 and .61. It should also be mentioned that the students in the seventh grade scored significantly higher than those in the sixth grade.
The second pilot study (Sak & Ayas, 2013), conducted using the C-SAT involved 288 students from sixth grade, and aimed at studying its psychometric properties. Regarding its factorial structure, C-SAT showed a single factor using Principal Component Analysis, although in theory it is composed of three dimensions. The inter-scales reliability of the test swung from α=.94 to α=.96 and the internal consistency was .85. The students' performance in the C-SAT significantly correlated with their performance in the Test of Mathematical Ability (Sak, Turkan, Sengil, Akar, Demirel, & Gucyeter, 2009). Considering these results, it could be said that the C-SAT could be a good psychometric measure of scientific creativity (Sak & Ayas, 2013). Such evidence led the authors to propose some new research lines for the future, among them application of the test to a larger group of students. The authors were particularly interested in replicating some previous researches, intending to confirm the test's uni-factorial structure, by using the Confirmatory Factor Analysis, and extend the studies of the C-SAT to obtain a strong evidence of the test's validity and reliability, so that it could be used for the research, the students' talents identification and for the practical decision-making.
In this way, Ayas and Sak (2014) have recently used a larger sample (N= 693 students) in which almost 3% (N=22) were identified as Maths talents. These students were in sixth grade. The results showed that the Cronbach's alpha coefficient was .87; and regarding subtests reliability, the range was .87 to .96 for all five subtests. For the fluency and flexibility total, and the creativity total, a mean index of .92 was calculated. In this study, the test unifactorial structure was confirmed using the CFA.
To find out the item's discrimination index, they divided the sample into three groups of students depending on their final scores on scientific creativity: the first group was composed by the 27% of the sample that scored the highest on the total creativity, the second group was composed the 27% of the sample that scored the lowest on creativity, and the third group was composed by 46% of the sample, who obtained average scores on creativity. The authors found statistically significant differences between the three groups: students with higher scores on total creativity did score significantly higher than their peers in all the tasks of the test. Also, students with average scores on creativity scored significantly higher than students with low creativity in all the tasks (Ayas & Sak, 2014).
Pearson's product-moment correlation analyses showed correlations from .11 to .34 between the creativity dimensions (fluency, flexibility and creativity) measured by the subtests. The lowest correlations were found between the flexibility dimension in subtest 1 and that in subtest 4. The highest correlations were found between the fluency dimension in subtest 4 and that in subtest 5. The correlations were higher between dimensions from the same task than between the dimensions from different tasks (ranging from .80 to .99). The correlations between the totals scores of the creativity dimensions assessed with the test showed a range from .49 to .70. All correlations were statistically significant (p< .01).
With the aim of studying the relationship between the creativity dimensions assessed by the C-SAT and by the TMT (Test of Mathematical Talent, Sak et al., 2009), with students' performance in Sciences and Mathematics, Pearson product-moment correlations were used. The data showed correlation coefficients ranging from .31 to .59. The highest correlations where found between the C-SAT and the TMT total fluency scores. Finally, it must be mentioned that all the correlations found were significant (p<.01).
Lastly, the C-SAT discriminant validity was studied. To do so, the C-SAT scores obtained by the gifted and the not gifted students were compared, finding differences means differences in favour of the gifted students' group.
The C-SAT has recently been applied to a Spanish students' sample aiming to study differences on scientific creativity depending on gender and academic grade. In this study, 78 students in Compulsory Secondary Education (ESO, by its acronym in Spanish) took part in this study. They were aged between 12 and 16 years old were identified as students with High Abilities according to the Castello and Batlle (1998) model. The data indicated that boys obtained significantly higher scores than girls on the 'Interaction Graph' task, which assesses hypotheses generation in an interdisciplinary way in the field of the sciences. Regarding the educational level, data showed that the students in the highest educational levels reached scores significantly higher in the 'Food Chain' task, which measures the scientific ability of evidence verification in the ecology area (Esparza, Ruiz, Ferrando & Sainz, 2015).
Finally, another study carried out using a Spanish sample (N=196 students in Compulsory Secondary Education, aging between 12 and 16), focused on the difference between the variables (Fluency, Flexibility and Creativity Compound) and the school year. The task used was the 'the flight of the housefly Experiment', relating to the biology knowledge area, which assesses hypotheses generation. The data indicated that the fourth year students reached significantly higher scores than those in the second year, in the Fluency dimension. In addition, statistically higher differences were also found in favour of the first year students in the flexibility dimensions and in the Creative Quotient (Esparza, Ferrando, Ferrándiz, & Prieto, 2015).
Method
Participants
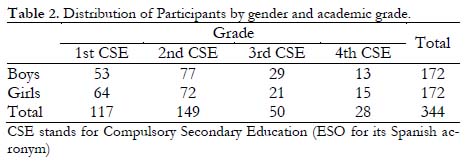
In this study, 344 students (172 boys) attending Compulsory Secondary Education (ESO) took part, all of them aged between 12 and 16 years old (M = 13.36, SD = 1.34). Students' selection was made using an incidental sampling, thus their selection was randomly made from six educational centres from the Region of Murcia. The schools participating in this study were both public and semi-public, all of them located at Murcia city. The socioeconomic level of students attending those schools was upper-middle class. Sample distribution according to participants' grade and sex can be consulted in Table 2.
Instrument
In this study, the above-described Creative Scientific Ability Test (Sak & Ayas, 2011), was used. It was designed for secondary school students. The approximate application time is 40 minutes.
Each task is rated for Fluency (total number of correct responses given) and for Flexibility (different categories used), and a Creative Quotient (CQ) is calculated for each task. A total Creative Quotient is calculated by adding the other five.
Procedure
Members of the research group of High Abilities at Murcia University translated and adapted the C-SAT following The International Test Commission guidelines (Hambleton, Merenda & Spielberger, 2005). The more meaningful of the adaptation was related to the scoring procedure, as Spanish students' answers were somehow different from Turkish Students'. Students took the test during school hours. At the beginning of the session all the questions were explained for them; allowing them 40 minutes to complete the test.
All answers given by the students were transcribed into a database using the EXCELL programme, avoiding any bias on the scoring due to students' handwriting, or students' response order. The test scoring was done by especially trained professionals.
First, the Fluency dimension was scored for every task, discarding invalid answers. Next, Flexibility was scored; to do so, each answer was assigned to their corresponding category, and then the total number of the different categories used in each test was summed up. Lastly, Creative Quotient (CQ) was calculated using the formula CQ = log2{(1+ u1) (1+ u2) ... (1+ uc)}. In which ui represents the total of responses given by the student in category 1,u2 the number of responses in category 2, and so on. The total CQ score results from the addition of the CQs of each task.
Data analysis
Statistical analyses were conducted using the SPSS v.20 statistics programme for Windows was used. A descriptive and correlational methodology was mainly used. For the analysis of the factorial structure of the results, Confirmatory Factor Analysis model was applied using the maximum likelihood estimation method. AMOS 21 (Arbuckle, 2012) was used. There were no missing data.
Following the suggestions in of different authors (Brown, 2006; Jackson, Gillaspy, & Purc-Stephenson, 2009; Macmann & Barnett, 1994; Schreiber, Nora, Stage, Barlow, & King, 2006), the adjustment measures used to verify the adequacy of the models to the data were the following: Chi-square (χ2), PGFI (Parsimony Adjusted Goodness of Fit Index), CFI (Comparative Fit Index), PCFI (Parsimony Adjusted Comparative Fit Index), RMSEA (Root Mean Squared Error of Approximation), and the ECVI (Expected CrossValidation Index).
Results
Analysis of inter-rater reliability
Firstly, the inter-rater reliability was calculated for a subsample of participants (n=73). Three examiners took part in the scoring process, so that all tasks were rated at least by two different persons.
To assess inter-rater agreement Intra-Class Correlation (ICC) index was used. This procedure is more appropriate than a Pearson correlation, due to these two reasons: first, it allows to test the inter-rater agreement; and second, as different from the correlation, which only offers information on co-variability, this procedure also indicates if the examiners are using the scale in a similar way, i.e., if they are working along the same score ranges (absolute value) (Dube, 2008; Shrout, & Fleiss, 1979). The method of 'one factor, random effects' was considered, in which it is assumed that the same measure is used by all the examiners, being examiners randomly assigned. Table 3 shows the result of those analyses. The intra-class correlation indexes indicate, in general, a high level of agreement among the examiners. The tasks with higher levels of agreement are: tasks 5 and 3; whereas the task showing greatest disagreement level between the examiners is task 2. Considering the raters' profiles, examiners 1 and 2 show a higher level of agreement between them than examiners 1 and 3.
The descriptive statistics of the variables measured in each task (Fluency, Flexibility and Creative Quotient) were calculated. It can be observed that the number of valid responses for each task varies from 1.60 (in task 1) to 2.6 (in task 5).
As it can be seen in Table 4, the task in which the students reach the highest scores is task 5 (which mean scores on Creative Quotient, Fluency and are higher than the other tasks); it is also the task showing greater variability. However, the most difficult task for the students was task 1, according to the mean scores in CQ and Flexibility.
As Table 4 shows the skewness and kurtosis indexes of all variables follow a normal distribution, except for the variable Fluency in task 1. In fact, the test Z of Kolmogorv-Smirnov showed that this variable was not distributed in the normal way (K-S=4; p< .001). For the sake of precaution, the normality of the other variables was verified (right hand-side of Table 4), verifying that in fact, only total variables resulting from the addition of those obtained in the five tasks followed a normal distribution.
As histograms show (see Figure 1), most of the students failed to complete one of the tasks. This indicates that C-SAT is a test designed to discriminate students with a high scientific creativity; however, its discriminating power is low when used with average abilities students.
Internal consistency
The test's internal consistency was verified through a correlation analysis between the variables obtained from each task. The inter-task variables evidence strong correlations. Within each task, Fluency, Flexibility and the Creativity Quotient correlated between r = .83 (Fluency and Flexibility in task 1) to = .99 (for Fluency and the CQ in task 3). Considering the inter-task correlations, the task with highest correlations with the other is task 5 (Ecology); particularly with task 2 (interdisciplinary) and task 4 (Physics), whose correlations are around r =.4. However, task 1 (Biology) is the one which correlates the least with the others.
Another way that Ayas and Sak (2014) use to verify the instrument's internal consistency is based on the analysis of students' scores on each task depending on their total Creative Quotient (CQ total). Following their work, we divided the sample into three groups according to their total CQ scores: students with low total CQ (scores below 1 standard deviation); students with high total CQ (scores above 1 standard deviation in Total CQ); and the rest of the participants (medium scientific creativity levels). Next, we studied the differences between these three groups in each CQ from the five task by means of an ANOVA. The results proved that the differences were statistically significant for all the tasks [F(2, 242) = 33,51; p < .001 for CQ_1; F(2, 242) = 62,46; p < .001, for CQ_2; F(2, 242) = 61,67; p < .001; for CQ_3; F(2, 242) = 51,83; p < .001; for CQ_4; and F(2, 242) = 95,88; p < .001 for CQ_5]; and that the differences were found for the three groups, always in favour of the students with a higher CQ total.
Test Internal Structure
In an initial work, Sak and Ayas (2013) verified the test structure through an exploratory factorial analysis taking into account only the CQ variables of each task, finding a unique factor. In a later work, Ayas and Sak (2014) used a confirmatory factor analysis considering the three variables in each test (Fluency, Flexibility and CQ), newly confirming the unifactorial nature of the data, although they did not try any alternative models to the unifactorial solution.
Since the value for CQ is calculated on the basis of Fluency and Flexibility values, we considered it appropriate to use only the CQ scores, avoiding the three variables (CQ, Fluency and Flexibility) in the same analysis. The decision to use the CQ only, instead of using Fluency and Flexibility, in our factorial analysis is due to the fact that this index is one of the main contributions made by the C-SAT, as it enables us to control the co-linearity between Fluency and Flexibility.
After verifying the sample adequacy to conduct a factorial analysis (KMO= .762; Bartlett: χ2 = 285,017; gl = 10; p < .001), Confirmatory Factorial Analysis was conducted. As the variables did not meet the assumption of normality, the asymptomatically distribution free estimation method was used.
Three models were tested: model 1 (CQ-5T) presupposed that the five tasks are independent; model 2 (CQ-1FG-3P-5T) presupposed that the tasks are grouped into three factors according to the scientific thinking process they measure (hypotheses generation, hypotheses verification and evidence assessment); and these converge into one general creativity factor; model 3 presupposes that all variables are a part of a single general scientific creativity factor. Table 5 shows the adjustment indexes found for each of the models tested. The model with better adjustment was the unifactorial one (χ2/gl = 1.29; CFI = .982; RMSEA = .029; ECVI = .077). And the one with worst adjustment was model 1 (in-dependent tasks), which showed extremely poor indexes. The adjustment indexes of model 2 are also adequate, and the theory would support its use, although it may not be the model with best fit indexes (Table 5).
The standardised regression weights of each variable (task) included in model 3 are shown in Table 6 (left columns). As it can be seen the tasks with the highest weight value are task 5 (Ecology) and 4 (Physics) and the one with the lowest weight value is task 1 (Biology).
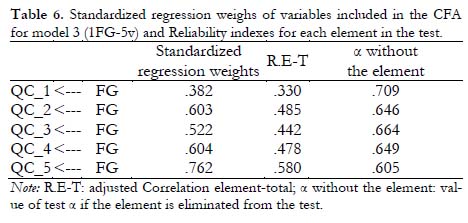
The test reliability, taken as a whole, obtained a value of α = .705. The correlation item-total indexes and the reliability values if the element is eliminated (Table 6, right side) showed that task 5 is the one which best correlates with the total, and task 1 is the one which correlates the lowest. Additionally, task 5 is the one which contributes the highest reliability index to the test.
Comments and conclusions
This study has supposed the adaptation of a new instrument to measure scientific creativity which is susceptible of being used to detect early talent in the sciences area. Such instrument had been previously validated with samples of students candidates to the gifted and talented students Programme at Anadolu University, in Turkey (EPTS, Education Programmes for Talented Students) and with some students randomly chosen from some Turkish secondary schools.
Regarding the test application and scoring, it should be mentioned that during the application process it was very important to give precise instructions to the students, so that they could understand what the task required from them. Given that these tasks are quite different from the types of task that students are used to solve, it was not surprising that students' first reaction was feeling overwhelmed, and even frustrated. For this reason, it was important to act with precision and clarity when giving them instructions.
Regarding the test's level of difficulty, interesting was found. For instance, the students' scores do not follow, in the main, a normal distribution. Most of the students achieve very low marks, and only a few of them get marks above 2 in the variables: Fluency, Flexibility and CQ. Very few of them get marks above 4 (maximum score). As the histograms indicate, the scores tend to form a sort of 'stair-case' descending towards the right.
The histograms clearly evidence the test's discriminatory potential, which is also in accordance with its theoretical framework: not everybody can be creative in the area of the sciences (Sak & Ayas, 2013). This is due to the fact that creativity in this area not only requires the typical abilities of divergent thinking, but also some previous knowledge. As different from other creative thinking tests, such as Hu and Adey (2002) and the Torrance (1974), the C-SAT discriminates between valid and invalid responses. As pointed out before, it is important to mention that this research was conducted on a random sample comprising boys and girls from different schools in the Murcia Region.
Respecting the test's internal consistency and its factorial structure, it should be noted the low correlation between task 1 (Biology) and the rest of the tasks. This could be due to the fact that this task not only requires hypotheses generation but variable analysis and observation as well. It is doubtlessly the most complex task for our students, as they are expected to determine, from an experiment 'in progress', what hypotheses the researcher could verify; unlike other tasks, such as Tschirgi (1980), which give them a problem as a starting point for an experiment they have to design.
The test's internal consistency has also been studied through the assessment of the students' profiles. Thus, it has been proven that those with a high total CQ achieve significantly higher scores than their peers in all five tasks. And the same happens with the low-performance students: their scores are significantly lower than those of their peers.
Regarding the test's internal structure, it was decided to use a confirmatory factor analysis using the five CQ scores of each task. The model with better adjustment indexes was the unifactorial one (model 3). However, the results indicate that it would be feasible to use the test to discriminate the students' abilities in different processes of creative thinking: hypotheses generation, hypotheses assessment and evidence verification (model 2), which will agree with the model proposed by Klahr and Dunbar (1988); although this model does not reach the best adjustment indexes, it is important to consider that only five observed variables are being taken into account, which implies limitations as regards the number of factors such observations can be reduced to. Although as suggested by Ayas and Sak (2014), the test's unifactorial aspect may be due to the fact that the processes are carried out in an inter-dependent manner.
Regarding the test reliability, it was studied in terms of inter-rater reliability and through the Cronbach's alpha coefficient calculus. About the alpha found, it is slightly below the one reported by the authors (Sak & Ayas, 2013; Ayas & Sak, 2014) but it is still a good reliability index. As regards the rating process and the inter-rater reliability, it should be mentioned that this test requires examiners with minimum knowledge in the area of sciences. Even more relevant that their knowledge in sciences, to achieve a good agreement inter-rater a thorough previous training is important. It allows them to be familiar with the type of responses and the possible dilemmas they may find when deciding whether a response is satisfactory or unsatisfactory.
In conclusion, although much work still needed for the test validation in Spanish population, this work offers researchers an original and valid instrument to identify the scientific talent of our students. In future studies, it may be interesting to explore the cognitive profiles of the more able students in the sciences area; or even go beyond this and use the C-SAT early detection option to offer these students enrichment programmes aiming at stimulating their interests.
References
1. Albert, R. S. (1996). Some reasons why childhood creativity often fails to make it past puberty into the real world. New Directions for Child and Adolescent Development, 1996(72), 43-56. [ Links ]
2. Arbuckle, J.L. (2012). IBM SPSS Amos 21 User's Guide. IBM. [ Links ]
3. Ayas, M. B., & Sak, U. (2014). Objective measure of scientific creativity: Psychometric validity of the Creative Scientific Ability Test. Thinking Skills and Creativity, 13, 195-205. [ Links ]
4. Baer, J. (1998). The case for domain specificity of creativity. Creativity Research Journal, 11(2), 173-177. [ Links ]
5. Baer, J. (1999). Domains of creativity. En M. Runco, & S. Pritzker, (Ed.). Encyclopedia of Creativity (pp. 591-596). New York: Academic Press. [ Links ]
6. Brown, T. (2006). Confirmatory factor analysis for applied research. Nueva York: The Guilford Press. [ Links ]
7. Castelló, A., & Batlle, C. (1998). Aspectos teóricos e instrumentales en la identificación del alumnado superdotado y talentoso. Propuesta de un protocolo. FAISCA, 6, 26-66. [ Links ]
8. Cropley, A. J. (2005). Creativity and problem-solving: Implications for classroom assessment. British Psychological Society. [ Links ]
9. Cropley, D., & Cropley, A. (2008). Elements of a universal aesthetic of creativity. Psychology of Aesthetics, Creativity, and the Arts, 2(3), 155. [ Links ]
10. Dubé, J. E. (2008). Evaluación del acuerdo interjueces en investigación clínica breve introducción a la confiabilidad interjueces. Revista argentina de clínica psicológica, 17, 75-80. [ Links ]
11. Dunbar, K. (1999). Science. En M.A. Runco & S.R. Pritzker (Eds.). Encyclopedia of creativity (Vol. II) (pp. 525-531). New York: Elsevier. [ Links ]
12. Duschl, R. A. (1997). Renovar la enseñanza de las ciencias: importancia de las teorías y su desarrollo. Madrid: Narcea. [ Links ]
13. Einstein, A. & Infield, L. (1938). The Evolution of Physics. New York: Simon & Schuster. Esparza, J., Ferrando, M., Ferrándiz, C., & Prieto, M.D. (2015). Índice de Creatividad Científica (IC): Originalidad y Calidad. I Jornadas Internacionales de Doctorado, Universidad de Murcia. Comunicación Oral. [ Links ]
14. Esparza, J., Ferrando, M., Ferrándiz, C., & Prieto, M.D. (2015). Índice de Creatividad Científica (IC): Originalidad y Calidad. I Jornadas Internacionales de Doctorado, Universidad de Murcia. Comunicación Oral. [ Links ]
15. Esparza, J., Ruiz, M.J., Ferrando, M., & Sainz, M. (2015). Creatividad científica y alta habilidad: diferencias de género y nivel educativo. Aula. Revista de Pedagogía de la Universidad de Salamanca, 21, 49-62. [ Links ]
16. Frederiksen, N., & Ward, W. C. (1978). Measures for the study of creativity in scientific problem-solving. Applied Psychological Measurement, 2(1), 1-24. [ Links ]
17. Guilford, J. P. (1967). The nature of human intelligence. New York: MacGraw-Hill. [ Links ]
18. Haller, C. S., Courvoisier, D. S., & Cropley, D. H. (2011). Perhaps there is accounting for taste: Evaluating the creativity of products. Creativity Research Journal, 23(2), 99-109. [ Links ]
19. Han, K. S. (2003). Domain Specificity of Creativity in Young Children: How Quantitative and Qualitative Data Support It. The Journal of Creative Behavior, 37(2), 117-142. [ Links ]
20. Hambleton, R. K., Merenda, P., & Spielberger, C. (Eds.) (2005). Adapting educational and psychological tests for cross-cultural assessment. Hillsdale, NJ: Lawrence S. Erlbaum Publishers. [ Links ]
21. Hennessey, B. A., & Amabile, T. M. (1999). Consensual assessment. En M. A. Runco, & S. R. Pritzker (Eds.), Encyclopedia of creativity (Vol. I) (pp. 347-359). New York: Elsevier. [ Links ]
22. Hu, W., & Adey, P. (2002). A scientific creativity test for secondary school students. International Journal of Science Education, 24(4), 389-403. [ Links ]
23. Jackson, D. L., Gillaspy Jr, J. A., & Purc-Stephenson, R. (2009). Reporting practices in confirmatory factor analysis: an overview and some recommendations. Psychological methods, 14(1), 6. [ Links ]
24. Klahr, D., & Dunbar, K. (1988). Dual space search during scientific reasoning. Cognitive Science, 12, 1-48. [ Links ]
25. Lin, C., Hu, W., Adey, P., & Shen, J. (2003). The influence of CASE on scientific creativity. Research in Science Education, 33, 143-162. [ Links ]
26. Lubart, T. I. (1994). Creativity. In R. J. Sternberg (Ed.), Thinking and Problem Solving (pp. 289-332). London: Academic Press. [ Links ]
27. MacKinnon, D. W. (1962). The nature and nurture of creative talent. American Psychologist, 17, 484-495. [ Links ]
28. Mcmann, G.M., & Barnett, D.W. (1994). Structural analysis of correlated factors: Lessons from the verbal-performance dichotomy of the Wechsler scales. School Psychology Quarterly, 9, 161-197. [ Links ]
29. OCDE (2006). El programa PISA de la OCDE ¿Qué es y para qué sirve?. París: OCDE. Recuperado en http://www.oecd.org/pisa/39730818.pdf (última visita 2015.03.05). [ Links ]
30. Perkins, D. N. (2000/2003). Archimedes' bathtub: The art and logic of breakthrough thinking. New York: Norton & Company. Trad. Castellano, La bañera de Arquímedes y otras historias del descubrimiento científico: el arte del pensamiento creativo. Barcelona: Paidós. [ Links ]
31. Plucker, J. A., & Beghetto, R. A. (2004). Why Creativity Is Domain General, Why It Looks Domain Specific, and Why the Distinction Does Not Matter. In Sternberg, R. J., Grigorenko, E. L., & Singer, J. L. (Eds.), Creativity: From potential to realization (pp. 153-167). Washington, DC, US: American Psychological Association. [ Links ]
32. Ruiz, M. J., Bermejo, R., Ferrando, M., Prieto, M. D., & Sainz, M. (2014). Inteligencia y Pensamiento Científico-Creativo: Su convergencia en la explicación del rendimiento académico de los alumnos. Electronic Journal of Research in Educational Psychology, 12(2), 283-302. [ Links ]
33. Runco, M. A., & Charles, R. E. (1993). Judgments of originality and appropriateness as predictors of creativity. Personality and Individual Differences, 15(5), 537-546. [ Links ]
34. Sak, U. (2010). Assessment of creativity: Focus on math and science. In Paper presented at the 12th ECHA Conference Paris, France. [ Links ]
35. Sak, U. & Ayas (2011). C-SATManual. Unpublished Manuscript. [ Links ]
36. Sak, U., & Ayas, M. B. (2013). Creative Scientific Ability Test (C-SAT): A new measure of scientific creativity. Psychological Test and Assessment Modeling, 55(3), 315-328. [ Links ]
37. Sak, U., Turkan, Y., Sengil, S., Akar, A., Demirel, S., & Gucyeter, S. (2009). Matematiksel Yetenek Testi (MYT)'nin gelifmi vepsikometrik ozellikleri (Development and psychometric properties of the Test of Mathematical Talent). Paper presented at the 2nd National Conference on Talented Children, Eskisehir, Turkey. [ Links ]
38. Schreiber, J. B., Nora, A., Stage, F. K., Barlow, E. A., & King, J. (2006). Reporting structural equation modeling and confirmatory factor analysis results: A review. The Journal of Educational Research, 99(6), 323-338. [ Links ]
39. Shrout, P. E., & Fleiss, J. L. (1979). Intraclass correlations: Uses in assessing rater reliability. Psychological Bulletin, 2, 420-428. [ Links ]
40. Simonton, D. K. (2011). Creativity and discovery as blind variation and selective retention: Multiple-variant definition and blind-sighted integration. Psychology of Aesthetics, Creativity, and the Arts, 5(3), 222-228. [ Links ]
41. Snyder, A., Mitchell, J., Bossomaier, T., & Pallier, G. (2004). The creativity quotient: an objective scoring of ideational fluency. Creativity Research Journal, 16(4), 415-419. [ Links ]
42. Sternberg, R. J., & Davidson, J. E. (1999). Insight. En M. A. Runco, & S. R. Pritzker, (Eds.). Encyclopedia of Creativity (vol. II) (pp. 57-69). New York: Elsevier. [ Links ]
43. Sternberg, R. J., & Lubart, T. I. (1995/1997). Defying the Crowd: Cultivating Creativity in a Culture of Conformity. New York: Free Press. Trad. Castellano, La creatividad en una cultura conformista: un desafío a las masas. Barcelona: Paidós Iberica. [ Links ]
44. Torrance, E. P. (1974). Torrance Tests of Creative Thinking. Beaconville, IL: Scholastic Testing Services. [ Links ]
45. Tschirgi, J. E. (1980). Sensible Reasoning - a Hypothesis About Hypotheses. Child Development, 51(1), 1-10. [ Links ]
46. Weiping, H. & Philip, A. (2002).'A scientific creativity test for secondary school students'. International Journal of Science Education, 24(4), 389-403. [ Links ]
47. Weisberg, R. W. (2014). Case Studies of Genius: Ordinary Thinking, Extraordinary Outcomes. In Simonton, D. K. (Ed.), The Wiley Handbook of Genius (pp. 139-165). Chichester, UK: John Wiley & Sons, Ltd. [ Links ]
48. Windschitl, M., Thompson, J., & Braaten, M. (2008). Beyond the scientific method: Model-based inquiry as a new paradigm of preference for school science investigations. Science education, 92(5), 941-967. [ Links ]
![]() Correspondence:
Correspondence:
María Dolores Prieto.
Facultad de Educación,
Universidad de Murcia,
Campus de Espinardo.
30100 Murcia (Spain).
E-mail: lola@um.es
Article received: 25-11-2015
Revised: 12-02-2016
Accepted: 24-02-2016

