


Meu SciELO
 Serviços customizados
Serviços Personalizados
Journal
Artigo
 Inglês (pdf)
 Artigo em XML
 Referências do artigo
 Enviar este artigo por email
Indicadores
-
 Citado por SciELO
 -
 Acessos
Links relacionados
-
 Citado por Google
 -
 Similares em
SciELO
Similares em
SciELO -
 Similares em Google
Compartilhar

 Permalink
Anales de Psicología
versão On-line ISSN 1695-2294versão impressa ISSN 0212-9728
Anal. Psicol. vol.33 no.1 Murcia Jan. 2017
https://dx.doi.org/10.6018/analesps.33.1.235271
Validation of the Spanish adaptation of the School Attitude Assessment Survey-Revised using multidimensional Rasch analysis
Validación de la adaptación española del School Attitude Assessment Survey-Revised mediante el modelo de Rasch multidimensional
Alejandro Veas, Juan-Luis Castejon, Raquel Gilar and Pablo Minano
University of Alicante (Spain).
The present work was supported by the Vice Chancellor for Research of the University of Alicante [GRE11-15] and the Spanish Ministry of Economy and Competitiveness [EDU2012-32156]. The corresponding author is funded by the Ministry of Economy and Competitiveness (Reference of the grant: BES-2013064331).
ABSTRACT
The School Attitude Assessment Survey-Revised (SAAS-R) was developed by McCoach and Siegle (2003b) and validated in Spain by MiLano, Castejon, and Gilar (2014) using Classical Test Theory. The objective of the current research is to validate SAAS-R using multidimensional Rasch analysis. Data were collected from 1398 students attending different high schools. Principal Component Analysis supported the multidimensional SAAS-R. The item difficulty and person ability were calibrated along the same latent trait scale. 10 items were removed from the scale due to misfit with the Rasch model. Differential Item Functioning revealed no significant differences across gender for the remaining 25 items. The 7-category rating scale structure did not function well, and the subscale goal valuation obtained low reliability values. The multidimensional Rasch model supported 25 item-scale SAAS-R measures from five latent factors. Therefore, the advantages of multidimensional Rasch analysis are demonstrated in this study.
Key words: test validation; multidimensional Rasch model; fit indices; differential item functioning.
RESUMEN
El School Attitude Assessment Survey-Revised (SAAS-R) fue desarrollado por McCoach y Siegle (2003b) y validado en España por Miñano, Castejón, y Gilar (2014) a través del Modelo Clásico de Test. El objetivo del presente estudio es validar el SAAS-R a partir del análisis de Rasch Multidimensional. Los datos se obtuvieron de 1398 estudiantes que asistían a diferentes institutos de Educación Secundaria. El Análisis de Componentes Principales apoyó el modelo Rasch multidimensional. Se calibraron los parámetros de dificultad de los ítems y habilidad de los sujetos a partir de la misma escala latente. Se eliminaron 10 ítems por mostrar desajuste al modelo de Rasch. El Funcionamiento Diferencial del Ítem no mostró diferencias significativas de género con los 25 ítems restantes. La estructura escalar de 7 categorías no mostró un funcionamiento óptimo, y la subescala Valoración de Logro obtuvo niveles bajos de fiabilidad. El modelo Rasch multidimensional apoyó la escala SAAS-R con 25 ítems y 5 factores latentes. De esta forma, se demuestran las ventajas del modelo de Rasch multidimensional en el presente estudio.
Palabras clave: validación de test; modelo de Rasch multidimensional; índices de ajuste; funcionamiento diferencial del ítem.
Introduction
One of the most important scientific objectives in educational psychology is to determine the factors involved in the learning process, since this is a fundamental means to improve curriculum design and students' academic outcomes (Minano & Castejon, 2011; Zeegers, 2004). The importance of different motivational and contextual variables (McCoach, 2002), such as self-regulation (Kitsantas & Zimmerman, 2009; Matthews, Ponitz & Morrison, 2009; McClelland & Wanless, 2012), goal orientations (Inglés, Martinez-Monteagudo, Garcia-Fernandez, Valle, & Castejon, 2014) or attitudes toward school and teachers (Green, Liem, Martin, Colmar, Marsh, & McInerney, 2012) highlight the need of new instruments to assess the main elements that mediate or modulate students' academic performance, besides their cognitive capacity.
In this sense, the School Attitude Assessment Survey-Revised (SAAS-R) was developed by McCoach and Siegle (2003b) in order to explore the underachievement of academically able secondary school students. After some improvement of the instrument (McCoach & Siegle, 2003b), the final scale consisted of 7 questions on the Academic Self-Perceptions (AS) factor (e.g. I am good at learning new things in school), 7 questions on the Attitudes Toward Teachers (ATT) factor (e.g. I like my teachers), 5 questions on the Attitudes Toward School (ATS) factor (e.g. I am proud of this school), 6 questions on the Goal Valuation (GV) factor (e.g. It is importantfor me to do well in school), and 10 questions on the Motivation /Self-Regulation (M/S) factor (e.g. I put a lot of effort into my schoolwork), using a seven-point Likert-type agreement scale.
The Confirmatory Factor Analysis (CFA) supported a final model with five-factor structure of the SAAS-R, exhibited a reasonable fit (CFI = .911) and showed acceptable reliability with an internal consistency for each scale above .85. In addition, several studies have analyzed criterion-related validity, confirming the correlation between attitudes measured by the SAAS-R and students' academic achievement (McCoach & Siegle, 2001, 2003a).
The Spanish adaptation and validation of the SAAS-R was made by MiLano, Castejon, and Gilar (2014). They found that the SAAS-R factors had reasonable internal consistency. The Cronbach's Alpha coefficients for AS, ATT, ATS, GV and M/S were .86, .87, .90, .85 and .90 respectively. Confirmatory factor analysis was conducted to compare the construct validity of the scale with a five-factor model and with five first-order factors and one second-order factor, showed that the first model had better fit for the data (S-B χ2 dif = 255.03, df = 5, p = .000). Direct comparison of residuals also showed a better fit for the five-factor model (Yuan-Bentler residual test statistic = 13.8, df = 5, p =.02). Furthermore, the analysis of evidenced criterion-related validity demonstrated that academic underachievers had the lowest scores on each of the five subscales measured by the SAAS-R.
Although the SAAS-R has been validated using classical test theory, further investigation of the measurement properties of the SAAS-R using modern test theory like Rasch analysis (Wright & Masters, 1982) will equip researchers with more robust confidence in applying the scale in a wider context. In this sense, the arithmetical property of interval scales is fundamental to any meaningful measurement (Wright & Linacre, 1989). However, traditional analytical techniques like factor analysis are usually based on true-score theory and the raw data are not interval data, which only indicate ordering without any proportional meaning. This is not appropriate to apply a factor analytic approach, which has been normally used for exploring or confirming the factor structure of measurement scales directly to non-interval raw data, and the results will always depend on the sample-distribution and item-distribution (Muñiz, 1996). The basic distinction between Rasch model and Factor Analysis is that Rasch model do not focus on reducing the data to a minimum number of latent factors, and provide detailed information about the interaction between persons and items in order to understand their interaction (Reckase, 1997).
The Rasch model (Rasch, 1960, 1980) is the most well-known among item response theories, providing a method based on the calibration of ordinal data from a shared measurement scale and enabling one to test conditions such as dimensionality, linearity, and local independence (Wright, 1997). This model establishes that the difficulty of the items and the ability of the subjects can be measured on the same scale, and the likelihood that a subject responds correctly to an item is based on the difference between the ability of the subject and the difficulty of the item. Both measures (ability and difficulty) are estimated using logit units, because the scale used by the model is logarithmic. Using the same measurement scale establishes homogenous intervals, which means that the same difference between the difficulty parameter of an item and the ability of a subject involves the same probability of success along the entire scale.
In the present study, the SAAS-R, comprising 7-point likert-type items, was to be validated for Spanish sample. Further, the ordered response alternatives were kept invariant for all items in the scale. Consequently, the Rating Scale model (Andrich, 1978; Wright & Masters, 1982) was considered appropriate for fitting the data collected through SAAS-R. Nevertheless, given that school attitudes is a multidimensional construct in theory (McCoach & Siegle, 2003b), a multidimensional Rasch model (Adams, Wilson, & Wang, 1997) is considered more appropriate than a unidimensional Rasch model to assess the measurement properties of SAAS-R. A multidimensional model can simultaneously calibrate all subscales and increase the measurement precision by taking into account the correlations between subscales. Therefore, a multidimensional Rasch Rating Scale model was used in the present study.
Adams, Wilson, and Wang (1997) summarize the advantages of analyses based on multidimensional models:
They take care of the intended structure of the test in terms of the number of subscales.
They provide estimates of the relationships among the dimensions to produce more accurate items and person estimates.
They make use of the relationships among the dimensions to produce more accurate item and person estimates.
They are single rather than multistep analyses.
They provide more accurate estimates that the consecutive approach.
Unlike the consecutive approach they can be applied to tests that contain items which load on more than one dimension.
The present study aims to make use of multidimensional Rasch analysis to validate the dimensionality of the SAAS-R, and to investigate the measurement properties of the scale, such as: reliabilities of subscales, model-data fit of items, the coverage of item difficulty, and category functioning of the rating scale.
Method
Participants
A total of 1456 students in their first and second year of compulsory secondary education participated in this study. Of these, 58 were excluded from the final sample due to having an insufficient command of the language, not having completed the tests in their entirety or because they did not have parental consent. Thus, the final sample consisted of 1398 subjects (n = 1398).
Of the 1398 students that took part, 732 were enrolled in their first year (52.4%), while the remaining 666 were in their second year (47.6%). 52.8% of the sample were males and 47.2% females, ranging between 11 and 15 years of age (M = 12.5, SD = 0.67). In total, 1,137 students (81.4%) attended a state school while 261 (18.6%) attended a state-assisted private school. The ethnic composition of the sample was: 85.5% Spaniards, 8.6% Latin American, 4.3% European, 0.7 Asian, and 0.9% Arab.
Procedure
Once we had obtained the necessary consent from the competent authorities, informed consent was then sought from the students' parents or legal guardians. The instrument was administered in the schools during normal class hours. The scale was administered by collaborating researchers who had previously received instruction in the procedures to follow. On average, approximately 20 minutes were required to administer the test.
Data analysis
In the first place, Winsteps version 3.81 statistical software (Linacre, 2011) was used to check whether the items in each subscale satisfy the two basic assumptions of Rasch measurement: unidimensionality and local independence. Unidimensionality requires that the measurement should target one attribute or dimension at one time (Bond & Fox, 2007, p. 32), and local independence refers to the assumption that the response to one item should have no influence on the responses to any other item within the same test (Wright, 1996). Meanwhile, the point-biserial coefficient, which is an index of item discrimination, for each item was computed to show whether all items had empirically equal item discrimination as is required by Rasch analysis. A multidimensional Rasch Rating Scale model was then fit to the data in this study. The Conquest version 2.0 software (Wu, Adams, Wilson, & Haldane, 2007) was used to conduct the multidimensional Rasch analysis. The SAAS-R was treated as a multidimensional scale containing five unidimensional subscales, and the calibration of the five subscales are conducted at the same time in ConQuest with the Montecarlo method.
Multidimensional Rasch model can be expressed as Pnij = exp (bij θn + aij ξ) / ∑kiu=1 exp (biu θn + aiu ξ), where Pnij is the probability of a response in category j of item i for person n; person n`s levels on the D latent variables are denoted as θn = (θn1,...,θnD), ki is the number of categories in item i, ξ is a vector of difficulty parameters, bij is a score vector given to category j of item i, aij is a design vector given to category j of item i that describes the linear relationship among the elements of ξ (Wang, Cheng, & Wilson, 2005, p. 14). The ConQuest programme (Wu et al., 2007) in which marginal maximum likelihood estimation is implemented was used to estimate model parameters.
Outfit and Infit statistics, as well as the Rasch reliability, were used to check the quality of the scale from a Rasch measurement perspective. These indexes are measures of the extent to which the data match specifications of a Rasch model. Mathematically, they are the mean value of the squared residuals. A residual is the difference between a subject's response to a given item and the expected response calculated by the model. Therefore, the larger the squared residual, the larger was the misfit between data and model. The difference between infit and outfit is based on the way they are computed. Infit statistic gives more importance to those items which are aligned with the person's ability level. More weight is given to those items, as they can carry more information about the person's ability. On the other hand, computation for Outfit statistics is not weighted (Bond & Fox, 2007, p.43). Values of Outfit and Infit mean squares (MNSQ) can range from 0 to positive infinity. Values below 1 indicate a higher than expected fit of the model, while values greater than 1 indicate a poor fit of the model. Thus, if we have and infit value of 1.40, then we can assert that there is 40% more data variability compared to the prediction of the model; while an outfit of 0.80 indicates that 20% less data variability is observed with respect to the model's prediction. There are different criteria in selecting the cut-off values of MNSQ (e.g., Cadime, Ribeiro, Viana, Santos, & Prieto, 2014; Lee, Zhu, Ackley-Holbrook, Brower & Mcmurray, 2014; Linacre, 2012; Prieto & Delgado, 2003). In our case, we used an approximate range of 0.7-1.3 for MNSQ values to be an appropriate indication of good fit between data and model. Lastly, to further investigate the psychometric properties of the scale, differential item functioning (DIF) of items can be analyzed. The existence of DIF indicates that different groups may have different interpretation or perspectives on the items. In this sense, as different studies have claimed that student's motivation and attitudinal patterns can vary across gender (Meece, Bower, & Burg, 2006; Smith, Sinclair, & Chapman, 2002; Vecchione, Alessandri, & Marsicano, 2014), this study was used to investigate the extent to which male and female students have performed differently on the same items.
In order to directly compare the parameter estimates between groups, the mean item parameters were set to be equal (zero). Whether the mean item parameters are identical across groups, the effects of the differences in latent trait levels on DIF analysis are eliminated (Wright & Stone, 1979).
Results
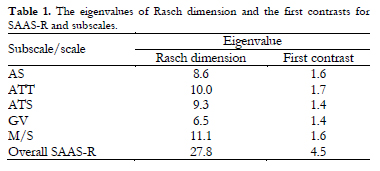
For the analysis of unidimensionality in each subscale, a principal component analysis of the residual scores was conducted (Linacre, 1998; Wright, 1996). This analysis was repeated for the whole scale to check whether or not it satisfied unidimensionality. According to Linacre (2012), an eigenvalue less than 2.0 of the first contrast indicates that the residuals are not relevant enough to disturb the measurement quality. An eigenvalue more than 2.0 implies that there is probably another dimension in the measurement instrument. The Table 1 shows the eigenvalues of Rasch dimension and the first contrast for each subscale and for the whole SAAS-R scale. The eigenvalue of the first contrast for the five subscales were all less than 2.0. This fact implies that the items in the five subscales measure a single latent trait. The eigenvalue of the first contrast for the SAAS-R whole scale was 4.5, which indicate that items in SAAS-R contain more than one dimension. Therefore, the instrument must be considered as a multidimensional scale.
The correlation of residuals, also known as Q3 statistic (Yen, 1984, 1993), when local item independence holds, is approximately -1/ (L-1), where L is test length. That means the ideal value is -0.16 for a 7-item scale; -0.25 for a 5-item scale; -0.2 for a 6-item scale and -0.11 for a 10-item scale. Winsteps provided the correlation of residuals for each item pair. The results showed that, for the 7-item subscale, the correlation of residuals ranged from -0.29 to -0.05; -0.36 to -0.07 for the 5-item subscale; -0.29 to -0.09 for the 6-item subscale; and -0.26 to -0.13 for the 10-item subscale. There were not too much deviated from the expected value. Therefore, no evidence of violation of the assumption of local independence was found. The point-biserial coefficient, as an index of item discrimination, for all the items ranged from 0.37 to 0.69. This small range of item discrimination should be considered as equal enough to justify the use of Rasch model on the data set for an empirical study.
The five dimensions of the SAAS-R scale was calibrated simultaneously in ConQuest and standard fit statistics were computed for each item. In the first ConQuest analysis, the values of Outfit and Infit MNSQ for the majority of items were greater than 0.7 and less than 1.3. Items 4, 14, 18 and 19 showed misfit to the Rasch model. A second analysis was made without these items. At this time, items 30 and 31 showed misfit to the Rasch model. In the third analysis, items 13, 17, 21 and 32 did not fit well to the Rasch model, which sum a total of 10 misfitted items. The remaining 25 items showed good fit in final analysis (Table 2).
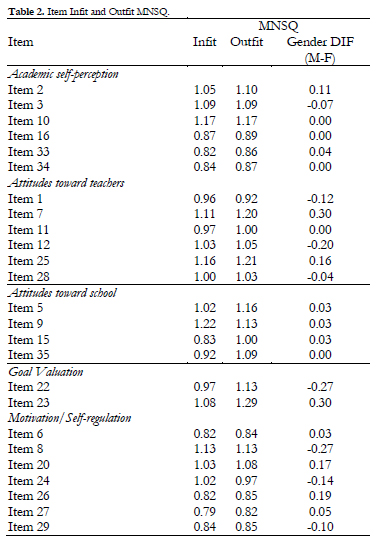
The analysis of Differential Item Functioning (DIF) estimated the distribution of the difficulty parameter in the sample of males and females. As suggested by previous researchers (Wang, Yao, Tsai, Wang, & Hsieh, 2006), a difference equal to or larger than 0.5 logits was regarded as evidence of substantial DIF. The results showed indicated that no substantial DIF was found. Male and female students with the same level of school attitudes would have similar responses. Table 2 presented the Infit, Outfit MNSQ, and the maximum differences in the estimates of item difficulties across gender for these 25 items.
With the Rasch model is possibly to calibrate a person's measure from low to high, as item difficulty changes from easy to hard along the same latent trait scale. In the itemperson map (see Figure 1) the five continuums on the left side indicate the student's measures in the five dimensions of school attitudes. Students who had higher levels in school attitudes were placed at the top of the continuum and those who had lower levels in school attitudes were placed at the bottom of the continuum. In addition, the items that fell into each of the five dimensions were clustered on the right side. The items with higher difficulty level were placed at the top, and the items with lower difficulty level were placed at the bottom.

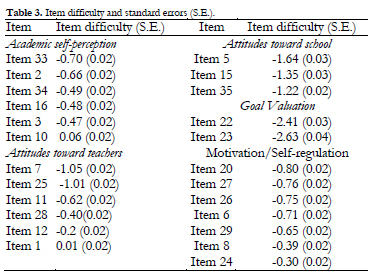
The item difficulty in Table 3 revealed that ranged from -2.63 to 0.06 logits. The most difficult item came from ASP (item 10), whereas the least difficult items came from GV (item 22).
With respect to precision of the estimation of the subject, indexes of overall reliability (Person Separation Index) were calculated. The values were .81 for AS, .82 for ATT, .72 for ATS, .25 for GV, and .84 for M/S. It can be observed the lack of measurement precision of the fourth factor, due to the low number of fitted items (see discussion).
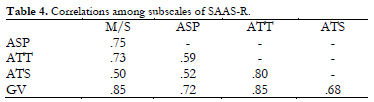
The multidimensional approach could calibrate all subscale at the same time, and increase the measurement precision by taking into account the correlations between subscales (Wang, Yao, Tsai, Wang, & Hsieh, 2006). It can be observed in Table 4 that the correlations among subscales ranged from .52 to .73, showing medium to high correlation levels. This fact implies that a better improvement could be achieved by multidimensional approach.
Another characteristic in Rasch analysis is the possibility to check the category's function of the rating scale (Linacre, 2002). According to Linacre and Wright (1998), the step calibration (the intersection points of adjacent probability curves) of the rating scale must increase monotonically to ensure that higher measures on the items represent higher traits under measurement. Linacre (2002) suggested that step calibration must advance by at least 1.4 logits for items with a 3-category scale. In this case, with 7-category scales, a shorter distance between category step calibrations is acceptable.
The Item Characteristic Curve (ICC) fits the model, which means that the greater the ability of the subject is, the greater the probability of obtaining a higher category in the item. By observing the categories (see figure 2), the equitable distribution of the categories is appreciated. The 7 curves in the figure, labeled as 0, 1, 2, 3, 4, 5 and 6, indicate the probability of each of the five possible responses to the item. The probability curve of category is almost subsumed under the probability curve of categories 0 and 2. The difference between step calibration 1 and 2 was 0.12, which indicates that the category 1 is the single most probable response for very few students. The distance between step calibrations 2 and 3 was 0.41 logits; 0.19 logits for the distance between step calibrations 3 and 4; 0.39 logits for the distance between step calibration 4 and 5, and 0.75 logits for the distance between step calibration 5 and 6. The results indicated that the 7-category structure did not function well for the SAAS-R.

Discussion
The SAAS-R was developed to investigate the school attitudes of secondary students (McCoach & Siegle, 2003b), and was validated in Spain with classic test theory (Minano, Castejon & Gilar, 2014). The present study aims to analyze the psychometric properties of the SAAS-R with multidimensional Rasch model.
In light of the results, 25 items showed good fit to the Rasch model, whereas 10 items showed misfit: one item in the AS subscale (item 31); one item in the ATT subscale (item 13); one item in the ATS subscale (item 4); four items in the GV subscale (items 14, 17, 19 and 32); and three items in the M/S subscale (items 18, 21 and 30). After deleting these 10 items, the remaining 25 items functioned well, and each subscale measures a single latent trait. However, GV subscale suffered from a lack of measurement precision, with only two items remaining. Person Separation Index was calculated, showing poor values for GV, whereas good values for the rest of subscales. It can be observed that GV subscale has high correlated levels, which could imply that the content of the items is significantly related to items from other subscales (for instance, items from M/S). Further research is necessary to enhance the GV subscale property by revising its content and/or adding new items, as there are different classification of goal orientation models (Elliot, 2005; Meece, Anderman, & Anderman, 2006).
Evidence of good psychometric properties comes from the gender DIF analysis, and the impact of gender difference was taken into consideration in this study. DIF analysis was performed to check the construct equivalence across gender. No substantial gender DIF was found for the remaining 25 items.
Through Rasch analysis, student's measure of school attitudes were calibrated from low to high as the item difficulty from easy to hard along the same measurement scale. By using the same logit scale, it is easy to establish direct comparisons between person abilities and item difficulties based on their locations on the latent trait continuum. In general terms, both person ability and item difficulty spread a wide and reasonable range along the latent trait scale. Items 22 and 23 are not well-targeted, as they are very easy items to the sample. This fact highlights the lack of subscale quality described above.
The functioning of response categories was analyzed. The results indicated that the 7-category structure did not function well for the SAAS-R. The probability curve of category 1 is almost subsumed under the probability curve of categories 0 and 2, suggesting that the category 1 is not a valid option for most students. A better rating scale structure (e.g., a 6-category structure) could be requested for further research.
In conclusion, multidimensional Rasch analysis has lent support to the 25-item SAAS-R to measure five subscales, although further improvement could be made. Moreover, investigations could be made in order to check whether another rating scale structure can function better than the current 7-category for the SAAS-R. A revision of the GV subscale is needed, in order to improve measurement precision. With this study, the efficacy of the Rasch model is checked with SAAS-R in order to obtain a more accurate evaluation. The advantages of multidimensional Rash analysis in improving measurement precision, by taking into account the correlation between subscales in a multidimensional scale, demonstrated a good framework to its application in educational science.
References
1. Adams, R. J., Wilson, M., & Wang, W. C. (1997). The multidimensional random coefficient multinomial logit model. Applied Psychological Measurement, 21(1), 1-23. [ Links ]
2. Andrich, D. (1978). A rating formulation for ordered response categories. Psychometrika, 43, 561-573. [ Links ]
3. Bond, T. G., & Fox, C. M. (2007). Applying the Rasch model: Fundamental measurement in the human sciences (2nd ed.). Mahwah, N. J.: Erlbaum. [ Links ]
4. Cadime, I., Ribeiro, I., Viana, F. L., Santos, S., & Prieto, G. (2014). Calibration of a reading comprehension test for Portuguese students. Anales de psicología, 30(3), 1025-1034. [ Links ]
5. Elliot, A. J. (2005). A conceptual history of the achievement goal construct. In A. J. Elliot & C. S. Dweck (Eds.), Handbook of competence and motivation (pp. 52-72). New York, USA: The Guilford Press. [ Links ]
6. Green, J., Liem, G.D., Martin, A.J., Colmar, S., Marsh. H.W., & McInerney, D. (2012). Academic motivation, self-concept, engagement, and performance in high school : Key processes from a longitudinal perspective. Journal of Adolescence, 35(5), 1111-1122. [ Links ]
7. Inglés, C. J., Martínez-Monteagudo, M. C., García-Fernández, J. M., Valle, A., & Castejón, J. L. (2014). Goal orientation profiles and self-concept of secondary school students. Revista de Psicodidáctica, 20(1), 99-116. [ Links ]
8. Kitsantas, A., & Zimmerman, B. J. (2009). College students' homework and academic achievement: The mediating role of self-regulatory beliefs. Metacognition and Learning, 4(2), 97-110. [ Links ]
9. Lee, M., Zhu, W., Ackley-Holbrook, E., Brower, D. G., & McMurray, B. (2014). Calibration and validation of the Psysical Activity Barrier Scale for persons who are blind or visually impaired. Disability and Health Journal, 7, 309-317. [ Links ]
10. Linacre, J. M. (1998). Structure in Rasch residuals: Why principal component analysis? Rasch Measurement Transsactions, 12, 636. [ Links ]
11. Linacre, J. M. (2002). Optimizing rating scale category effectiveness. Journal of Applied Measurement, 3, 85-106. [ Links ]
12. Linacre, J. M. (2011). Winsteps (version 3.81) (computer software). Chicago: MESA. [ Links ]
13. Linacre, J. M., & Wright, B. D. (1998). A user's guide to Bigsteps/Winsteps. Chicago, IL: Winsteps.com. [ Links ]
14. Linacre, J. (2012). A user's guide to Winsteps & Ministeps RaschModel Computer Programs. Program Manual 3.74.0. 2012. Access in October 2014, from http://www.winsteps.com/winman/. [ Links ]
15. Matthews, J.S., Pointz, C.C., & Morrison, F.J. (2009). Early gender differences in self-regulation and academic achievement. Journal of Educational Psychology, 101(3), 689-704. [ Links ]
16. McCoach, D. B. (2002). A validation study of the School Attitude Assessment Survey. Measurement and Evaluation in Counseling and Development, 35, 66-77. [ Links ]
17. McCoach, D. B., & Siegle, D. (2001). A comparison of high achievers' and low achievers' attitudes, perceptions, and motivations. Academic Exchange Quarterly, 5, 71-76. [ Links ]
18. McCoach, D. B., & Siegle, D. (2003a). Factors that differentiate underachieving gifted students from high-achieving gifted students. Gifted Child Quarterly, 47, 144-154. [ Links ]
19. McCoach, D. B., & Siegle, D. (2003b). The School Attitude Assessment Survey-Revised: A new instrument to identify academically able students who underachieve. Educational and Psychological Measurement, 63, 414-429. [ Links ]
20. Meece, J. L., Anderman, E. M., & Anderman, L. H. (2006). Classroom goal structure, student motivation, and academic achievement. Annual Review Psychology, 57, 487-503. [ Links ]
21. Meece, J. L., Bowwer, B., & Burg, S. (2006). Gender and motivation. Journal of School Psychology, 44(5), 351-373. [ Links ]
22. Miñano, P., & Castejón, J. L. (2011). Variables cognitivas y motivacionales en el rendimiento académico en Lengua y Matemáticas: un modelo estructural. Revista de Psicodidáctica, 16(2), 203-230. [ Links ]
23. Miñano, P., Castejón, J. L., & Gilar, R. (2014). Psychometric properties of the Spanish Adaptation of the School Attitude Assessment Survey-Revised. Psicothema, 26(3), 423-430. [ Links ]
24. Muñiz, J. (1996). Psicometría. Madrid: Universitas S.A. [ Links ]
25. Prieto, G., & Delgado, A. R. (2003). Análisis de un test mediante el modelo de Rasch. Psicothema, 15(1), 94-100. [ Links ]
26. Rasch, G. (1960). Probabilistic models for some intelligence and achievement test. Copenhagan: Danish Institute for Educational Research. [ Links ]
27. Rasch, G. (1980). Probabilistic models for some intelligence and achievement test (Expanded ed.). Chicago: University of Chicago Press. [ Links ]
28. Reckase, M. M. (1997). The past and the future of multidimensional item response theory. Applied Psychological Measurement, 21(1), 25-36. [ Links ]
29. Smith, L., Sinclair, K. E., & Chapman, E. S. (2002). Student's goals, selfefficacy, self-handicapping and negative affective responses: An Australian senior school student study. Contemporary Educational Psychology, 27, 471-485. [ Links ]
30. Vecchione, M., Alessandri, G., & Marsicano, G. (2014). Academic motivation predicts educational attainment: Does gender make a difference? Learning and Individual Differences, 32, 124-131. [ Links ]
31. Wang, W. C., Cheng, Y. Y., & Wilson, M. (2005). Local item dependence for items across tests connected by common stimuli. Educational and Psychological Measurement, 65(1), 5-27. [ Links ]
32. Wang, W. C., Yao, G., Tsai, Y. J., Wang, J. D., & Hsieh, C. L. (2006). Validating, improving reliability, and estimating correlation of the four subscales in the WHOQOL-BREF using multidimensional item response models. Psychological Methods, 9(1), 116-136. [ Links ]
33. Wright, B. D. (1996). Local dependency, correlations and principal components. Rasch Measurement Transactions, 10(3), 509-511. [ Links ]
34. Wright, B. D. (1997). A history of social science measurement. Educational Measurement: Issues and Practice, 16(4), 33-45. [ Links ]
35. Wright, B. D., & Linacre, J. M. (1989). Observations are always ordinal; measurements, however, must be interval. Archives of Physical Medicine and rehabilitation, 70(12), 857-860. [ Links ]
36. Wright, B. D., & Masters, G. N. (1982). Rating scale analysis. Chicago: MESA Press. [ Links ]
37. Wu, M. L., Adams, R. J., Wilson, M. R., & Haldane, S. A. (2007). ACER ConQuest, version 2.0: Generalised item response modelling software. Camberwell, Victoria: Australian Council for Educational Research. [ Links ]
38. Yen, W. M. (1984). Effect of local item dependence on the fit and equating performance of the three parameter logistic model. Applied Psychological Measurement, 8, 125-145. [ Links ]
39. Yen, W. M. (1993). Scaling performance assessments: strategies for managing local item dependence. Journal of Educational Measurement, 30, 187-213. [ Links ]
40. Zeegers, P. (2004). Student learning in higher education: a path analysis of academic achievement in science. Higher Education Research and Development, 23, 35-56. [ Links ]
![]() Correspondence:
Correspondence:
Alejandro Veas.
Department of Developmental Psychology and Didactic,
University of Alicante.
PO 99, 03080, Alicante (Spain).
E-mail: alejandro.veas@ua.es
Article received: 08-08-2015
Revised: 14-10-2015
Accepted: 05-11-2015

