


Mi SciELO
 Servicios personalizados
Servicios Personalizados
Revista
Articulo
 Inglés (pdf)
 Articulo en XML
 Referencias del artículo
 Enviar articulo por email
Indicadores
-
 Citado por SciELO
 -
 Accesos
Links relacionados
-
 Citado por Google
 -
 Similares en
SciELO
Similares en
SciELO -
 Similares en Google
Compartir

 Permalink
Anales de Psicología
versión On-line ISSN 1695-2294versión impresa ISSN 0212-9728
Anal. Psicol. vol.33 no.1 Murcia ene. 2017
https://dx.doi.org/10.6018/analesps.33.1.225921
Computerized Adaptive Assessment of Organizational Climate
Evaluación adaptativa informatizada del clima organizacional
Fernando Menéndez1, Elsa Peña-Suárez2, Eduardo Fonseca-Pedrero3,4 and José Muñiz1,4
1 Secondary School of Salinas. The Regional Ministry of Education and Culture of Principality of Asturias (Spain).
2 Educational Counselling of Aviles. The Regional Ministry of Education and Culture of Principality of Asturias (Spain).
3 Department of Educational Sciences, University of La Rioja (Spain).
4 Centre for Biomedical Research in Mental Health Network (CIBERSAM) (Spain).
This research was funded by the Department of Public Administration of the Government of the Principality of Asturias (FUO-EM-305-06) and Spanish Ministry of Science and Innovation (PSI 2011-28638, PSI 2014-56114-P). We thank the Government of the Principality of Asturias for their collaboration in the gathering of data.
ABSTRACT
Computerized Adaptive Tests (CAT) constitutes a major advance in the field of the assessment of social sciences and health. It is interesting to incorporate this methodological development to organizational field. The objective of this research is to develop a CAT for evaluating the organizational climate. In order to do this, a bank of 160 items was constructed, which was administered to a sample of 3,163 workers (M age= 51.90 years; SD= 6.28 years). The results show that the CAT works efficiently for the three item banks used (150, 130 and 50 items). The information function shows that the latent trait in the whole range of values is measured with similar accuracy. The correlation between the scores obtained with the CAT, the three item banks and the CLIOR scale of organizational climate was higher than .90 in all cases (SE<0.32). With a SE< 0.32, the 150 item CAT uses a mean of 22.5 items (SD = 13.5 items). The CAT developed allows an accuracy and useful assessment of the organizational climate on organizational settings and research.
Key words: organizational climate, computerized adaptive testing, item reponse theory, assessment.
RESUMEN
Los Tests Adaptativos Informatizados (CAT) constituyen un gran avance en el campo de la evaluación de las ciencias sociales y de la salud. Es interesante incorporar este desarrollo metodológico al campo de la psicología organizacional. El objetivo de esta investigación es desarrollar un CAT para evaluar el clima organizacional. Para ello, se construyó un banco de 160 ítems, que se administró a una muestra de 3163 trabajadores (M = 51,90 años; DT = 6,28 años). Los resultados muestran que el CAT funciona de manera eficiente para los tres bancos de ítems utilizados (150, 130 y 50 ítems). La función de información muestra que el rasgo latente se mide con una precisión similar en todo el rango de valores. La correlación entre las puntuaciones obtenidas con el CAT, los tres bancos de ítems y la escala CLIOR de clima organizacional fue superior a 0,90 en todos los casos (ET <0,32). Con una precisión fiajada en ET <0,32, el CAT de 150 ítems utiliza una media de 22,5 ítems (DT = 13,5). El CAT desarrollado permite una evaluación útil y precisa del clima organizacional en contextos organizacionales.
Palabras clave: clima organizacional, tests adaptativos informatizados, teoría de respuesta a los ítems, evaluación.
Introduction
Computerized Adaptive Testing (CAT) can save time and alleviate the burden on both examinees and test administrators, as compared to traditional computer-based or pen-and-paper assessments (Chien et al., 2011; Chien, Wu, Wang, Castillo, & Chou, 2009; Lord, 1990; Wainer et al., 1990). CAT, which is based on Item Response Theory (IRT), is a test administration method that tailors the assessment to the latent-trait level of the examinee (Cella, Gershon, Lai, & Choi, 2007; Jette, Haley, Ni, Olarsch, & Moed, 2008; Lord, 1990). CAT has attracted much attention because of its better control of item exposure and lower cost of item development (Chien, Wang, Wang & Lin, 2009; Jette et al., 2008). CAT overcomes the shortcomings of the two traditional forms of standardized assessments, both the burdens associated with lengthy assessments and the loss of precision and reliability of shorter fixed-form assessments. Furthermore, CAT may considerably improve test precision and lower floor and ceiling effects as compared to the short form surveys being used today (Bjorner, Chang, Thissen & Reeve, 2007).
In CAT administration, the program uses the response to an initial question to establish a general range of likely function. Subsequent questions are selected through the application of algorithms to progressively refine the estimated score to the range of precision established a priori by the examiner. Regardless of the actual items administered all scores are on the same scale, which supports comparisons across time or across groups of individuals with different levels of current functional performance. The development of a CAT requires: a) a set of items (item bank) that examine each outcome; b) items that scale consistently on a single dimension from low to high ability (latent trait); and c) rules to guide starting, stopping, and scoring. Although CAT offers a potential solution to the conflict between psychometric adequacy and measurement feasibility, the psychometric properties of CAT instruments must be demonstrated empirically (Jette, et al., 2008).
Item banks and CATs have the potential to greatly improve the assessment of health and social sciences outcomes (Bjorner et al., 2007; Cella et al., 2007; Jette et al., 2008). Since the 90s, a variety of CATs have been developed in different healthcare fields (Revicki & Cella, 1997), such as those for rheumatoid arthritis (Martin et al., 2007), cancer (Petersen et al., 2006), pediatrics (Allen, Ni, & Haley, 2008), back pain (Kopec et al., 2008), anxiety (Gibbons et al., 2008; Walter et al., 2007), depression (Smits, Cuijpers, & van Straten, 2011), schizotypy (Fonseca-Pedrero, Menéndez, Paino, Lemos-Giráldez, & Muñiz, 2013), quality of life of individuals attending primary care settings (Rebollo et al., 2010), activities of daily living function in stroke patients (Chien et al., 2009), enterprising personality assessment (Pedrosa, Suárez, García-Cueto, & Muñiz, 2016) or functioning and disability in older adults (Jette et al., 2008).
Moreover, a web-based computer adaptive testing application has been found regarding workers' perceptions of job satisfaction among hospital employees in Taiwan (Chien et al., 2011). The Rasch model (Andrich, 1978; Rasch, 1960) was used to examine workers' responses to the Job Content Questionnaire (JCQ) (Cheng, Luh & Guo, 2003) in 2008. The items meeting the requirements of the Rasch model were used to construct the Web-CAT in 2009. Of the 37 items on the tool, 24 items fit the model fairly well. The person-separation reliability for the 2008 surveys was 0.88. Measures from both years and a job satisfaction item for groups were successfully evaluated through item-by-item analyses using the t-test. Workers aged 26-35 felt that job satisfaction was significantly worse in 2009 than in 2008, and female nurses with work tenure beyond 18 years showed the most significant deterioration.
The organizational climate is the set of perceptions shared by workers in a given workplace. It is essential to address this construct in the study of individual and group behaviors that occur within organizations (Asif, 2011; Denison, 1996; Ostroff, Kinicky, & Tamkins, 2003). Organizational climate is a fundamental construct in work and organizational settings, as it provides an appropriate context for studying organizational behavior, allowing the exploration of individual and group behaviors (Asif, 2011; Denison, 1996; Ostroff, Kinicky, & Tamkins, 2003). A large number of empirical studies have linked this construct with diverse factors, such as job satisfaction (Schnake, 1983), commitment (deCotiis & Summers, 1987), psychological well-being (Cummings & deCotiis, 1973), absenteeism (Steel, Shane, & Kennedy, 1990), psychosocial risks (Vartia, 2008), or violence in the workplace (Cole, Grubb, Sauter, Swanson, & Lawless, 1997). Relations have also been found between organizational climate and various types of performance in organizations, ineluding economic (profitability, productivity, etc.), technological (development of new products, etc.), commercial (market share, specific niches, etc.) and social performance (effects on consumers, supplies, and the general public) (Bartram, Robertson, & Callinan, 2002). The most common and traditional way of assessing organizational climate is through self-reports covering several dimensions, such as autonomy, cohesion, trust, pressure, support, recognition, impartiality, and innovation (Muñiz, Peña-Suárez, de la Roca, Fonseca-Pedrero, & García-Cueto, 2014; Peña-Suárez, Muñiz, Campillo-Álvarez, Fonseca-Pedrero, & García-Cueto, 2013). It will be interesting, however, to introduce new measurement models to this field of research, since advances in the measurement field, such as IRT framework, improve the precision in the assessment of this construct as well as its comprehension.
To date, a CAT for organizational climate assessment has not yet been developed. It could be interesting to incorporate this methodological development to organizational field. It is possible that these new assessment methods allow us to improve our accuracy on it measure as well as our knowledge about the organizational constructs. Within this framework of research, the main goal of this study is to develop a new CAT for assessing organizational climate in a large sample of workers. In order to achieve this overall goal, there are three specific objectives: First, to study the psychometric properties of three banks of items (150, 130, and 50 items). Second, to develop the CAT, which works both on-line and offline. Third, to test the efficiency of the CAT with each of the three item banks designed. It is hypothesized that sound reliability of the item banks will be established. It is further hypothesized that CAT will assess with more efficiency organizational climate construct.
Method
Participants
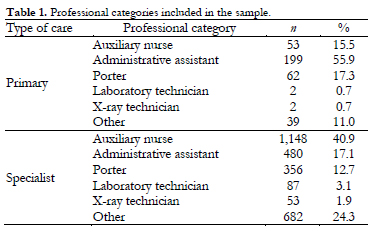
The sample was made up of 3,163 workers in the public health service of the Principality of Asturias (a region situated in northern Spain). With some minimal exceptions due to random factors, the sample practically coincides with the entire population of workers in the healthcare field from the Principality of Asturias, except for physicians and nurses. In total, 88.7% of respondents worked in specialized care and 11.3% in primary care. The mean age was 51.90 years (SD= 6.28). Eighty per cent of the participants in the sample were women, and 20% were men. Table 1 shows the professional groups and categories assessed. Of the 3,163 participants that comprised the original sample, 442 participants were eliminated due to presenting missing data in any of the 160 items. Thus there were 2,721 participants in the final sample on which the CAT for organizational climate is based.
Instruments
The CLIOR scale (Peña-Suárez et al., 2013). This measuring instrument enables the assessment of organizational climate from Classical Test Theory and consists of 50 Likert-type items. Psychometric properties of the CLIOR scores are well stablished. Previous studies showed a Cronbach's alpha of 0.97 and an essentially one-dimensional structure. The discrimination indices of the items were all greater than 0.40 and none of the items displayed differential functioning by sex. Organizational climate is a fundamental construct in work and organizational settings, as it provides an appropriate context for studying organizational behavior, allowing the exploration of individual and group behaviors (Peña-Suárez et al., 2013).
The initial bank consists of 160 items on organizational climate, in Likert-type format with five response alternatives. It was applied using a pen-and-paper measuring instrument with a sample of 3,163 Spanish healthcare workers. The items were designed with the purpose of evaluating the fundamental facets that make up the aforementioned construct: Work organization (23 items), Autonomy (7 items), Participation (7 items), Cooperation (17 items), Rewards (23 items), Relations (19 items), Job attachment (30 items), Work-life balance (10 items), Innovation (7 items), and Physical conditions (17 items) (Muñiz et al., 2014; Peña-Suárez et al., 2013).
For the construction of the items we followed recent psychometric developments and guidelines (American Educational Research Association, American Psychological Association, & National Council on Measurements in Education, 2014; Delgado-Rico, Carretero-Dios, & Ruch, 2012; Downing & Haladyna, 2006; Haladyna, 2004; Moreno, Martínez, & Muñiz, 2006, 2015; Muñiz & Fonseca-Pedrero, 2008; Navarro-González, Lorenzo-Seva, & Vigil-Colet, 2016).
The operational definition of each CLIOR subscales is:
1. Autonomy (7 items). You value when the exercised supervision is flexible in nature and allows for a certain degree of autonomy when it comes to decision making in the work place (e.g. my superiors monitor me very closely).
2. Cooperation (14 items). You try and understand the meaning and the motive behind the level of support given by colleagues and superiors (e.g. it's easy to find help when I need it).
3. Balance Work-Life (10 items). Indicate to what extent your working hours allow for you to fulfil commitments in your personal life (e.g. my working hours adapt well to personal commitments).
4. Innovation (7 items). This refers to the company's degree of innovation, dynamism, and adaptation to current market requirements and also to whether the organization encourages its employees to generate further innovation (e.g. my work place values innovative contributions).
5. Participation (7 items). This shows the extent of freedom the company offers to employees to suggest new ideas and procedures that could enhance performance levels (e.g. everything is decided by those high up in the company.)
6. Incentives (27 items). This corresponds to the employees' evaluation of the level of compensation received for a job well done (e.g. I personally feel that I give more than what I get back in my job.)
7. Organization of work (23 items). This represents the importance that the organization gives to rules and procedures; to what extent the company controls the organizational aspects of each post in order to ensure that these objectives are clear and transparent (e.g. the correlation between my job description and the tasks that I undergo is good).
8. Relationships (19 items). This measures the employees' perception of the working environment and whether or not they feel they work within an agreeable working atmosphere with positive interactions, in a horizontal sense (with colleagues) or in a vertical sense (bosses and superiors). (e.g. I genuinely feel that my superiors support me).
9. Sense of identification (28 items). This refers to the feeling of satisfaction and the sense of accomplishment and pride associated with doing the job (e.g. my job title is given the social acceptance that it deserves).
10. Physical conditions of the job (18 items). This refers to all of those aspects related to the physical conditions of the job such as the working environment, temperature, noise level, lighting etc. (e.g. the air conditioning in my workplace makes it an unpleasant environment to work in); it also refers to aspects related to the outlay and design of the work space, such as the distribution of office furniture for example. (e.g. The layout and working space in my place of work is well distributed).
Procedure
All public healthcare workers in the Principality of Asturias except doctors and nurses received a pen-and-paper questionnaire, addressed to them by name, consisting of the 160 items that made up the item bank used. They were informed that their responses would be anonymous and confidential, and that upon completion of the questionnaire they were to deliver it anonymously to the personnel department. The study was approved by the research and ethic committee at the University of Oviedo.
Design and data analyses
The first objective was to create three item banks of different sizes: 150, 130, and 50 items. Firstly, the initial bank of 160 items was screened. The criteria for elimination of items in this first phase of the study were threefold and followed IRT protocol: items with a corrected item-total correlation of less than 0.15 were deleted (9 items) as well as items showing Differential Item Functioning (DIF) by sex (1 item). These 10 items did not fit the IRT model used, having standardized residuals greater than 2. After this initial item-screening process, the first bank was formed with 150 items. Subsequently, from the 150 item bank a second bank of 130 items was developed. To avoid the problem of the standardized residuals' sensitivity to sample size (Hambleton, 1989), the items were calibrated with four different sample sizes: 1,500, 1,000, 500, and 2,221 (Rojas-Tejada & Pérez-Meleéndez, 2001).
As screening criteria, items with a lambda of less than 0.5 points and with a standardized residual greater than 2 points were removed, in at least three of the four sample sizes analyzed. The Pearson correlation between the lambda and standard errors of the items was -.81. The response patterns of individuals that had a poor fit to the data were also eliminated. Finally, starting again with the original bank of 160 items, 110 items were removed that had higher standardized residuals in the calibration of these in the four sub-samples established. A third bank of 50 items was obtained with an essentially unidimensional internal structure. To assess the psychometric properties of the CAT, the three banks of 150, 130 and 50 items were administered to a subsample of 500 individuals randomly selected from the initial sample. The scores on the CAT for this subsample were correlated with the total scores obtained in all items of the three banks, as well as the scores obtained on the CLIOR scale.
To estimate the CAT scores, five levels of error estimation (SE) were used: 0.20, 0.32, 0.40, 0.50, and 0.60. The number of items required to obtain the scores with these error rates was calculated. To improve the validity of the results, the 500 cases in which the CAT was administered were not used in the calibration of the items (Smits, Cuijpers, & van Straten, 2011).
For the preparation of the item banks, the following were evaluated: a) the unidimensionality of the items, estimated according to the percentage of variance explained by the first factor; b) the goodness of fit indices of the data to the Graduated Response Model by Samejima (1969, 1974); and c) the invariance of the different parameters of the model (Aguado, Rubio, & Haley, 2005). Then, the correlations between the scores obtained on the CAT and those obtained in the administration of all of the items of the three banks were calculated. The correlations between the scores on the CAT and those obtained on the CLIOR pen-and-paper scale were also calculated.
For the construction of the computerized adaptive version the CAT algorithm was implemented (Van der Linden & Glas, 2001; Walter, 2010), using self-developed software in PHP with client-server technology. This software allows online management of the CAT that has been designed. The algorithm performs the following steps: a) it initially starts with a parameter estimate of ^θ0 = 0.0 which is assumed as the population mean; b) in order to estimate the following value of θ, the item that presents the highest information value for the estimated θ is selected and presented to the participant for him/her to provide an answer; and c) once the participant's response is obtained, it is used to obtain a new estimate of ^θ1 and to select the corresponding standard error. Steps b and c are repeated until one of the following criteria are met: a) a previously established fixed number of items is administered, or b) a given level of error in the estimation of the participants' scores is reached. Five different levels of SE were established to estimate the CAT scores: 0.20, 0.32, 0.40, 0.50, and 0.60.
The Graduated Response Model by Samejima was used for the estimation of item parameters (Samejima, 1969, 1974), using MULTILOG software (Thissen, 1991). Additionally, using the IRT framework, an Item Characteristic Curve (ICC) was constructed for each item. This curve, or trace line, reflects the probability of the person's response to each item and his/her level on the latent construct measured by the scale. Furthermore, IRT allows us to estimate the contribution each item makes to the assessment for each level of the latent construct: the information function. The SE is inversely linked to the information distribution used, and hence, the estimated standard error is available for each assessment.
Results
Psychometric properties of the item banks
Table 2 summarizes the values of unidimensionality and internal consistency of each of the item banks and the CLIOR scale. Exploratory Factor Analysis (EFA) carried out on the bank of 150 items indicates that the first factor explains 21.9% of the total variance, which means that the bank is not strictly unidimensional (Reckase, 1979). This fact is corroborated if we use the ratio test between the first two eigenvalues resulting from the EFA. Accordingly, the ratio of 4.0 between the two eigenvalues is close to the value of 5 points established as the minimum criterion by some authors (Martínez-Arias, 1995). Furthermore, the Cronbach alpha coefficient reached a value of 0.97, indicating a high internal consistency of the item bank scores.

With regards to the bank of 130 items, a first dominant factor explains 24.2% of the total variance. The internal consistency was high, with a coefficient alpha of .97. The bank of 50 items had a much more pronounced unidimensionality than the two previous item banks, with the first factor explaining 40.1% of the total variance. The internal consistency was .97, as in the previous bank.
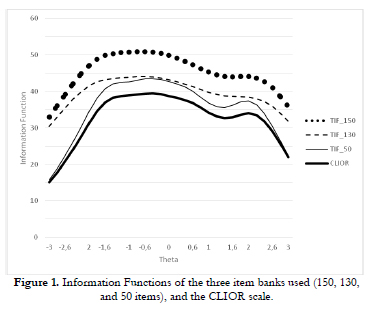
The information functions of the three banks of items and the CLIOR scale are shown in Figure 1. The test information function is plateau-shaped indicating similar accuracy in the measurement of the trait across the range of values, even at the extremes.
Psychometric functioning of the CAT
Table 3 shows the correlation between the theta estimated in the CAT with the total score of the CLIOR scale as well as with the total sum of the items in each bank respectively. As can be observed, setting the stopping criterion at SE<0.32 and with the random sample of 500 participants, correlations between the banks of 150, 130, 50, and the CLIOR scale were found, of .94, .94, .92, and .94 respectively. When the 50 items of the traditional CLIOR pen-and-paper scale were administered and adaptively computerized, the correlation between the two scores was .98 and the intraclass correlation coefficient was .93. This result is interesting and can be taken as a criterion for validation of the algorithm developed for the CAT.

As seen in Table 4, the CAT with 150 items requires an average of 22.5 items (SD=13.5) to obtain a reliable estimate of the latent trait with a SE< 0.32. This average number of items needed to achieve a reliable estimate with the CAT decreases to 7.1 items (SD=3.3) in the case of a stopping criterion established at SE< 0.60. The bank of 130 items, despite having increased its unidimensionality in relation to the bank of 150 items, did not present greater efficiency with regards to the average number of items required to achieve a reliable estimate of the trait studied. It required, as with the bank of 150 items, an average of 22.7 items (SD=12.1) to achieve a reliable estimate of the latent trait with this adaptive procedure.
The bank of 50 items, however, showed notable efficiency when stopping criteria were established at SE< 0.32. Only an average of 14 items was needed to establish a sufficiently accurate estimate of the trait studied. Below this stopping value, the CAT exhausts all items before reaching the stopping criterion. If, on the other hand, the stopping criterion is set to the value of SE<0.50, the average number of items necessary to achieve a reliable estimate of the trait is 6.7.
Discussion
The main goal of this research is to develop a CAT for assessing the organizational climate in a representative sample of workers in the public health service of the Principality of Asturias. The organizational climate is the set of perceptions shared by workers in a given workplace. It is essential to address this construct in the study of individual and group behaviors that occur within organizations (Asif, 2011; Denison, 1996; Ostroff, Kinicky, & Tamkins, 2003). The most common way to evaluate the organizational climate is through self-reports that measure the various dimensions of the construct (Ekvah, 1996). According to previous works, the most relevant dimensions would be the organization of work, autonomy, participation, cooperation, rewards, relationships, connection, innovation, timetables, and work-life balance (Carr, Schimidt, Ford, & DeShon, 2003; Delgado-Rico et al., 2012; Fernández-Ballesteros & Sierra, 1984; Corral & Pereña, 2010; González-Romá et al., 1996; Jarde et al., 2012; López-Fernández et al., 1988; Muñiz et al., 2014; Ostroff, 1993; Thumin & Thumin, 2011). Most of these facets are convergent with those used in the CLIOR scale. It is possible to obtain a general factor of organizational climate that will group together all of the facets (Corral & Perena, 2010; James et al., 2008; Jones & James, 1979; Lazarus, 1982; Lazarus & Folkman, 1984; Peña-Suárez et al., 2013). The development of a CAT for organizational climate, in addition to the psychometric and measurement advantages involved, examines the construct of organizational climate in detail, confirming the hypothesis of a general factor of organizational climate that reflects an essentially unidimensional underlying structure, which has facilitated the construction of a CAT.
The bank of 150 items that we developed showed a high internal consistency of the items as well as a moderate unidimensionality and it behaved optimally when used in the adaptive computerized version. In this bank, the correlation between the theta estimated (latent trait) by the CAT and the total score in the 150 items that comprise the bank was 0.89. A second phase of item screening, to 130 items, enabled us to increase the unidimensionality up to 24.2% of the total variance explained by the first factor, removing 20 items with poor fit to the model. This advantage in the unidimensionality of the 130 item test, compared with the data from the other item banks, does not seem to compensate for the loss of information which occurs when these 20 items are removed from the initial bank. Neither does the efficiency of the CAT with this bank appear to improve significantly from the 150 item bank, as can be examined with the information function. The bank of 50 items, with 37 common items to the original CLIOR scale, is clearly unidimensional and it substantially improves the internal structure of the initial bank going from 34.3% of the variance explained by the first factor to 40.1% for the bank constructed using the IRT procedures. As for the validity of the CAT, this 50-item bank does not exceed the correlations found between the estimated theta score of the trait with the bank of 150 items and the total score with the CLIOR scale. However, when considering the correlations between the theta score obtained with the CAT and the total score in the bank, these exceed the scores of the 150 item bank by 0.3.
With regards to the efficiency of the CAT, this adaptive test in conjunction with the bank of 150 items works reasonably well in requiring an average of 22.5 items (±13.5) to achieve a reliable estimate of the latent trait, with the stopping criteria established at SE<0.32. Therefore, an economy of approximately 56% is achieved in administering items with this computerized adaptive procedure compared with the traditional test, while maintaining a correlation of .94. The economy of the measuring instrument is evidenced when using the bank 50 items, as it requires only an average of 14 items (±5) to obtain a reliable estimate of the trait with a SE< 0.32. If the SE= 0.5, the average number of necessary items is only 7 (±4). With the adaptive computerized test, an economy of 70% is obtained when estimating the latent trait compared to the traditional pen-and-paper method.
From the point of view of the information provided by the different item banks studied, it is important to highlight the gradual loss of information which occurs in the banks as the number of items decreases. This can be seen more clearly in the case of the bank of 50 items, which loses information especially at the extreme values. The high Pearson correlation found between the CLIOR scale adaptively administered until the bank is exhausted compared with the same scale conventionally administered using pen and paper, enables the two instruments to be compared isometrically. Although in this case the adaptive test did not provide any advantages regarding a reduction in the number of items presented, as the same 50 items were administered to each of the 500 participants in the study sample, this high correlation found allows us to justify empirically the validity of the subsequent contrasts that were performed in this study.
After empirically testing this isometric equivalence between the adaptive administration of the items of the CLIOR scale and the traditional administration with pen-and-paper (r=.98 and ICC=.93), it can be concluded that of the different item banks examined, the one that performs better in the estimation of the trait under study is the 50 item one obtained by IRT-based methods. More specifically, the adaptive version achieved the screening of the original CLIOR scale, increasing its unidimensionality and thus its reliability and evidence of validity. Moreover, the results seem to support the suitability of this adaptive procedure in significantly reducing the number of items needed for accurate estimation of the latent trait. The adaptive administration with the most rigorous procedure (SE <0.32) reduces the test items to an average of 14 compared to the 50 items required by the traditional pen-and-paper test. If the stopping criterion of the CAT is reduced to SE= 0.5, an average of 7 items are sufficient to achieve an accurate estimate of the trait, especially at the central values. Although the bank of 150 items presents indicators of unidimensionality that are inferior to those of the 50 item bank, it does however enable us to more fully explore the construct of organizational climate with minimum guarantees of reliability, especially in the extreme values of the trait. Finally, the large variety of items calibrated in this bank will enable further estimates of the trait to be made in the future, avoiding the repetition and overexposure of the same items.
Although to date there are few studies on the administration of CAT in the organizational context, previous studies have found results that are similar to those presented in this paper. For example, Chien et al. (2011) have developed a Web-CAT based on the Job Content Questionnaire (JCQ-37), and have proven the CAT assessment to be more efficient than traditional computer-based or pen-and-paper assessments at collecting data regarding workers' perceptions of job content.
According to the results obtained, we have a CAT with good psychometric functioning, which is simple and fast and allows the assessment of organizational climate in contexts of both public and private organizations. The fact that the tests are short and are administered in a computerized context makes the CAT very appealing and can overcome the lack of interest shown by many participants when faced with excessively long and repetitive traditional tests. Moreover, a CAT on organizational climate would enable the administration of different successive tests, but on the same scale, measuring the same trait and adapted to different departments and/or different professional profiles. It would even be possible to have different tests that measure the same trait, which will assess the efficacy of interventions for promoting health at work and employee satisfaction. Finally, another line of work that remains open, going forward, is a detailed analysis of the facets that comprise the construct of organizational climate for each CAT, thus aiming to explore the possibilities that these adaptive tests offer us for extracting substantive information about the organizational factors that are involved in a diagnostic assessment of the organizational climate of work environments.
References
1. Aguado, D., Rubio, V.J., & Haley, S.M. (2005). Propiedades psicométricas de un test adaptativo informatizado para la medición del ajuste emocional (Psychometric properties of an emotional adjustment computerized adaptive test). Psicothema, 17, 484-491. [ Links ]
2. Allen, D.D., Ni, P., & Haley, S.M. (2008). Efficiency and sensitivity of multidimensional computerized adaptive testing of pediatric physical functioning. Disability and rehabilitation, 30, 479-484. [ Links ]
3. American Educational Research Association, American Psychological Association, and National Council on Measurement in Education (2014). Standards for educational and psychological testing. Washington, DC: American Psychological Association. [ Links ]
4. Andrich, D. (1978). A rating scale formulation for ordered response categories. Psychometrika, 43, 561-573. [ Links ]
5. Asif, F. (2011). Estimating the impact of Denison's (1996), What is the difference between organizational culture and organizational climate? A native's point of view on a decade of paradigm wars. Journal of Business Research, 64, 454-459. [ Links ]
6. Bartram, D., Robertson, I.T., & Callinan, M. (2002). A framework for examining organizational effectiveness. In I.T. Robertson, M. Callinan, & D. Bartram (Eds.), Organizational effectiveness: The role of psychology (pp. 1-10). Chichester, UK: Wiley and Sons. [ Links ]
7. Bjorner, J.B., Chang, C., Thissen, D., & Reeve, B. (2007). Developing tailored instruments: item banking and computerized adaptive assessment. Quality Life Research, 16, 95-108. [ Links ]
8. Carr, J.Z., Schmidt, A.M., Ford, J.K., & DeShon, R.P. (2003). Climate perceptions matter: A meta-analytic path analysis relating molar climate, cognitive and affective states, and individual level work outcomes. Journal of Applied Psychology, 88, 605-619. [ Links ]
9. Cella, D., Gershon, R., Lai, J.S., & Choi, S. (2007). The future of outcomes measurement: item banking, tailored short-forms, and computerized adaptive assessment. Quality Life Research, 16, 133-141. [ Links ]
10. Cheng, Y., Luh, W.M., & Guo, Y.L. (2003). Reliability and Validity of the Chinese Version of the Job Content Questionnaire (C-JCQ) in Taiwanese Workers International Journal of Behavioral Medicine, 10, 15-30. [ Links ]
11. Chien, T.W., Lai, W., Lu, Ch., Wang, W., Chen, S., Wang, H., & Su, S. (2011). Web-based computer adaptive assessment of individual perceptions of job satisfaction for hospital workplace employees. BMC Medical Research Methodology, 11, 1-8. [ Links ]
12. Chien, T.W., Wu, H.M., Wang, W.C., Castillo, R.V., & Chou, W. (2009). Reduction in patient burdens with graphical computerized adaptive testing on the ADL scale: tool development and simulation. Health and Quality of Life Outcomes, 5, 7-39. [ Links ]
13. Chien, T.W., Wang, W.C., Wang, H.Y., & Lin, H.J. (2009). Online assessment of patients' views on hospital performances using Rasch model's KIDMAP diagram. 9. BMC Health Services Research, 31, 135. [ Links ]
14. Cole, L.L., Grubb, P.L., Sauter, S.L., Swanson, N.G., & Lawless, P. (1997). Psychosocial correlates of harassment, threats and fear of violence in the workplace. Scandinavian Journal of Work, Environment & Health, 23, 450-457. [ Links ]
15. Corral, S., & Pereña, J. (2010). Cuestionario de clima laboral. Manual (Work Climate Questionnaire. Manual) (2a ed.). Madrid: TEA Ediciones. [ Links ]
16. Cummings, L.L., & deCotiis, T.A. (1973). Organizational correlates of perceived stress in a professional organization. Public Personnel Management, 2, 275-282. [ Links ]
17. deCotiis, T.A., & Summers, T.P. (1987). A path analysis of a model of the antecedents and consequences of organizational commitment. Human Relations, 40, 445-470. [ Links ]
18. Delgado-Rico, E., Carretero-Dios, H., & Ruch, W. (2012). Content validity evidences in test development: an applied perspective. International Journal of Clinical and Health Psychology, 12, 449-460. [ Links ]
19. Denison, D.R. (1996). What is the difference between organizational culture and organizational climate? A native's point of view on a decade of paradigm wars. The Academy of Management Review, 21, 619-654. [ Links ]
20. Downing, S.M., & Haladyna, T.M. (2006). Handbook of test development. Mahwah, NJ: Erlbaum. [ Links ]
21. Ekvall, G. (1996). Organizational climate for creativity and innovation. European Journal of Work and Organizational Psychology, 5, 105-123. [ Links ]
22. Fernández-Ballesteros., R., & Sierra, B (1984). Escalas de clima social: familia, trabajo, instituciones penitenciarias, centro escolar. Manual: investigación y publicaciones psicológicas (Social climate scales: Family, work, penitentiary institutions, school. Manual: Research and psychological publications). Madrid: TEA Ediciones. [ Links ]
23. Fonseca-Pedrero, E., Menéndez, F.L., Paino, M., Lemos-Giráldez, S., & Muñiz, J. (2013). Development of a Computerized Adaptive Test for Schizotypy Assessment. PLoS ONE 8(9), e73201. [ Links ]
24. González-Romá, V., Tomás, I., Peiró, J.M., Lloret, S., Espejo, B., Ferreres, D., & Hernández, A. (1996). Análisis de las propiedades psicométricas del cuestionario de clima organizacional FOCUS-93 (Analysis of the psychometric properties of the organizational climate questionnaire FOCUS-93). Revista de Psicología Social Aplicada, 6, 5-22. [ Links ]
25. Gibbons, R. D., Weiss, D. J., Kupfer, D. J., Frank, E., Fagiolini, A., Grochocinski, V. J., ... Immekus, J. C. (2008). Using computerized adaptive testing to reduce the burden of mental health assessment. Psychiatric Services, 59, 361-368. [ Links ]
26. Haladyna, T.M. (2004). Developing and validating multiple-choice test item (3 rd ed.). Hillsdale, NJ: Erlbaum. [ Links ]
27. Hambleton, R. K. (1989). Principles and Selected applications of item response theory. In R. L. Linn (Ed), Educational measurement (pp.147-200). New York, McMillan. [ Links ]
28. James, L.R., Choi, C.C., Ko, C.E., McNeil, P.K., Minton, M.K., Wright, M.A., & Kim, K. (2008). Organizational and psychological climate: A review of theory and research. European Journal of Work and Organizational Psychology, 17, 5-32. [ Links ]
29. Jarde, A., Losilla, J. M., & Vives, J. (2012). Suitability of three different tools for the assessment of methodological quality in ex post facto studies. International Journal of Clinical and Healh Psychology, 12, 97-108. [ Links ]
30. Jette, A.M., Haley, S.M., Ni, P., Olarsch, S., & Moed, R. (2008). Creating a Computer Adaptive Test Version of the Late-Life Function and Disability Instrument. The Journals of Gerontology, 63, 1246-1256. [ Links ]
31. Jones, A.P., & James, L.R. (1979). Psychological climate: Dimensions and relationships of individual and aggregated work environment perceptions. Organizational Behavior and Human Performance, 23, 201-250. [ Links ]
32. Kopec, J.A., Badil, M., McKenna , M., Lima, V.D., Sayre, E.C., & Dvorak, M. (2008). Computerized adaptive testing in back pain: validation of the CAT-5DQOL. Spine, 33, 1384-1390. [ Links ]
33. Lazarus, R.S. (1982). Thoughts on the relations between emotion and cognition. The American Psychologist, 37, 1019-1024. [ Links ]
34. Lazarus, R.S., & Folkman, S. (1984). Stress, appraisal, and coping. New York: Springer-Verlag. [ Links ]
35. López-Fernández, L.A., Sánchez-Cantilejo, E., Calzas-Urrutia, D., Siles-Román, D., Sevilla-García, E., & de Oleaga-Usategui, I. (1988). Elaboración de un cuestionario para el estudio del clima organizacional de los centros de salud (Elaboration of a questionnaire to study the organizational climate of health centers). Atención Primaria, 5(10), 531-535. [ Links ]
36. Lord, F. (1990). Applications of Item Response Theory to practical testing problems: Hillsdale, NJ: Erlbaum Associates. [ Links ]
37. Martin, M., Kosinski, M., Bjorner, J.B., Ware, J.E., Maclean, R., & Li, T. (2007). Item response theory methods can improve the measurement of physical function by combining the modified health assessment questionnaire and the SF-36 physical function scale. Quality Life Research, 16, 647-660. [ Links ]
38. Martínez-Arias, R. (1995). Psicometría: teoría de los tests psicológicos y educativos (Psychometrics: theory of psychological and educational tests). Madrid, Síntesis. [ Links ]
39. Moreno, R., Martínez, R., & Muñiz, J. (2006). New guidelines for developing multiple-choice items. Methodology, 2, 65-72. [ Links ]
40. Moreno, R., Martínez, R., & Muñiz, J. (2015). Guidelines based on validity criteria for the development of multiple choice items. Psicothema, 27, 388-394. [ Links ]
41. Muñiz, J., & Fonseca-Pedrero, E. (2008). Construcción de instrumentos de medida para la evaluación universitaria (Developing measurement instruments for university assessment). Revista de Investigación en Educación, 5, 13-25. [ Links ]
42. Muñiz, J., Peña-Suárez, E., de la Roca, Y., Fonseca-Pedrero, E., Cabal, A.L., García-Cueto, E. (2014). Organizational climate in Spanish Public Health Services: Administration and Services Staff. International Journal of Clinical and Health, Psychology, 14, 102-110. [ Links ]
43. Navarro-González, D., Lorenzo-Seva, U., & Vigil-Colet, A., (2016). How response bias affects the factorial structure of personality self-reports. Psicothema, 28, 465-470. [ Links ]
44. Ostroff, C. (1993). The effects of climate and personal influences on individual behavior and attitudes in organizations. Organizational Behavior and Human Decision Processes, 56, 56-90. [ Links ]
45. Ostroff, C., Kinicky, A., & Tamkins, M.M. (2003). Organizational culture and climate. In W.C. Borman, D.R. Ilgen, & R.J. Klimoski (Eds.), Handbook of psychology (Vol. 12 Industrial and Organizational). Hoboken, NJ: Wiley and Sons. [ Links ]
46. Pedrosa, J., Suárez, J., García-Cueto, E., & Muñiz, J. (2016). A computerized adaptive test for enterprising personality assessment in youth. Psicothema, 28, 471-478. [ Links ]
47. Peña-Suárez, E., Muñiz, J., Campillo-Álvarez, A., Fonseca-Pedrero, E., & García-Cueto, E. (2013). Assessing organizational climate: Psychometric properties of CLIOR scale. Psicothema, 24, 137-144. [ Links ]
48. Petersen, M.A., Groenvold, M., Aaronson, N., Fayers, P., Sprangers, M., & Bjorner, J.B. (2006). Multidimensional computerized adaptive testing of the EORTC QLQ-C30: basic developments and evaluations. Quality Life Research, 15, 315-329. [ Links ]
49. Rasch, G. (1960). Probabilistic Models for Some Intelligence and Attainment Tests. Copenhagen, Denmark. [ Links ]
50. Rebollo, P., Castejón, I. , Cuervo, J., Villa, G., García-Cueto, E., Díaz-Cuervo, E., ... Alonso, J. (2010). Validation of a computer-adaptive test to evaluate generic health-related quality of life. Health and Quality of Life Outcomes, 8, 147. [ Links ]
51. Reckase, M. D. (1979). Unifactor latent trait models applied to multifactor tests: Results and implications. Journal of Educational Statistics, 4, 207-230. [ Links ]
52. Revicki, D.A., & Cella, D.F. (1997). Health status assessment for the twenty-first century: item response theory, item banking and computer adaptive testing. Quality Life Research, 6, 595-600. [ Links ]
53. Rojas-Tejada, A. J., & Pérez-Meléndez, G. (2001). Nuevos modelos para la medición de actitudes. (New models for measuring attitudes). Valencia: Promolibro. [ Links ]
54. Samejima, F. (1969). Estimation of ability using a response pattern of graded scores. Psychometrika Monograph 17. [ Links ]
55. Samejima, F. (1974). Normal ogive model for the continuous response level in the multidimensional latent space. Psychometrika, 39, 111-121. [ Links ]
56. Smits, N., Cuijpers, P., & van Straten, A. (2011). Applying computerized adaptive testing to the CES-D scale: A simulation study. Psychiatry Research, 188, 147-155. [ Links ]
57. Schnake, M.E. (1983). An empirical assessment of the effects of affective response in the measurement of organizational climate. Personnel Psychology, 36, 791-807. [ Links ]
58. Steel, R.P., Shane, G.S., & Kennedy, K.A. (1990). Effects of social system factors on absenteeism, turnover, and job performance. Journal of Business and Psychology, 4, 423-430. [ Links ]
59. Thissen, D. (1991). MULTILOG, multiple categorical item analysis and test scoring using Item Response Theory (Computer program). Chicago, Scientific Software Inc. [ Links ]
60. Thumin, F.J., & Thumin, L.J. (2011). The measurement and interpretation of organizational climate. The Journal of Psychology, 145, 93-109. [ Links ]
61. Van der Linden, W. J. and C. A. W. Glas, Eds. (2001). Computerized Adaptive Testing: Theory and Practice. Dordrecht, The Netherlands: Kluwer Academic Publishers. [ Links ]
62. Vartia, M. (2008). The sources of bullying: Psychological work environment and organizational climate. European Journal of Work and Organizational Psychology, 5, 203-214. [ Links ]
63. Wainer, H.W., Dorans, N.J., Flaugher, R., Green, B.F., Mislevy, R.J., Steinberg, L., & Thissen, D. (1990). Computerized adaptive testing: A primer. Computerized adaptive testing: A primer. Hillsdale, NJ: Erlbaum. [ Links ]
64. Walter, O.B., Becker, J., Bjorner, J.B., Fliege, H., Klapp, B.F., & Rose, M. (2007). Development and evaluation of a computer adaptive test for 'Anxiety' (Anxiety-CAT). Quality Life Research, 16(Suppl 1), 143-155. [ Links ]
65. Walter, O. B. (2010). Adaptive Tests for measuring Anxiety and Depression. In W. J. van der Linden and A. W. G. Cees (Ed), Elements of Adaptive Testing, Statistics for Social and Behavioral Sciences (pp.123-136). New York Dordrecht Heidelberg London, Springer. [ Links ]
![]() Correspondence:
Correspondence:
Eduardo Fonseca-Pedrero.
Department of Educational Sciences.
University of La Rioja.
C/ Luis de Ulloa, s/n, Edificio VIVES.
26002, Logroño, La Rioja (Spain).
E-mail: eduardo.fonseca@unirioia.es
Article received: 29-04-2015
revised: 31-08-2015
accepted: 01-10-2015

