


 Servicios personalizados
 Inglés (pdf)
 Articulo en XML
 Referencias del artículo
 Enviar articulo por email
 Citado por SciELO
  Citado por Google
  Similares en
SciELO
Similares en
SciELO  Similares en Google
 Permalink
Introduction
Research production has exponentially grown along the last decades in most scientific fields. As a consequence, the tasks of synthesis and revision are increasingly important in order to figure out the state of the art in a specific phenomenon. In this context, meta-analysis has emerged as a methodology that allows researchers to quantitatively integrate the results from a set of primary studies on the same topic. Since Glass (1976) coined the term meta-analysis to refer to this research methodology, meta-analyses have been gaining popularity in many different research areas such as psychology, education, and health care.
Nowadays, most conclusions about cumulative knowledge in psychology are based on meta-analyses. The evidence-based psychology approach emphasizes the importance of scientific evidence to inform psychological practice. This approach aims to modify the way psychologists work so that professionals take into consideration the best scientific evidence to make their decisions (Sánchez-Meca & Botella, 2010). For example, an important decision for a psychologist can be which treatment is the most effective to prevent the obsessive-compulsive disorder (OCD) in children and adolescents, as well as moderators that can affect the effectiveness.
Meta-analysis is an essential methodology to synthesize the scientific evidence available on a given research question at a given moment. Meta-analyses must be carried out with the same scientific rigor as demanded for primary studies, that is to say, objectivity, systematization and replicability. Reporting quality of meta-analyses is not always optimal. Similar to primary research, poor reporting quality is a concern present in the meta-analytic research. Several systematic reviews of published meta-analyses have found a high heterogeneity among reporting patterns (e.g., Cafri, Kromrey, & Brannick, 2010; Rubio-Aparicio, Marín-Martínez, Sánchez-Meca, & López-López, 2017; Schmidt, Oh, & Hayes, 2009; Valentine, Cooper, Patall, Tyson, & Robinson, 2010).
It is important to make a distinction between methodological quality and reporting quality of a meta-analysis. Methodological quality refers to all aspects that must be taken into account to warrant the internal validity of a meta-analysis, with the purpose of avoiding biases in its results. Reporting quality consists of including all the steps and decisions taken when conducting a meta-analysis, with the aim of assuring its reproducibility by other researchers. Thus, a meta-analysis methodologically sound not necessarily can be well-reported; and a meta-analysis well-reported can exhibit methodological flaws. In this article, we present guidelines aimed to warrant a good reporting.
Several guidelines have been developed with the aim of helping researchers to improve both the reporting and the undertaking of systematic reviews and meta-analyses. Of all of them, the most popular is the PRISMA statement (Preferred Reporting Items for Systematic reviews and Meta-Analyses) for systematic reviews and meta-analyses of effectiveness of health care interventions. This guideline was developed by Moher, Liberati, Tetzlaff, and Altman (2009) as an update of the QUOROM Statement developed by Moher et al. (1999). The PRISMA is composed of 27 items about reporting a meta-analysis classified in title, abstract, introduction, methodology, results, discussion and sources of funding. Furthermore, the PRISMA guideline has been extended to systematic reviews and meta-analyses which incorporate current methods widely applied in the last years, namely, network meta-analyses (Hutton et al., 2015) and meta-analyses of individual participant data (Stewart et al., 2015). For more details, see the PRISMA website (http://www.prisma-statement.org/).
Another tool developed in the field of health is the AMSTAR guideline (Assessment of Multiple SysTemAtic Reviews; Shea et al., 2007). The AMSTAR guideline consists of 11 items focused on assessing the methodological quality, rather than the reporting of a meta-analysis. There is some evidence that use of PRISMA and/or AMSTAR guidelines has increased the reporting quality of systematic reviews and meta-analyses in health sciences (e.g., Panic, Leoncini, de Belvis, Ricciardi, & Boccia, 2013).
The PRISMA and AMSTAR instruments are specially designed for their application in meta-analyses on effectiveness of interventions. Given that meta-analyses from observational studies are also being carried out, Stroup et al. (2000) proposed the MOOSE guideline (Meta-analysis Of Observational Studies in Epidemiology) as a tool for reviewers, editors and readers of observational studies. MOOSE is composed of 35 items about quality of report, distributed in: title, abstract, introduction, method, results and discussion.
In the field of psychology, the Meta-Analysis Reporting Standard (MARS) was established for the conduct and reporting of meta-analyses focused on the efficacy of psychological treatments (APA Publications & Communications Board Working Group on Journal Article Reporting Standards, 2008). The development of this guideline was led by Harris Cooper and it was based on QUOROM, PRISMA, and MOOSE guidelines, as well as inputs from a meeting held in Potsdam (Germany) focused on meta-analysis (Cook, Sackett, & Spitzer, 1995). The MARS guideline is composed of 74 items grouped into title, abstract, introduction, method, results and discussion.
Finally, Sánchez-Meca et al. (2017, July) have recently proposed the REGEMA (REliability GEneralization Meta-Analysis) statement as an effort to offer a series of guidelines to researchers interested in publishing a special kind of meta-analysis called ‘reliability generalization’ (RG). An RG meta-analysis aims to statistically integrate the reliability coefficients reported across studies that have applied a given measurement instrument (psychological, psychosocial, educational, etc.), in order to obtain an estimate of its average reliability, assess the heterogeneity exhibited by the reliability estimates across applications and search for study characteristics that can explain the variability observed among the reliability estimates (Sánchez-Meca, López-López, & López-Pina, 2013). REGEMA is composed of 29 items that can be used to report or to critically appraise an RG meta-analysis.
The main purpose of this work was to provide some recommendations for the appropriate reporting of meta-analyses in light of the guidelines already proposed in the literature (PRISMA, AMSTAR, MOOSE, Botella & Gambara, 2006). We propose a tentative structure that all well-reported meta-analysis should follow according to the scientific quality and transparency required in research. PRISMA, AMSTAR, MOOSE, MARS and REGEMA are guidelines proposed for specific kinds of meta-analyses. Here, we present general-purpose guidelines which can be applied regardless of the objective of a meta-analysis. Therefore, our guidelines intend to be a complementary tool to those already proposed. In the next section, we explain in detail the structure of a meta-analysis. Furthermore, a recent meta-analysis on the effectiveness of psychological treatments is used to illustrate several guidelines. Last, we provide some concluding remarks.
Writing a meta-analysis
A meta-analysis is a scientific investigation and, consequently, it involves carrying out the same outline as in a primary study. However, a few specificities need to be mentioned. Basically, the reporting of a meta-analysis can be divided into five major sections: (1) Introduction, (2) method, (3) results, (4) discussion, and (5) references.
Before beginning to explain each section it is important to take into account some recommendations on the choice of the tittle and on the composition of the abstract when reporting a meta-analysis. The title should include the term “meta-analysis” to improve indexing and identification of the work. For example, in a meta-analysis about the efficacy of cognitive behaviour treatment on children and adolescents with OCD (Iniesta-Sepúlveda, Rosa-Alcázar, Sánchez-Meca, Parada-Navas, & Rosa-Álcazar, 2017), the title was “Cognitive-behavioral high parental involvement treatments for pediatric OCD: A meta-analysis”. On the other hand, the abstract must summarize, in a structured way, the main objectives, the eligibility criteria of the studies, the main results and the conclusions.
Introduction
In this section, the research question needs to be clearly and objectively defined. This involves specifying the constructs whose relationships are intended to be studied, as well as all variables implied in these relationships, including not only dependent and independent variables, but also some potential moderator variables. In addition, theoretical models and some key previous studies carried out about the question of interest should be described, emphasizing the points of discrepancy in the literature. Last, the purpose of the meta-analysis must be stated, specifying the objectives and hypothesis, if applicable.
For example, in the meta-analysis on OCD (Iniesta-Sepúlveda et al., 2017) constructs such as obsessive-compulsive disorder, cognitive-behavioural family treatment and the measurement tools to assess efficacy were defined, previous research was described, and the purpose of the meta-analysis was stated.
Method
The Method section should include the following subsections: study selection criteria, search strategy, coding of moderator variables, effect size calculation, and statistical analyses. Next, a brief description of the information to be included in each of these subsections is presented.
Study selection criteria
The selection criteria that the primary studies must fulfil to be included in the meta-analysis are listed here. Although selection criteria will depend on the question addressed in the meta-analysis, there are several criteria that should be present in any meta-analysis such as characteristics of the samples of participants, range of years considered, design type in the primary studies, language restrictions, and a minimum sample size.
In meta-analyses on the effectiveness of different treatments, the PICOS approach allows clearly identifying the five main components that must be taken into account when defining the selection criteria of the studies: Participants (target population/s to which the sample/s of participants must pertain), Interventions (treatment/s, intervention/s, program/s to be examined in the meta-analysis), Comparisons (type of control group/s that will be accepted in the studies -active vs. non-active control groups), Outcomes (dependent variables that must be reported in the studies), and Study design (types of design accepted: experimental, quasi-experimental, single-group designs) (Liberati et al., 2009).
For example, in the Iniesta-Sepúlveda et al.’s (2017) meta-analysis on OCD, studies had to fulfil several criteria: (a) to examine the efficacy of CBTs for OCD in participants younger than 19 years old, and diagnosed by standardized criteria (e.g. any version of the Diagnostic and Statistical Manual, DSM, or International Classification of Diseases, ICD); (b) to examine interventions with a high level of parental involvement (treatment programs which included parent-focused techniques and in which parents were involved in at least 70% of sessions); (c) to include at least one treatment group with pretest and posttest measures and, optionally, follow-up measures; (d) the sample size in the posttest should be greater than four participants; therefore, single-case designs were excluded; (e) the study was required to include the CY-BOCS as outcome measure; (f) effect size(s) reported, or at least enough information to calculate it/them, and (g) to be written in English or Spanish.
Search strategy
To search for the studies that fulfil the selection criteria, a combination of formal and informal searching strategies must be accomplished. Electronic bibliographic databases consulted (e.g., PsycINFO, MedLine, ERIC, Google Scholar, Web of Science, Scopus) must be reported, including the keywords used and how they were combined (perhaps as an appendix). To warrant the maximum comprehensiveness in this process, the formal search strategy is usually complemented by carrying out manual searches in specific journals and books for the topic of interest, by checking the references listed in the selected studies, and by contacting recognized researchers in the field. In this section the meta-analyst clearly state whether an attempt was made to locate unpublished studies.
The electronic databases consulted by Iniesta-Sepúlveda and colleagues (2017) were MedLine, PsycINFO, Psychology and Behavioral Sciences Collection (PBSC), and Consejo Superior de Investigaciones Científicas (CSIC), combining the following keywords in the title and the abstract: ((obsessive-compulsive) or (OCD)) and ((treatment) or (cognitive behavioral therapy) or (CBT) or (exposure response prevention) or (ERP)) and ((family) or (parents)). In addition, experts in this field were contacted with the purpose of locating unpublished studies.
Furthermore, it is recommendable to present a flow diagram that summarises the screening and selection process of the studies (see, for example, Figure 1). Alternatively, the results of the study selection process can be reported in the Results section.

Coding of moderator variables
The aim of this section is to describe the potential moderator variables extracted from the primary studies. To this end, a codebook and a protocol for registering the characteristics of the studies should have been produced, and they should both be made available to the scientific community in order to warrant the transparency and replicability of the coding process. The relevant information to be extracted from each primary study includes numerical variables that will be used in the main analyses (see next section), but also potential moderators of the association of interest. Although the list of potential moderators will vary from one meta-analysis to another, three broad categories of moderator variables can be distinguished: methodological, substantive, and extrinsic variables (Lipsey, 2009).
Substantive characteristics are those related to the research question of the meta-analysis, such as sociodemographic characteristics of the sample and treatment characteristics. Methodological variables refer to the designs and methods used in the studies. These include aspects related to the methodological quality (or risk of bias) of the studies. In the context of intervention studies some relevant variables are random versus non-random assignment of participants to the groups, attrition rates within each group and the blinding or not of participants and outcome assessors. The meta-analyst should always consider the potential influence of methodological quality on the results of the primary studies prior to undertaking any statistical integration, and describe in the report whether inclusion/exclusion of studies in all or some (e.g. sensitivity) analyses was decided on the basis of their methodological quality (Chacón-Moscoso, Sanduvete-Chaves, & Sánchez-Martín, 2016). Last, extrinsic variables are those characteristics that have nothing to do with the research enterprise so that, in principle, they should not be related at all with the study results. These include the publication status (published or unpublished), the educational background of the main author, the country where the study was conducted and the funding source.
In the Iniesta-Sepúlveda et al.’s (2017) meta-analysis, substantive characteristics coded included the behavioural techniques applied, treatment duration (number of weeks), inclusion or not of a follow-up program, mean age of the sample (in years), gender distribution (percentage of males), mean duration of the OCD (in years), and percentage of ethnic minorities. Methodological characteristics coded included the diagnostic criteria (any version of DSM, ICD or others), the attrition from pretest to posttest and control of pharmacological co-interventions.
In practice, the process of coding studies is often complex because the information reported in the primary studies may be incomplete or ambiguous. Therefore, the reliability of the coding process should be analysed. For that purpose, all or a random sample of the primary studies must be coded independently by two (or more) previously trained coders. The inter-rater reliability can be assessed using indices such as intra-class correlations and kappa coefficients for continuous and categorical moderators, respectively. When reporting a meta-analysis, the reliability of the coding process should be reported including, at least, the minimum and maximum values of the inter-rater agreement, as well as the average reliability.
Calculating an effect-size index
An essential issue in meta-analysis is to calculate one or more effect sizes that quantitatively summarize the results from each study. Depending on the study design and outcomes (e.g. continuous, dichotomous), different effect-size indices can be applied. The effect-size indices most frequently used in meta-analysis are grouped into: d family, r family, and risk indices.
With regards to d indices, one of the most common study designs in psychology and related areas involves a comparison of two groups on one or more continuous variables. In a two-group design (e.g., experimental vs. control), the effect size most usually applied is the standardized mean difference, which enables to homogenize results when different measurement instruments (e.g., different psychological tests) have been used and reported across studies. The standardized mean difference is defined as the difference between two means divided by a pooled within-group standard deviation (Hedges & Olkin, 1985; Rubio-Aparicio et al., 2017). It is important to note that the order of the groups in the numerator determines that most of the estimates are positive or negative sign of the effect sizes. It is advisable to order the means in such a way that they are mostly positive. This should be made explicit in the report, indicating something like: “…positive values indicate that the treated group has a better result than the control group”. This happens when the intervention is designed to increase the values (for example, in social skills), but should be in the opposite order when the expectation is to reduce the values (for example, in anxiety). In a repeated measures design, in which continuous pretest and posttest measures are taken for a single sample of participants (e.g., before and after the intervention, or before and at follow-up), the standardized mean change is a more appropriate effect size. For instance, Iniesta-Sepúlveda et al. (2017) used the standardized mean change as the effect size index, calculated as the difference between the pretest and posttest means divided by the pretest standard deviation. If the studies include experimental and control groups with pretest and posttest measures, a more appropriate index is the standardized mean change difference (see e.g., Morris, 2008; Rubio-Aparicio et al., 2017).
Regarding r indices, when the primary studies have applied a correlational design to analyse the degree of association among two variables, a correlation coefficient can be used as the effect-size index (e.g., the Pearson correlation coefficient, its Fisher´s Z transformation, the phi coefficient, the point-biserial correlation coefficient, etc.).
Last, risk indices are used to synthesize dichotomous outcomes. These include the risk difference, defined as the difference between the failure (or success) proportions for two groups; the risk ratio, defined as the ratio between two proportions (risks), and the odds ratio, defined as the ratio between the odds of the two groups (Sánchez-Meca, Marín-Martínez, & Chacón-Moscoso, 2003). The position of the proportions of the two groups in the formulas will determine the interpretation of this kind of effect sizes. Thus, when the event of interest is the failure, a negative risk difference between the proportions of the treatment and control groups will indicate a result in favour of the treatment; and the risk ratios and odds ratios will be lower than one. If the proportions of interest refer to success, then positive risk differences are expected, and the risk ratios and odds ratios will be larger than one.
Once the effect-size index most suitable to the characteristics of the studies has been selected, it is applied to each individual study. Formulae to compute sampling variances for the different indices can be found in the literature (e.g., Sánchez-Meca & Marín-Martínez, 2010; see Table 1). When reporting a meta-analysis, a clear description must be made of how the effect sizes were extracted/calculated from the primary studies and how to interpret them. In addition, as in the process of coding the characteristics of the studies, the computation of the effect sizes must be subjected to an analysis of inter-rater reliability and the results of this analysis should be reported (e.g., minimum, maximum, and average inter-rater reliability).
Statistical analysis
Once the data extraction process has been outlined, it is time to describe the statistical analyses. Essential aspects in this section are to specify the statistical framework (frequentist or Bayesian) and the meta-analytic model assumed in the analyses. To this respect, two main statistical models are typically considered: the fixed-effect and the random-effects models.
A meta-analyst that applies a fixed-effect model is assuming that all studies in the meta-analysis estimate a common population effect size, the only source of variability among the effect sizes being the sampling error due to the random selection of participants in each study (Konstantopoulos & Hedges, 2009). In the random-effects model it is assumed that each study in the meta-analysis estimates a different population effect size, and that studies are randomly selected from a population of studies. As a consequence, the random-effects model acknowledges two sources of variability: between-studies and within-study variability. Nowadays, there is broad consensus that the random-effects model is more realistic than the fixed-effect model in most situations, due to the methodological and substantive differences that are typically found among the studies combined in a meta-analysis (Borenstein, Hedges, Higgins, & Rothstein, 2010; Hedges & Vevea, 1998; Raudenbush, 1994, 2009).
The model choice will have an influence on the statistical procedures implemented for integrating the information and on the generalizability of the results (Hedges & Vevea, 1998). The meta-analyst must explain the reasons for assuming a fixed-effect or a random-effects model to analyse their data. For example, in the meta-analysis of Iniesta-Sepúlveda et al. (2017) random-effects models were assumed in order to accommodate the variability exhibited by the effect sizes. Regardless of the statistical model assumed, the individual effect sizes are weighted as a function of their precision. The meta-analyst must state the weighting schema in the analyses (e.g., weighting by the inverse variance, by sample size, or no weighting). When applicable, formulas for calculating the within-study variance of each effect size, the between-studies variance, or another weighting method may be reported in the paper (or be included as supplementary material).
Other relevant aspects to be reported at this stage are how an average effect size and a confidence interval was computed and whether a forest plot or other graphical display were used to present results. Furthermore, the meta-analyst must state how heterogeneity among effect sizes was assessed (e.g., with the Q statistic, the I 2 index, or other analytical strategies). This is an important point, as the Q test has poor statistical power to detect true heterogeneity among effect sizes when meta-analyses include a small number of studies (Sánchez-Meca & Marín-Martínez, 1997). Thus, it is advisable to complement the statistical conclusion of the Q test with the I 2 index (Higgins & Thompson, 2002), which quantifies the heterogeneity exhibited by effect sizes as a percentage (Huedo-Medina, Sánchez-Meca, Marín-Martínez, & Botella, 2006).
If substantial heterogeneity among the effect sizes is found in a meta-analysis (as is often the case), then the meta-analyst must describe how the search for moderator variables was accomplished. The statistical model assumed in these analyses should also be stated. A general recommendation when conducting such moderator analyses is to adopt a mixed-effects model, in which the effect sizes are taken as a random-effects variable, and study-level moderator variables - or individual-level moderators, should individual participant data be available - are taken as fixed-effects (Rubio-Aparicio, Sánchez-Meca, López-López, Marín-Martínez, & Botella, 2017). Other aspects to declare are whether meta-regression analyses for continuous variables and weighted ANOVAs for qualitative ones were conducted, and whether proportions of variance accounted for by the moderator variables were calculated (López-López, Marín-Martínez, Sánchez-Meca, Van den Noortgate, & Viechtbauer, 2014).
If applicable, additional analyses must be described, such as sensitivity analyses to detect outliers or to address statistical dependence among the effect sizes from the same sample or study. Dependency structures are ubiquitous in meta-analyses conducted in psychology and social sciences, and some strategies to deal with them are to include only one effect size per sample in each meta-analysis, to compute an arithmetic mean among dependent effect sizes, or to apply meta-analytic techniques accounting for dependency structures such as multivariate meta-analysis, three-level models and robust variance estimation approaches (López-López, Van den Noortgate, Tanner-Smith, Wilson, & Lipsey, 2017).
If the meta-analyst assessed whether publication bias might be a threat against the results, he/she must to describe which methods were applied (e.g., funnel plots with the trim-and-fill method to impute missing effects, fail-safe N, Egger test, Begg and Mazumbar rank correlation, etc.; cf. Rothstein, Sutton, & Borenstein, 2005).
A final feature to include in this section is the software used to carry out the statistical analyses. Some popular choices are the metafor package in R (Viechtbauer, 2010), Comprehensive Meta-Analysis 3.3 (Borenstein, Hedges, Higgins, & Rothstein, 2014), and RevMan 5.3 (Review Manager, 2014).
Results
The main results that any meta-analysis should include are: some descriptive characteristics of the individual studies and their effect sizes, the average effect size estimate and its confidence interval, the assessment of heterogeneity, the appraisal of the possible existence of publication bias, and the analysis of moderator variables.
Distribution of effect sizes, average effect size and heterogeneity
As a first step, it is advisable to present the database with the effect sizes and characteristics for each individual study included in the meta-analysis as an appendix or supplementary file. In general, this database will have as many rows as studies included in the meta-analysis, and the different columns will be formed by the study identifier, some of the characteristics of the studies coded, and the estimates of the effect size and sample sizes. An example of this sort is Appendix A in the Iniesta-Sepúlveda et al.’s (2017) meta-analysis.
After the descriptive section, the mean effect size with its confidence interval and the heterogeneity measurements (e.g., the Q statistic and the I 2 index) must be presented. If several outcome measures and/or groups (e.g., treatment group and control group) have been taken into account, it is really important to present these results separately. Furthermore, the distribution of the effect sizes can be illustrated using graphical techniques. An example of a forest plot, one of the most commonly used graphical displays in meta-analysis, is provided in Figure 2. However, if the number of effect sizes is very large, histograms or steam and leaf displays can be more useful graphs to show the effects sizes and their distribution simultaneously.

Figure 2 Forest plot of the effect sizes for obsessive-compulsive symptoms grouped as a function of the type of intervention (treatment vs. control group) extracted from Iniesta-Sepúlveda et al. (2017).
Analysis of moderator variables
If the individual effect sizes exhibited large heterogeneity, analyses of the characteristics of the studies that could affect such variability should be performed. The results of moderator analyses will be presented separately for categorical and continuous moderators.
For categorical moderators, results can be presented in an ANOVA format, providing the average effect size, confidence interval and heterogeneity measures for each category of the moderator, and possibly the multiple comparisons among the average effect sizes of some categories (while adjusting the inflation of the Type I error rate) for moderators with more than two categories. For continuous moderators, the regression coefficients, standard error and confidence limits may be provided. Furthermore, for both types of moderators, the statistical significance tests, misspecification tests, and proportion of variance accounted for should be reported. As an example, see Tables 2, 4 and 5 in the Iniesta-Sepúlveda et al.’s (2017) meta-analysis.
It is advisable to complement the individual analysis of the moderators (ANOVAs and meta-regressions) with multiple meta-regression models that include simultaneously the most relevant moderator variables (Rubin, 1992). The fitting of multiple meta-regression models allows assessing the influence of a moderator variable controlling for the effect of other important moderators. It is not always possible to fit a predictive model as a further step in a meta-analysis. For example, when the number of studies included in the meta-analysis is not large enough to achieve precise estimations, or when no moderator variable individually has reached statistical significance, the adjustment of a multiple meta-regression model will not add any valuable insights. In the Iniesta-Sepúlveda et al.’s (2017) example, Table 3 shows the results of two multiple meta-regression models.
Additional analyses
If applicable, in this section the results of any additional analyses must be reported. A meta-analysis should include additional statistical analyses related to the assessment of the publication bias, the estimation of the statistical power in moderator analyses (Cafri et al. 2010), and the sensitivity analyses comparing the results obtained with different meta-analytic procedures (e.g., one-by-one deleting to detect potential outliers) (Botella & Sánchez-Meca, 2015).
A highly recommended additional analysis is the assessment of publication bias. The meta-analyst should assess the extent to which publication bias could be a threat to the conclusions reached in the meta-analysis. Several techniques are available to assess the existence of publication bias: the fail-safe N index (Rothstein et al. 2005), the Egger test (Egger, Smith, Schneider, & Minder, 1997), the “trim-and-fill” method (Duval & Tweedie, 2000), and the funnel plot (Light & Pillemer, 1984). We recommend the combination of at least three of these procedures, namely the funnel plot, which may suggest the existence of publication bias when the distribution of effect sizes plotted against their standard errors is not symmetric; the Egger test, which provides a formal test of funnel plot asymmetry based on a simple regression model, and the “trim-and-fill” method, which enables to estimate the “missing” effect sizes that would make the funnel plot look symmetric and then re-estimate the overall effect size after adding them.
In our example, Iniesta-Sepúlveda and colleagues (2017) applied these three procedures. Figure 3 presents the funnel plot obtained with the d indices applying the “trim-and-fill” method. Despite the “trim-and-fill” method imputed three values to achieve a symmetric funnel plot, the difference between the original overall effect and the estimate obtained after incorporating those three values was negligible. Therefore, publication bias was discarded as a threat to the results of this meta-analysis.
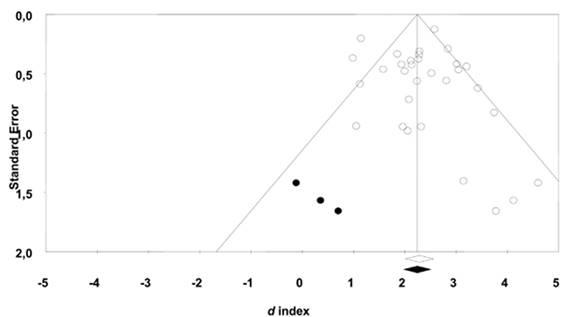
Figure 3 Funnel plot of the 31 d indices for the treatment groups (white circles) together with three imputed values (black circles) when applying Duval and Tweedie’s (2000) ‘trim-and-fill’ method. Extracted from Iniesta-Sepúlveda et al. (2017).
Discussion
In this section, the first statement that should appear is a summary of the main results found in the meta-analysis, such as the average effect size and the analyses of moderators. Next, such results should be discussed in the light of the previous evidence. In psychology and related areas, meta-analyses comparing the effectiveness of different treatments are very common. In this context, analyses of moderators provide valuable insights on the conditions under which each treatment is most effective. This is one of the most important advantage of this kind of research, as primary studies are typically limited in the amount of conditions they can examine. Regardless of the kind of meta-analysis, in the Discussion section the meta-analyst must conclude whether the objectives proposed were reached and, if appropriate, whether the meta-analytic results confirm or not the hypotheses previously formulated.
On the other hand, it is important to establish implications that the results could have for psychological practice. In our example, the authors provide clear and explicit guidelines and recommendations for applied professionals regarding the effectiveness of cognitive-behaviour-family treatment (CBFT) on pediatric OCD in different settings.
As in any empirical study, a meta-analysis is not without limitations. Therefore, it is important to discuss the limitations that could affect the scope and generalizability of the meta-analytic findings. Last, a meta-analysis must finish the Discussion section offering some recommendations for future research in the field.
References
If the references of the studies included in the meta-analysis have not been reported as an appendix or supplementary file, it is advisable to mark them (e.g., with an asterisk) in the References section.
Concluding remarks
Meta-analyses are gaining popularity in most scientific fields. Evidence-based practice is a good example of the broad scope of this methodology. The conclusions extracted from a meta-analysis allow researchers to synthesize the evidence about a specific topic. However, doing and reporting a meta-analysis is not an easy task. The purpose of this article was to offer some guidelines for reporting a meta-analysis. Meta-analyses are often challenging to undertake, as they might involve the application of complex statistical methods and/or require several important decisions from meta-analytic team. The impact of the conclusions from meta-analyses can be substantial, and hence the need for conducting and reporting them to a high standard. Transparency should be present when reporting decisions made during the process of a meta-analysis, as a way to achieve those standards. Furthermore, only a thorough description of all of the phases and decisions made in conducting a meta-analysis will enable other researchers to replicate it, as well as to make a critical appraisal of the results.

