


 Custom services
 English (pdf)
 Article in xml format
 Article references
 Send this article by e-mail
 Cited by SciELO
  Cited by Google
  Similars in
SciELO
Similars in
SciELO  Similars in Google
 Permalink
Introduction
Among the methods to quantify the validity of content, obtained through the participation of expert judges, the use of the coefficient V (Aiken, 1980, 1985), also known as V of Aiken, seems to have increased in psychological research or in fields that involve psychological constructs applied in various disciplines. The introduction of this method in Spanish language seems to be located in Escurra (1988), and later, Merino and Livia (2009) disseminated the asymmetric confidence interval (CI) approach, developed by Penfield and Giacobbi (2004). This method seems to fit very well the estimates of content validity by means of coefficients, since it is reasonable to find negative asymmetric distributions in validity judgments, especially when the instruments have rigorously sampled the content domain of the construct; in this situation, validity judgments will present denser distributions at the higher extremes of the rating. This procedure is an important advance to generate intervals in the level 100 (1 - α) % to conclude in the statistical and practical significance of the coefficient V.
In the current content validity reports that used the V coefficient (Domínguez & Villegas, 2012; Domínguez, Villegas, Yauri, Mattos, & Ramírez, 2012; Freiberg, de la Iglesia, Stover, & Fernández, 2014; Gómez, Sainz de Baranda, Ortega, Contreras & Olmedilla, 2014; García & García, 2013; García, Merino & Valero, 2015; Medrano, Liporace & Pérez, 2014; Merino & Valero, 2014; Palao, Manzanares & Ortega, 2015; Sánchez-Alcaraz & Parra-Meroño, 2013; Vallejo-Medina, Granados & Sierra, 2014), to date, the variability of expert judgment related to a fixed factor that differentiates two (or more) groups of experts has not been raised. The content validity estimated in the previous studies rests on the assumption that the results do not interact with differences between groups of experts; however, it is plausible to suppose the opposite if a rigorous analysis of the characteristics of the subjects that served as expert judges is made.
Indeed, the review of previous research suggests that the situation least raised in obtaining quantitative evidence of content validity is the comparison of groups of judges with respect to this type of evidence. This comparison occurs when there is the necessary justification to suppose that the evaluation of the content of the items is associated with the variations related to specific groups. For example, between men and women, between subjects with differentiated years of formal education (technical education vs. university education), between culturally or socioeconomically distinct groups (e.g., Peruvians and South Africans), or according to the degree of thematic or experiential expertise derived from different professional practices (eg, educational psychologists vs. forensic, or doctors and nurses). Therefore, the aim of the present manuscript is to propose a method and an SPSS syntax, for the comparison of quantitative evidences of content validity, by means of confidence intervals for the difference between coefficients V. To continue with this approach, the present work will only formulate the situation of comparing between two independent groups, since the most basic comparison between groups will be considered in the analyzes, and it will be the context of the presentation of the confidence interval method for the difference between coefficients V in two independent groups.
Confidence intervals for the difference between V coefficients
Aiken (1985) defined his coefficient V as a proportion, and used the binomial distribution to create a hypothesis test of the population value centered on .50. Subsequently, Penfield and Giacobbi (2004) derived asymmetric confidence intervals (CI) for V based on the score method (Wilson, 1927), a procedure that also serves to generate CI for other parameters (for example, dependent and independent proportions, Newcombe & Merino, 2006). To compare coefficients V from two independent groups of judges, the present manuscript adapts a procedure based on confidence intervals for the difference of two quantities, which represent indicators of effect size of the phenomenon evaluated. This approach was derived from the general method proposed by Zou and Donner (2008), to obtain intervals of difference for estimates of effect magnitude; these intervals are a modification of the traditional approach for the same purpose (Smithson, 2003). In this context, the coefficient V is conceptualized as a measure of the magnitude or intensity of judges' judgments regarding their validity qualifications (Merino, 2013), making it possible to quantify the degree to which the items adequately represent the content domain, or the clarity of it. This method is robust to the asymmetry of the sampling distribution between two parameters and does not require assuming any known distribution (Zou, 2007; Zou & Donner (2008). The implementation requires the sample estimates of the investigated parameter ( ), and its limits of the lower (i) and superior (s) intervals in the level 100 (1 - α)% previously obtained.
For its implementation in the present context,  ; therefore, parameter
  , is V1 - 2 for each item and calculated between the two groups of judges compared. With this information, the formulation of the confidence interval for the difference, according to the described method (Zou, 2007; Zou & Donner (2008) is calculated for the lower limit as
  ; and the upper limit as
 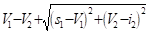 .
.
The method has also been adapted to compare parameters in various analysis contexts, such as the comparison of kappa agreement coefficients and intraclass correlation for dependent samples (Donner & Zou, 2002; Ramasundarahettige, Donner & Zou, 2009), product correlations of moments and R2 (Zou, 2007), means of normal distribution (Wang & Chow, 2002) and of lognormal distribution (Zou, Taleban & Huo, 2009a, 2009b), relative risk (Rotondi, 2014), and linear combinations of parameters (Newcombe, 2011), between others. This method is also called MOVER, Method Of Variance Estimates Recovery (Donner & Zou, 2002; Newcombe, 2012; Zou & Donner (2008).
Computer program
To implement this method, a friendly syntax has been created in the corresponding window within the SPSS program. This platform was chosen because it can be considered as a software its high frequency of use among professionals and researchers at undergraduate and graduate levels. The user must enter the information corresponding to the V coefficients and their CI 100 (1 - α) % obtained in each group, or the quantitative inputs to calculate it according to Merino & Livia (2009). The syntax is freely available and can be requested from the author's contact address.
Example
Recently (Merino-Soto, 2016), the clarity of the items of the Eysenck Personality Questionnaire, revised version (EPQR, Eysenck & Eysenck, 2001), was evaluated within a framework of research of content validity. In accordance with the traditional strategy, a group of judges was asked to assess the clarity of the items, but the participation of the examinees was also introduced. In this way, there were two groups: university students (n = 36) and psychology teachers (n = 7); the latter had professional and teaching experience in the teaching of psychological tests. The final objective was to reveal the plausible differences between both groups of judges, and the valuation of the subjects as legitimate evaluators of the clarity of the content of the items. The coefficient V and its asymmetric confidence intervals were applied. However, no direct quantitative comparisons were made between the coefficients V of each item of both groups. Applying the procedure presented in this manuscript, to the results exposed for the Extraversion subscale, the confidence interval for the difference for each item (95% confidence level) is shown in Table 1. The only difference that can be considered statistically significant occurred for item 69, indicating that students perceive the item more clearly compared to expert judges. The researcher should consider this discrepancy as post hoc information to evaluate it in the context of the study.

Final comments
The method depends on the validity of the calculated CIs for the coefficients V obtained in each group. Fortunately, an appropriate method has been proposed for small samples and insensitive to asymmetric distributions, such as those usually found in content validity judgments (Merino, 2013, Penfield & Giacobbi, 2004). This method has been implemented in a Visual Basic program (Merino & Livia (2009).
The identification of comparison groups can follow two strategies: an a priori and a posteriori. In the a priori way, the researcher must directly support the possible discrepancy between groups regarding the judgment of validity of each one, and this framework may correspond to an exploratory direction (in which there is no previous evidence or rationality is not considered to evaluate the difference between groups) or confirmatory. In both situations, the objective of the research can be directly proposed as the evaluation of the differences in the content validity, quantified by the confidence interval for differences in coefficients V. On the other hand, in a posteriori form, the researcher evaluates the existence of possible discrepancies between groups after obtaining the coefficients V and their CIs. In any situation, it is suggested to choose the same confidence level to calculate the intervals in each group.
Finally, it is useful to observe the empirical distribution of each item evaluated by the judges, to detect bimodal distributions, heterogeneous dispersion of items between different groups or judges with extreme ratings (outlier), and quantify the consensus among the judges. Consensus or agreement among judges is a prerequisite because the coefficient V uses the mean in its definition, and the mean is interpretable when the dispersion of the data is not large and the consensus is reasonably concentrated. The user must calculate some appropriate statistic for it; however a simple and "crude" approach is to compare the observed range (maximum grade obtained - minimum grade obtained) against the theoretical range (maximum score possible - minimum possible rating); values close to 1 indicate maximum variation of the judges' qualifications.

