


 Custom services
 text in
  English (pdf)
 Article in xml format
 Article references
 Send this article by e-mail
 Cited by SciELO
  Cited by Google
  Similars in
SciELO
Similars in
SciELO  Similars in Google
 Permalink
Introduction
Children's fictional programming (cartoons, series, films) bear great potential as tools to influence how systems that represent boys and girls are built, appealing to different attention modalities. They can take on educational value in socialisation of minors, since they contribute, to a greater or lesser extent, to the development of narrative skills and of values/countervalues.
A study by Bermejo (2005) on two cartoon contents that were structurally different, Dragon Ball (non-narrative structure) and David el Gnomo (narrative structure), and their relationship to Primary Education students' attention and narrative skill, defends that the non-narrative structure influences the processing and compressing of narrations in minors, such that when asked what the episode was about, instead of organising the stories hierarchically (stating beginning, climax and resolution), they generically stated that it was "about fights." However, the narrative structure's content encourages comprehension, and helps to train voluntary attention by following the narration itself, progressively increasing attention intensity in relation to the path the story follows while being viewed.
According to Aierbe & Oregui (2016), structural characteristics (non-narrative or narrative) and content characteristics (greater or lesser number and type of values/countervalues and emotions shown) in children's fiction programmes like cartoons can facilitate or prevent minors from delving into the message and discerning the consequences and motives behind the characters' thoughts, emotions and actions. To this end, when analysing the media competency of boys and girls, a structural and content analysis of fictional programmes preferred by children takes on special relevance. This should be complemented with reception studies, meaning not only considering the potential values/countervalues that they communicate, but also those that students perceive in said media content when retelling the story.
There is no doubt that narrations have special educational relevance for younger generations, given that boys and girls use them to attempt to give meaning to their experiences (Hymes, 1982).
A frequent technique to analyse comprehension of messages is retelling, which consists of asking the participant to share an incident or real event they experienced, or to repeat the story in a narration provided with printed material, images, audio or audio-visual content, such as an episode of a cartoon or television series (Benaissa, 2014; Flake, Lorch & Milich, 2007).
Different studies analyse if the way stories are shown, orally or with visual support, influences the extension and quality of the stories told by students, and they conclude that they are more complete with visual support (Schneider, 1996; Schneider & Dubé, 2005), even in medium and low socioeconomic contexts (McConnell, 2011). Klop et al. (2013), for example, determined that sharing the viewing space with examiners does not affect the quality of the stories told by students, with and without speech disorders, in terms of micro and macrostructural variables. The microstructural variables measured were productivity (total number of words and units), syntactic complexity (average length of the unit) and lexical diversity (total number of different words). Macrostructural variables included cohesion measurements (number of complete links, incomplete links and erroneous links) and story structure.
Ukrainetz et al. (2005), from an evolutionary perspective, compared fictitious stories created by three age groups (5-6, 7-9 and 10-12 ages), and discovered that narrative skill increased with age. Longobardi, Spataro, Renna & Rossi-Arnaud (2014) concluded that narrative skill is more developed in 4th and 5th year than in 3rd year of Primary Education, and are of the opinion that at these ages, it is preferable to use fictitious narrations, given that the student demonstrates less capacity to write personal narrations in comparison with fictitious and hypothetical narrations. These more current works of research confirm what certain classic studies defend, such as Berman (1996), McCabe & Peterson (1991), Slobin (1996), Stein & Glenn (1979) and Trabasso, Secco & van den Broek (1984), in addition to others.
Regarding research into the values and countervalues communicated by children's media programmes, there are several studies that analyse, through content analysis, the potential values/countervalues represented therein. Thus, Alonso (2016), within the context of Spain, delves into the values communicated in cartoons, both through content and aesthetic, in order to discover the quality of children's television. In total, Alonso examines over 600 characters and 163 series of different nationalities, concluding that, currently, violence and lack of gender equality are highly represented. On the other hand, Fabbro & Sánchez-Labella (2016) analyse content in values and countervalues of children's programmes shown on public television in Argentina and Spain, and find that values predominate therein.
Some works indicate the prominent role of television in forming positive attitudes toward cultural and ethnic groups, and to inculcate an adequate perception of social reality, as well as a tolerant and multicultural awareness, such as Gladkova (2013), for example, who emphasises the development of values of pluralism and cultural diversity in minors. Additionally, Özer & Avci (2015) study two cartoons in depth, a Turkish one called Pepee and a Canadian one, Caillou, in order to research how their cultural values are presented. Other studies, such as by Russo, Crescentini, Castelli, Missaglia & Jabes (2007) focus on shaping values and social representations related to childhood abandonment. Tamborini, Hahn, Prabhu, Klebig & Grall (2017) determine the frequency with which behaviours are driven by altruistic/selfish motivations, executed by pleasant/unpleasant characters, rewarded/punished or present in content geared toward different age groups (2-5, 6-11 and 12-17 ages). They found that the behaviours represented highlighted skills, autonomy and relations in older age groups.
There are fewer studies on the reception of values/countervalues by minors, such as Fogel (2006), who examined the television habits of pre-adolescents (8 to 12 ages) in southern California to verify if parental mediation foments the perception of pro-social values upon watching an episode of the series Hang Time. Students reported that they prefer cartoons (81%) over other programmes, and found that scoring in the perception of tolerance and friendship increased in the experimental group. Šramová & Pavelka (2017) studied the perception of Czech preschool children of media messages. They attempted to determine the effect of advertising on purchase processes through semi-structured interviews with parents and children. This is one of the few reception studies that alludes to perception of countervalues. In a study conducted in Taiwan, Hadley & Nenga (2004) indicate that children are not merely passive recipients of the media messages, but that they rather actively interpret them in terms of values and countervalues, and incorporate them into their own play with peers. Along the same lines, Abuzahra, Farrah & Zalloum (2016) highlight, from a constructivist perspective, the pedagogical value of children's fiction, given that it acts as an incentive to improve student participation and collaborative discussion. Labaš & Maleš (2017) study the perception of ethical values in messages issued by electronic media on the part of Croatian adolescents, and their relation to sociodemographic factors, such as the parents' educational level, the family's economic situation and the student's gender. They find differences regarding the student's gender and the parents' education level, given that female students show greater sensitivity to ethical issues, and male students whose parents have a lower level of education perceive a lesser number of ethical values.
A quasi-experimental research work, conducted over several phases, considering the type of structure of the cartoons in relation to the narrative skills and perception of values/countervalues by Primary Education students (Aierbe & Oregui, 2016; Bermejo, Aierbe, Oregui & Bartau, 2018; Oregui, 2017) revealed interesting results. The initial phase, analysis of value/countervalue content, from Rokeach's (1973) framework, showed that the 86 episodes of Code Lyoko (non-narrative structure) and Doraemon (narrative structure) provided a wide range of ethical and skill values, especially life values, while aesthetic and transcendental values are scarcely represented (Aierbe & Oregui, 2016). Code Lyoko has a greater variety of values/countervalues. However, Doraemon is more pedagogical in nature, given that it shows values with their respective countervalues in repeated fashion. Along with its formal characteristics, this facilitates comprehension of the messages. In the consecutive reception analysis phase, they found that the narrative skill index obtained by students is greater in the narrative structure, as opposed to the non-narrative structure. The stories produced by students referring to Doraemon are more extensive and detailed, while those referring to Code Lyoko are almost exclusively focused on explaining action sequences (which are also the most violent). The purpose, the motives and the consequences of the actions are not specified (Bermejo et al., 2018). In concordance with the content analysis conducted in the initial phase, students identify the different values/countervalues present in the episodes, and although they tend to perceive more values than countervalues, they find a greater number of values/countervalues in the narrative structure than in the non-narrative (Oregui, 2017). Additionally, as they grow older, they remember sequences better, make fewer errors and tend to perceive a greater number of values/countervalues. Although no statistically significant differences were found as far as attention is concerned, they did find some differences in regard to gender, given that female students use a greater number of causal connectors when retelling episodes, and identify more socio-emotional values/countervalues than male students.
In conclusion, the majority of studies that delve in depth into narrative skill or perception of values/countervalues during childhood are mainly based on analysis of content and, to a lesser extent, analysis of reception or a conjoint analysis of content and reception, as in the latter body of research mentioned. These works tend to use audio-visual contents, but do not tend to consider the structure, which may be determining, along with other factors, such as age, gender and attention level to give meaning to messages. Thus, the question begged is: Which of these factors have an influence, and how do they influence upon retelling an episode viewed in terms of students' narrative skill and identification of values/countervalues?
The following hypotheses are posed: a) the structure of the episode viewed is the factor with the greatest influence, and explains the most differences regarding narrative skill, such that if an episode with a narrative structure is viewed, it shall have a positive influence on the score, b) the structure of the episode viewed is the factor with the greatest influence, and explains the most differences regarding identification of values, such that if an episode with a narrative structure is viewed, it shall have a positive influence on the score, and c) the structure of the episode viewed is the factor with the greatest influence, and explains the most differences regarding identification of countervalues, such that if an episode with a narrative structure is viewed, it shall have a positive influence on the score.
The main purpose of the study is to analyse which personal variables (age, school year, gender, sustained attention and selective attention), contextual variables (public school or private-blended school and socioeconomic and cultural index) and variables related to media content (non-narrative and narrative structure) influence the narrative skill index and identification of values and countervalues by Primary Education students. The specific objectives: 1) To determine which factors influence, and how they do so, on the narrative skill index when retelling the episode viewed by students, 2) to analyse which factors influence, and how they do so, on the identification of values in the episode viewed by students, and 3) to discover which factors influence, and how they do so, on the identification of countervalues in the episode viewed by students.
Method
The research has a quasi-experimental design with blended methodology (quantitative and qualitative).
Participants
186 Primary Education students collaborated in the study, with ages ranging between 7 and 13 (M = 10.04; SD = 1.59), from four different schools in the province of Gipuzkoa (Autonomous Basque Community). The sampling was by convenience (not random or probabilistic) and an attempt was made to have an equal proportion of schools by network (two from the public network and another two from the private-blended network).
Of the total of students: 104 (55.91%) belong to the private-blended school network and 82 (44.09%) to the public; 113 (60.75%) are in sixth year of Primary Education and 73 (39.25%) in third; 94 (50.54%) are female and 92 (49.46%) male.
Instruments of measurement
Data were collected by applying the Escala Magallanes de Atención Visual (Magallanes Scale of Visual Attention) or EMAV (García & Magaz, 2011), viewing an episode with a non-narrative structure (http://goo.gl8Jyo49) or one with a narrative structure (http://goo.gl/7TSJhH), and conducting a semi-structured individual interview with the participating student.
Procedure
Firstly, the episodes were selected (Aierbe & Oregui, 2016). This selection was essentially based on two criteria: 1) having high audience share (or screen share above 11 points) with the ages targeted by the study (8-12 ages) and 2) belonging to different structure types (one non-narrative and the other narrative). Audience shares were requested from the agency Kantar Media (http://www.kantarmedia.com/es), and to establish the structure type each episode belonged to, we asked to experts in narratology. The selected episodes were: Fight to the Finish (episode from Code Lyoko) as the non-narrative structure, since it alters the space-time order and uses attention grabbers or clinchers (such as sounds or appearance/disappearance of characters); and La bombona de energía emocional (The Emotional Energy Tank an episode from Doraemon) as the narrative structure, since it is similar to the classic tale structure, with a beginning, climax and resolution.
Secondly, we obtained the informed consent of mothers and fathers of students from third and sixth year of Primary Education from the four schools who agreed to participate.
Data were collected in three consecutive phases:
In the first phase, the EMAV attention scale was applied (García & Magaz, 2011) to students to verify if selective attention (attention quality) and sustained attention influence the research's results.
In the second phase, students were sub-divided into two groups, in an attempt to keep an equal number of students by gender (between female and male students) and by school year (between third and sixth year of Primary Education). In one group, they viewed the episode with a non-narrative structure (a total of 89 students, 47.85% of the sample), and in the other group, the episode with a narrative structure (a total of 97 students, 52.15% of the sample).
In the third phase, a semi-structured individual interview was conducted, with an approximate duration of 20 minutes. The purpose was to gather the narrative skill index, and the students' ability to identify values and countervalues. This research presents the analyses and results from the first question: “Tell everything you remember from the episode you watched”, a technique known as retelling.
Data analysis
Student responses or retelling were analysed to obtain the index for their narrative skill, and the total number of values and countervalues they identified while viewing both episodes.
The narrative skill index includes the average of six components (Bermejo et al., 2018): 1) mention of sequences (11 sequences in total in each episode and each one rated with 0 points, if not mentioned, and with 1 point, if mentioned partially or totally), 2) mention of the introduction (sequence average 1 to 5 in the non-narrative episode and 1 in the narrative type), the conflict (sequence 6 in the non-narrative episode and average of 2 to 4 in the narrative one), the resolution (sequence average 7 to 9 in the non-narrative episode and 5 to 9 in the narrative one) and the conclusion (sequence average 10 and 11 for both kinds of episodes), 3) mention of semantic nuclei of the means-ends (11 semantic nuclei in total for each episode, each one rated with 0 points, if not mentioned, and with 1 point, if mentioned partially or totally), 4) use of segments or propositions (total number of segments counted), 5) use of causal connectors (total number of causal connectors counted) and 6) use of temporal connectors (total number of temporal connectors counted). The Cronbach Alpha from the reliability analysis is acceptable, with a coefficient of α = .77.
Identification of values or countervalues is calculated by the total sum of values and countervalues perceived while viewing the episodes. The values were categorised as: vital (e.g., playing), production (e.g., acquiring things), ethical (e.g., justice), socio-emotional (e.g., friendship), intellectual (e.g., desire to know or discover), aesthetic (e.g., beauty) and personal (e.g., self-esteem). The opposite of these means were categorised as countervalues (Aierbe & Oregui, 2016; Donoso, 1992; Oregui, 2017; Rokeach, 1973).
Categorisation was executed with the programme NVivo 10. After, with a query called coding matrix, we obtained the total number of values and countervalues categorised to export the data to an Excel file and import it into the SPSS 24 programme for statistical analysis.
NVivo also provides for a query called comparative encoding, to verify the percentage of inter-rater agreement and disagreement regarding the categorisation or modification made with one user name or another. The analysis shows concordance between both judges, with a Kappa index at k = .83.
Once the data matrix is prepared in SPSS, and we verify, by means of blended linear model analysis (multilevel or hierarchical regression), that there is no variance (p > .05 intersection) at the second level (school level and/or classroom level), we conducted the multiple linear regression analysis.
Three multiple linear regression analyses were conducted, one for each dependent variable: narrative skill index (M = 4.69; SD = 3.87), values identification (M = 7.77; SD = 6.76), and countervalues identification (M = 5.05; SD = 4.93). With these three models, predictive or independent variables were: type of structure of episodes viewed by the students (0 = non-narrative, 1 = narrative), age (M = 10.04; SD = 1.59), school year (0 = third year of Primary Education, 1 = sixth year of Primary Education), gender (0 = male 1 = female), quantile rating of sustained attention (M = 43.68; SD = 27.16), quantile rating of selective attention or attention quality (M = 34.68; SD = 25.33), and the network (0 = public, 1 = private-blended) and Socioeconomic and Cultural Index (M = -.06; SD = .74) of the school.
To verify possible co-linearity effects in the resulting models between predictive or independent variables, in each regression analysis, co-linearity diagnostics or statistics (Bowerman & O’Connell, 1990; Field, 2009; Menard, 1995; Myers, 1990) were requested in each regression analysis. Furthermore, the procedure was repeated, each time extracting an analysis predictor (from the predictor with the highest rating to the predictor with the lowest rating in terms of significance) to observe possible variations in the significance value. In other words, corroborating if the predictor continues to be statistically significant (p < .05) or not (p > .05).
In any event, a simple linear regression analysis was also conducted with each one of the predictive or independent variables (one model for each predictor) to definitively confirm if said predictors are significantly significant in relation to the narrative skill index and in identification of values and countervalues.
Results
Narrative skill index
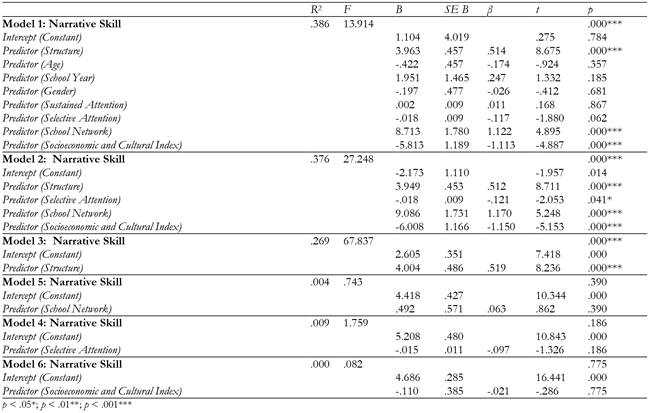
Table 1 shows the first multiple linear regression analysis (model 1), which predicts in a statistically significant way (F (8, 177) = 13.91; p < .001) 39% variance in the students' narrative skill index.
Based on said model, variance is mainly due to the type of structure (non-narrative and narrative) of the episode viewed (t (177) = 8.68; p < .001) followed by the network (t (177) = 4.90; p < .001) and Socioeconomic and Cultural Index (t (177) = -4.89; p < .001) of the school.
Moreover, correlations and statistics or diagnostics of co-linearity show a high relationship (r > .90; VIF > 10 and tolerance < .1) between student age and school year predictors, as well as between the network and Socioeconomic and Cultural Index of the school that may be affecting regression models. By eliminating the non-statistically-significant predictors from the model one-by-one (from the predictor with the greatest to the least significant value), the following predictors appear as statistically significant (model 2): structure, school network, selective attention and Socioeconomic and Cultural Index.
However, upon subjecting them to a simple linear regression analysis (model 3 to 6), we verify that only the structure type (non-narrative or narrative) of the episode viewed continues to be statistically significant (R 2 = .27; F (1, 184) = 67.84; p < .001) and we confirm that this is the predictor with the greatest variance if comparing the R 2 value in the models obtained.
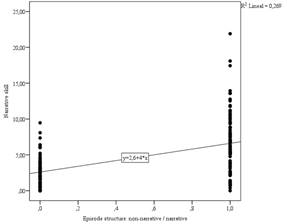
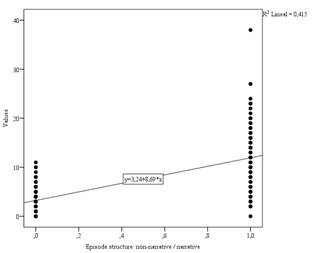
If the regression formula is applied with the beta values (B) from the third model (Yi = b 0 + b 1Xi), see Figure 1, the results show that it can be expected that students who view an episode with a non-narrative structure (Xi = 0) obtain a lower rating in the narrative skill index (Yi = 2.60) than those (Yi = 6.61) who view a narrative episode (Xi = 1).
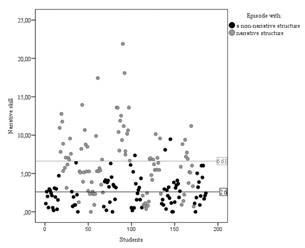
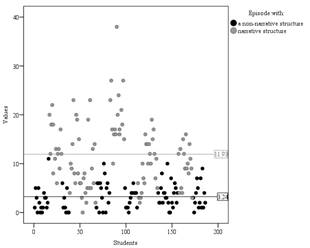
By calculating the residual (e i) for each student (meaning the differential between the rating obtained and the expected rating), we verify (see Figure 2) that, of the total sample (N = 186), 47.31% (n = 88) of students reach a positive residual (obtains a rating greater than expected) while 52.69% (n = 98) reach a negative residual (obtains a rating lower than expected). Amongst students who viewed an episode with a non-narrative structure (N = 89), a 47.19% (n = 42) obtain a positive residual and 52.81% (n = 47) negative, and those who have viewed the episode with a narrative structure (N = 97), a 47.42% (n = 46) obtained a positive residual and 52.58% (n = 51) negative.
Identification of values
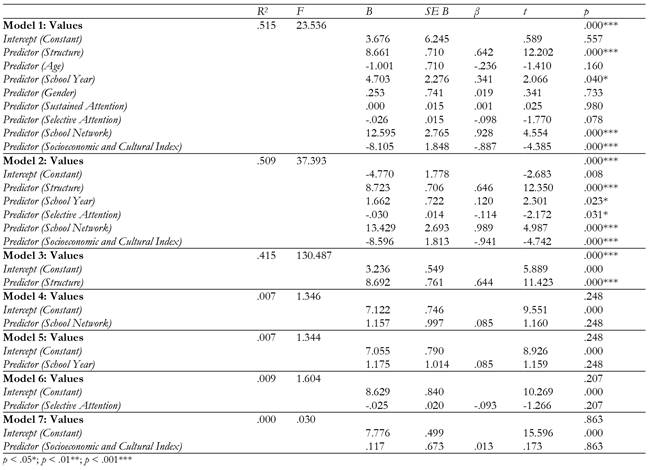
Table 2 shows the second multiple linear regression analysis (model 1), which predicts in a statistically significant way (F (8, 177) = 23.54; p < .001) 52% variance in the identification of values.
Based on said model, variance is mainly due to the type of structure (non-narrative and narrative) of the episode viewed (t (177) = 12.20; p < .001) followed by the school network (t (177) = 4.55; p < .001), the students' school year (t (177) = 2.07; p < .05) and the Socioeconomic and Cultural Index of the school (t (177) = -4.39; p < .001).
Moreover, correlations and statistics or diagnostics of co-linearity show a high relationship (r > .90; VIF > 10 and tolerance < .1) between student age and school year predictors, as well as between the network and Socioeconomic and Cultural Index of the school that may be affecting regression models. By eliminating the non-statistically-significant predictors from the model one-by-one (from the predictor with the greatest to the least significant value), the following predictors appear as statistically significant (model 2): structure, school network, school year selective attention and Socioeconomic and Cultural Index.
However, upon subjecting them to a simple linear regression analysis (model 3 to 7), we verify that only the structure type (non-narrative or narrative) of the episode viewed continues to be statistically significant (R 2 = .42; F (1, 184) = 130.49; p < .001) and we confirm that this is the predictor with the greatest variance if comparing the R 2 value in the models obtained.
If the regression formula is applied with the beta values (B) from the third regression formula model (Yi = b 0 + b 1Xi), see Figure 3, the results show that it can be expected that students who view an episode with a non-narrative structure (Xi = 0) perceive fewer values (Yi = 3.24) than those (Yi = 11.93) who view a narrative episode (Xi = 1). Identify approximately 3 or 4, as opposed to 11 or 12 values.
By calculating the residual (e i) for each student (meaning the differential between the rating obtained and the expected rating), we verify (see Figure 4) that, of the total sample (N = 186), 47.31% (n = 88) of students reach a positive residual (obtains a rating greater than expected) while 52.69% (n = 98) reach a negative residual (obtains a rating lower than expected). Amongst students who viewed an episode with a non-narrative structure (N = 89), a 43.82% (n = 39) obtain a positive residual and 56.18% (n = 50) negative, and those who have viewed the episode with a narrative structure (N = 97), a 50.52% (n = 49) obtained a positive residual and 49.48% (n = 48) negative.
Identification of countervalues
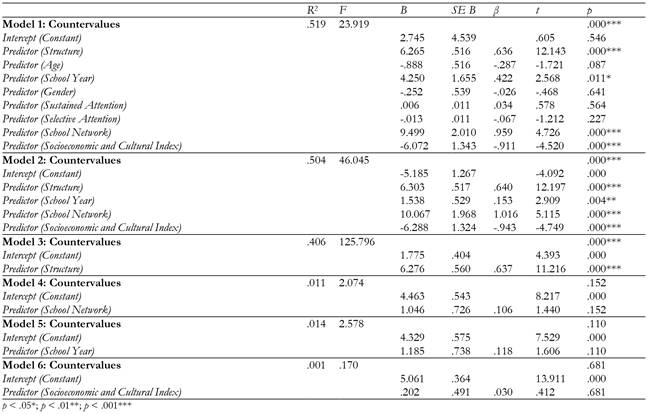
Table 3 shows the third multiple linear regression analysis (model 1), which predicts in a statistically significant way (F (8, 177) = 23.92; p < .001) 52% variance in the identification of countervalues.
Based on said model, variance is mainly due to the type of structure (non-narrative and narrative) of the episode viewed (t (177) = 12.14; p < .001) followed by the school network (t (177) = 4.73; p < .001), the students' school year (t (177) = 2.57; p < .05) and the Socioeconomic and Cultural Index of the school (t (177) = -4.52; p < .001).
Moreover, correlations and statistics or diagnostics of co-linearity show a high relationship (r > .90; VIF > 10 and tolerance < .1) between student age and school year predictors, as well as between the network and Socioeconomic and Cultural Index of the school that may be affecting regression models. By eliminating the non-statistically-significant predictors from the model one-by-one (from the predictor with the greatest to the least significant value), the following predictors continue to appear as statistically significant (model 2): structure, school network, school year and Socioeconomic and Cultural Index.
However, upon subjecting them to a simple linear regression analysis (model 3 to 6), we verify that only the structure type (non-narrative or narrative) of the episode viewed continues to be statistically significant (R 2 = .41; F (1, 184) = 125.80; p < .001) and we confirm that this is the predictor with the greatest variance if comparing the R 2 value in the models obtained.
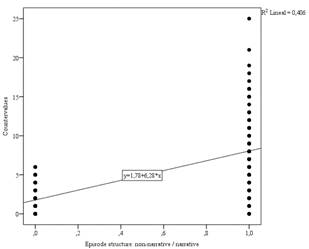
If the regression formula is applied with the beta values (B) from the third regression formula model (Yi = b 0 + b 1Xi), see Figure 5, the results show that it can be expected that students who view an episode with a non-narrative structure (Xi = 0) perceive fewer countervalues (Yi = 1.78) than those (Yi = 8.05) who view a narrative episode (Xi = 1). Identify approximately 1 or 2 as opposed to 8 or 9 countervalues.
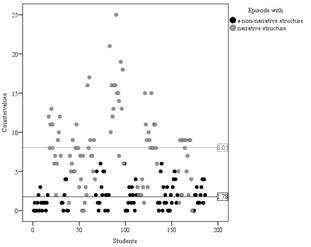
By calculating the residual (e i) for each student (meaning the differential between the rating obtained and the expected rating), we verify (see Figure 6 that, of the total sample (N = 186), 44.62% (n = 83) of students reach a positive residual (obtains a rating greater than expected) while 55.38% (n = 103) reach a negative residual (obtains a rating lower than expected). Amongst students who viewed an episode with a non-narrative structure (N = 89), a 47.19% (n = 42) obtain a positive residual and 52.81% (n = 47) negative, and those who have viewed the episode with a narrative structure (N = 97), a 42.27% (n = 41) obtained a positive residual and 57.73% (n = 56) negative.
Discussions and Conclusions
The results obtained show that the structure (non-narrative or narrative) of the fictional content viewed has a greater influence on narrative skill and identification of values and countervalues, as opposed to personal factors (such as age, the school year, gender and attention level of students) or contextual factors (such as the network and Socioeconomic and Cultural Index of the school). Unlike other works of research that have studied these variables separately or partially, this work has considered all of them conjointly by means of regression analysis.
According to the beta values (B) of the regression models executed, there is a differentiated level of demand for those who view one or another structure, given that it is expected that those who view the narrative structure obtain four more points in narrative skill, and identify eight more values and six countervalues than those who view the non-narrative. This could explain why, generally speaking, most students obtain scores lower than they should (or more negative residuals than positive). Although research customarily (Berman, 1996; Donoso, 1992; Flake et al., 2007; Fogel, 2006; Klop et al., 2013; Labaš & Maleš, 2017; Longobardi et al., 2014; McCabe & Peterson, 1991; McConnell, 2011; Schneider, 1996; Schneider & Dubé, 2005; Slobin, 1996; Stein & Glenn, 1979; Tamborini et al., 2017; Trabasso et al., 1984; Ukrainetz et al., 2005) alludes to the fact that the ages studied (8-12 ages) and their narrative skill, attention capacity and system of values or countervalues is under full development phase, this study in considering the structure, among other factors, determines that is more influential than the age or school year of the student, given that this is the predictor that explains the greatest variance.
Moreover, in comparing both structures against one another (non-narrative vs narrative) in regard to the differential between the score obtained and the score expected (percentage of students with positive or negative residual), it is observed that in narrative skill index and identification of values, most students who view the non-narrative structure obtain lower scores than they should (the percentage of students with a negative residual is greater in the non-narrative structure as opposed to the narrative) and vice-versa, higher scores than they should when viewing the narrative structure (the percentage of students with a positive residual is greater in the narrative structure as opposed to the non-narrative). If the formal characteristics inherent to both structures are taken into consideration (Bermejo, 2005; del Río, Álvarez & del Río, 2004), these results converge and confirm findings from other works of research that conclude that the episodes characterised by narrative structures favour development of students' narrative skills (Bermejo et al., 2018), as well as the identification of values and countervalues (Oregui, 2017), as opposed to others characterised by non-narrative structures.
Regarding the identification of counter-values, it works contrary to expectations. Upon visualising the non-narrative structure, most students perceive more countervalues than they should (the percentage of students with positive residual is greater in the non-narrative structure as opposed to the narrative) and vice-versa, fewer countervalues than they should upon viewing the narrative structure (the percentage of students with negative residual is greater in the narrative structure as opposed to the non-narrative). This matches with certain works of research that observe, via content analysis, that there is a greater presence of countervalues and values in non-narrative structures (Aierbe & Oregui, 2016; Oregui, 2017). However, reception studies reveal that much fewer countervalues and values are identified in non-narrative structures, as opposed to the narrative, and fewer countervalues than values in general (Oregui, 2017). Therefore, as mentioned above, this finding may be due to the fact that the level of demand is much greater for those viewing the narrative structure (perceiving eight, as opposed to two countervalues).
Continued exposure over time to this kind of episode may have an influence on narrative skill and the values system that the student is constructing, so emphasising consideration of formal aspects in fictional content for future research, as well as their educational implications, proves necessary.
In later studies, it would be advisable to collect information that refers not only to preferences, but also to the assiduity and frequency with which students view this kind of content, or even if they have previously viewed the episode shown. Moreover, so that they can transfer what they have seen to their own life experience, and for it to have a greater impact on the development of their values system, teachers and/or parents can ask them to remember a similar situation or experience they have had. This is where the inescapable work of these mediation agents comes into play.
The study's main limitation is the sample size. If it would be increased, could be verify if the same results continue to obtain in the narrative skill and identification of values and if these vary in relation to countervalues. It would also make it possible to contrast, even though in this research has not been found, if there is indeed variance or not at different levels (classroom level, school level, etc.), in case of variance, there should be made multilevel or hierarchical regression analysis. What is more, additional personal and contextual factors other than those mentioned prior could be included (for example, previous student performance in reading comprehension, written or oral expression, etc.) to attempt to increase the variance percentage explained by the regression models, and corroborate if the structure still acts as the sole predictor and/or with the greatest influence on narrative skills and identification of values and countervalues.
This research is interesting because it predicts, by means of controlling personal and contextual factors through regression analyses, that the students' retelling (analysed as narrative skill and identification of values and countervalues) will be of lower quality when viewing non-narrative structures, as opposed to narrative structures.
The results found help to blur the line between formal and informal settings, and as different studies point out (Abuzahra et al., 2016; Alonso, 2016; Russo et al., 2007; Fabbro & Sánchez-Labella, 2016; Gladkova, 2013; Hadley & Nenga, 2004; Özer & Avci, 2015; Šramová & Pavelka, 2017), the increasing development of Information and Communication Technologies (ICT) in society today, and schools' contribution to media literacy in younger generations, has led them to increasingly use audio-visual media as a teaching-learning tool. Notwithstanding, and as shown by this research, when selecting appropriate audio-visual resources to develop narrative skills and educate in values or countervalues in formal and non-formal settings, not only potential value and countervalue content must be considered; rather, the non-narrative or narrative structure must also be taken into consideration, so as to contribute to developing media skills, such as proposal that Oregui, Aierbe, Bermejo & Bartau (2017) make for Primary Education.

