


 Servicios personalizados
 Inglés (pdf)
 Articulo en XML
 Referencias del artículo
 Enviar articulo por email
 Citado por SciELO
  Citado por Google
  Similares en
SciELO
Similares en
SciELO  Similares en Google
 Permalink
Introduction
Learning disability (LD) is bounded to learning processes influenced by many factors, such as intelligence, memory, environment, and motivation. Studies show many possible causes of learning disabilities (Melekoglu, 2017). One of the most noticeable causes of LDs is the hereditary factor. Studies involving heredity found that 40% of individuals with special learning disabilities (SLD) share similar learning problems as their parents or siblings (Smith & Strick, 2010). However, heredity does not cause LDs alone. For instance, 54% of the causes of reading disabilities in twins originate from genetic factors, 40% from environmental factors, and 6% from personal factors (Smith & Strick, 2010).
The diversity and potential causes of SLDs make it difficult to diagnose them with a single psychological scale (Görgün, 2017). A comprehensive examination of SLDs includes individual development history, school reports, and psychoeducational assessments (APA, 2013). In addition, further information is obtained from inconsistencies between ability, achievement, and response to intervention (RTI) and by measuring discrepancies in cognitive domains (Fletcher et al., 2005). Evidence regarding the presence of SLDs can be obtained by measuring inconsistencies, if any, between intelligence and academic achievement. For example, if a child has average or above-average intelligence but performs significantly below the norm in reading, writing, or mathematics, s/he may be experiencing a special learning disability (Fletcher et al., 2005; Gresham & Vellutino, 2010). That is, measurements of cognitive processes are as important as the measurement of academic skills in diagnosing SLDs.
SLD Profiles on Intelligence Tests
Children with SLDs show significant variations in intelligence test scores that yield unique cognitive profiles. These profiles have promoted intelligence tests in diagnosing SLDs (Siegel, 1989). According to Siegel (1999), SLDs can only be determined using intelligence scales in many children because the heterogeneity existing in the cognitive processes of individuals with SLDs can be best captured only by intelligence measurements.
Although individuals with SLDs exhibit lower general intelligence than individuals without SLDs, their general intelligence level is in the normal range, mainly close to the lower boundary of the normal range. For instance, D'angiulli and Siegel (2003) compared the intelligence performance of 121 normal students with that of 100 students who had SLD in arithmetic and that of 143 students who had SLD in reading. The average WISC-R score (96.5) of the students with SLD in arithmetic and the average score (91.1) of the students with SLD in reading was significantly lower than the average IQ score of the typically developing group (105.3). Similarly, Hyman, Shores, and North (2006) administered the WISC-III scale to a group with SLDs and found that the average IQ of the group was 92.38. Sözel et al., (2018) administered the ASIS to a group of students with SLDs and found that the average IQ of the group was 86.76. Other studies also revealed similar findings (Ackerman et al., 1971; Mayes et al., 1998; Vargo et al., 1995).
That children with SLDs perform on the lower edge of the average range of intelligence discloses that children with SLDs differ from those with intellectual disabilities. Therefore, identifying children with SLDs should be different from identifying children with intellectual disabilities (Gresham & Vellutino, 2010). Individuals with SLDs perform poorly in not all but some of the subtests of intelligence tests, causing their overall IQ scores to be lower than the average. That children who demonstrate very low academic achievement and learning problems at school but score average or above average on intelligence tests provide evidence that these children could not be classified as having intellectual disabilities. Agreements vary regarding the minimum IQ level required to identify SLDs (Siegel, 1999). Siegel suggests that an IQ score of 80 could be the base criterion.
Several intelligence scales have been used in SLD research (Lerner & Johns, 2012). For example, an SLD study was conducted to develop the Kaufman Assessment Battery for Children (KABC-II; Kaufman et al., 2005). This study examined the intelligence levels of three groups with learning disabilities in reading, writing, and mathematics. The Mental Processing Index (MPI), Fluid-Crystallized Index (FCI), and Nonverbal Index (NVI) were found to be close to each other in the study. However, the three groups' MPI, FCI, and NVI scores were significantly lower than the norm. The indexes consist of such skills as short-term memory, long-term memory, acquired knowledge, sequential processing, and vocabulary. Low performance in the subtests measuring these skills lowers the overall intelligence scores of individuals with SLDs. Also, in this study, participants had SLDs in more than one area, which may be another reason for the low IQ in these children.
Stanford Binet-5 (SB5) has been used in studies about SLDs. Two studies stand out among others to determine the SB5 profiles of individuals with SLDs. One of these studies was conducted with 212 individuals (Roid, 2003). In this study, individuals with SLDs scored significantly lower than the norm group in the total score. In addition, the indexes scores, Fluent Reasoning (FR), Knowledge (KN), Quantitative Reasoning (QR), Visual-Spatial Processing (VS), and Working Memory (WM), were significantly lower than the norm. In another research, Nelson (2008) assessed 234 individuals with SLDs. In this study, Full-Scale IQ, FR, KN, QR, VS, and WM subtest scores were significantly lower than the norm group's scores. According to Roid and Barram (2004), the SB-5 subtests, particularly working memory, knowledge, and quantitative reasoning subtests, are gauges in diagnosing SLDs because these subtests are directly related to reading and antichemical skills.
The WISC tests have been frequently used with children with SLDs (Alm & Kaufman, 2002; Altınoğlu-Dikmeer & Gençöz, 2009; D'Angulli & Siegel, 2003; Ottem, 1998). These studies yielded a variety of SLD profiles. Among them, the discrepancy profile (difference between verbal and performance intelligence), the Bannatyne Profile, the ACID Profile, and the Kaufman Profile are noteworthy.
In studies conducted with the first version of WISC, the discrepancy between verbal intelligence and performance intelligence was accepted as an essential indicator of SLDs since the verbal intelligence means of individuals with SLDs was one standard deviation lower than their performance intelligence (Kaufman, 1981). Several studies provided evidence for this profile (Alm & Kaufman, 2002; Bilgiç et al., 2006; Schiff et al., 1981). For example, in a meta-analysis by Kaufman (1981), verbal intelligence was significantly lower than performance intelligence in individuals with SLDs.
SLD diagnoses include finding a discrepancy between verbal intelligence and performance intelligence. However, this practice may not yield a correct diagnosis because some studies reveal no difference between the two areas (D'Angulli & Siegel, 2003; Erdoğan-Bakar et al., 2016; Kaya-Şekeral & Güngörmüş-Özkardeş, 2013; Schmidt & Saklofske, 1983; Smith et al., 1977). The contradiction across studies may occur because SLDs have more than one type and require a multi-dimensional diagnosis. In addition, some children with SLDs were also found to have diagnosed or undiagnosed ADHD (Biederman & Faraone, 2005). Because of this contradiction among studies, verbal intelligence-performance intelligence discrepancy is not suggested for diagnosing SLDs (D'Angiulli & Siegel, 2003).
Banntyne (1968, 1974) claimed that the verbal intelligence-performance intelligence dichotomy in WISC is insufficient to diagnose individuals with SLDs and suggested a new subtest classification. This classification grouped the WISC subtests into four categories: conceptual category (similarities, vocabulary, judgment), spatial category (image completion, pattern with cubes, merging parts), sequential category (number sequence, image editing, and encryption), and acquired knowledge category (arithmetic and vocabulary subtests) (as cited in Kentfield, 1988). The most distinct categories were the conceptual category, where children with SLDs were found to be stronger, and the acquired knowledge category, where these children were found to be weaker. Bannatyne (1974) ranked the scores of individuals with SLDs in the WISC-R subtests as conceptual category > spatial category > sequential category > acquired knowledge category. This ranking shows that children with SLDs have a very heterogeneous profile. Rugel (1974) carried out a meta-analysis using 25 studies to determine the validity of the Bannatyne classification. The study, indeed, supported the classification. Research evidence supported the widespread use of the Bannatyne classification in diagnosis. However, some studies conducted in the succeeding years did not support the Bannatyne classification and therefore raised doubts about its use (Clarizio & Bernard 1981; D'Angulli & Siegel, 2003; Schmidt & Saklofske, 1983; Vargo et al., 1995).
The ACID profile for the diagnosis of SLDs found support in studies. In a meta-analysis, Huelsman (1970) found that the ACID subtest scores were significantly lower in individuals with SLDs. Other studies also supported the ACID profile (Ackerman et al., 1971; Dykman et al., 1973; Sandoval et al., 1988; Spafford, 1989). In their study of 165 students with SLDs, Daley and Nagle (1996) found that the ACID profile effectively distinguished individuals with SLDs and claimed that the low ACID profile was strong evidence for the diagnosis of SLDs. Later, researchers revised the ACID profile by adding the general knowledge subtest to the attention distraction index developed by Kaufman (arithmetic, coding, number series) (Watkins, Kush, & Glutting, 1997). Their research showed that children with SLDs scored lower in these subtests because of their weakness in short-term and long-term memory, visual-spatial coordination, and mathematical processing skills.
However, the ACID profile analysis was not always effective in diagnosing SLDs like other profile analyses. For example, Watkins et al. (1997) administered the WISC-III to 612 students with SLDs. They found that the ACID scores of the group were not significantly different from students without SLDs. A similar result was obtained in the study carried out by Mayes et al. (1998). They analyzed the ACID profiles of 66 children with SLDs and found that 55 did not match the ACID profile.
In the current study, the Anadolu Sak Intelligence Scale (Sak et al., 2016), a new intelligence test, was used to investigate the cognitive profiles of children with SLDs. The ASIS is a new intelligence test different from other intelligence tests in terms of its content; therefore, it might produce different cognitive profiles for children with SLDs from those reported in prior research. The findings obtained from this research could shed new light on the understanding of SLDs. Therefore, the purpose of this study was to explore the cognitive profiles of children with SLDs. The following research question guided the study.
Method
Participants
The research participants included 89 children (f = 39%; m = 61%) diagnosed with learning disabilities by certified clinicians at hospitals and approved by the Guidance and Research Centers run by the Ministry of Education in Turkey. The Guidance and Research Centers did not specify the type of learning disabilities. They were all diagnosed with a general learning disability. Participants' age ranged from 6 to 11, with a mean of 8.69. All the participants were attending primary schools in two major cities in the mid-western part of Turkey. Recruitment of children with learning disabilities took place in two phases: First, they were identified by reviewing their files in the Guidance and Research Centers. The initial sample was 2049 children. Those between the ages of 4 to 12 were selected for the second stage since ASIS can be administered to this age range. Second, those children with neurological, vision, hearing, or other types of problems or disabilities not related to learning disabilities were eliminated from the list. The final sample included 89 children. Consents were obtained from the participants' parents. The second group of participants included a matched control group of 92 students (f = 42%; m = 58%) randomly selected from the norm group with matching variables of age, gender, grade, and region.
Instruments: Anadolu Sak Intelligence Scale (ASIS)
ASIS is an individually administered intelligence test battery developed for children aged four to12 (Sak et al., 2016). It consists of seven subtests. The administration lasts from 20 to 45 minutes, depending on the age and performance of the child. The mean of the index scores is 100, and the standard deviation is 15. For the subtests, the mean is 50, and the standard deviation is 10. The theoretical framework of the ASIS is based on the Cattell-Horn-Carroll (CHC) model. The CHC model consists of three layers (McGrew, 2009). The structure of the ASIS also includes three layers. The General Intelligence Index (GIQ) is on the top layer. The second layer is composed of Verbal Ability Index (VAI), Nonverbal Ability Index (NVAI), and Memory Capacity Index (MCI). The last layer includes the following subtests: visual sequential processing memory, verbal analogical reasoning, visual perceptual flexibility, visual analogical reasoning, verbal short-term memory, visual pattern memory, and vocabulary. The GIQ is the sum of all seven subtests. The VAI is composed he verbal analogical reasoning and vocabulary subtests. The NVAI includes visual analogical reasoning and visual perceptual flexibility subtests. The MCI is the sum of visual sequential processing memory, verbal short-term memory, and visual pattern memory subtests.
The verbal reasoning subtest measures crystallized ability, problem-solving ability, and verbal reasoning ability. The vocabulary subtest measures vocabulary knowledge, language development, and expressive language. Visual reasoning is a measure of abstract thinking and reasoning through visual analogies. Visual perceptual flexibility subtest measures visualization, visual discrimination, visual awareness, mental flexibility, and visual perceptual processing skills. The visual sequential working memory subtest measures visual sequential processing and visual short-term memory. The visual pattern memory subtest measures visual-spatial processing memory and short-term memory. The verbal short-term memory subtest measures verbal short-term memory, story memory, and attention.
Several studies were carried out to investigate the validity and reliability of the ASIS (e.g., Sak et al., 2016; Sak et al., 2019; Sözel et al., 2018; Tamul et al., 2020). Reliability studies included internal consistency, test-retest consistency, and inter-scorer consistency. The median test-retest reliability coefficient is 0.91 for index scores and slightly lower for subtest scores. Test-retest correlations range from .88 (Nonverbal) to .98 (Fluid Reasoning) for the index scores and from .66 (visual-spatial memory) to .85 (visual-spatial reasoning) for the subtests. The median reliability coefficient for internal consistency is .91 for subtest scores and .97 for index scores. Inter-scorer reliability coefficient ranges from .96 to 1.00 (Tamul et al., 2020).
The validity studies include construct, criterion, developmental, discrimination, and social validity (e.g., Sak et al., 2016; Sak et al., 2019; Sözel et al., 2018; Tamul et al., 2020). A three-factor solution with three layers was confirmed using exploratory and confirmatory factor analyses in the norming study. Children's intelligence scores correlate highly with their age and years in school (.82). The criterion study shows medium to high-medium correlations between ASIS scores and RIAS scores (Reynolds Intellectual Assessment System) and medium correlations with UNIT scores (Universal Nonverbal Intelligence Test). Correlations between ASIS scores and academic achievement range from .0.57 to .82 for math, science, social studies, and the language arts (Sak et al., 2019). In addition, ASIS scores significantly correlate with intelligence-related constructs, such as math ability (.77), scientific creativity (.55) (Köprü & Ayas, 2020), and humor ability (.77) (Arslan et al., 2021).
The performance of clinical groups on the ASIS was also examined. According to the findings, gifted children, children with autism, and children with intellectual disabilities were mostly correctly classified (Sözel et al., 2018). In addition, the satisfaction of the test users of the ASIS was found to be high in terms of its content, administration, and interpretation. Further reliability and validity evidence can be found in Cirik et al. (2020), Sak et al. (2016), Sak et al. (2019), Sözel et al. (2018), and Tamul et al. (2020).
Data Collection
The ASIS was administered to all the participants with SLDs in their schools. Each school administration reserved a room for test administrations. All the rooms were checked for their appropriateness for test administration before testing started. Then, all the tests were individually administered to children by a tester who had the test training. Test administrations lasted from 30 minutes to 45 minutes. The norm data of the ASIS was obtained with permission from its authors.
Data Analysis
The first data analysis included descriptive analysis and comparisons of the ASIS scores of the participants with SLDs to those of the matched control group. Differences were tested using the independent samples t-test. Paired samples t-test was used for within-group comparisons to compare the participant's scores on the ASIS index scores. The effect sizes were estimated for significant differences using Cohen's d (Cohen, 1988). According to this formula, the effect size was accepted to be small at .20, medium at .50, and large at .80. The Bonferroni correction was applied to minimize the error margin of binary comparisons in the index-level and subtest-level analyses. An alpha level below .007 was accepted as a significant difference in the paired samples t-test comparisons of the seven subtest scores and .01 in the four index scores.
Second, the Latent Profile Analysis (LPA) was conducted to examine the cognitive profiles of children with SLDs. Based on covariance matrices, the LPA produces latent profiles for individuals who share meaningful and interpretable response patterns (Masyn, 2013). The LPA is grounded on ideas that 1) individual differences should be considered, 2) individual differences may emerge in patterns, and 3) even a small number of profiles found among individuals is meaningful (Bergman et al., 2003; Sterba, 2013). In the current study, the criteria suggested by Nylund et al. (2007) were used to determine the number of optimal profiles. First, the analysis began with a test of two models and then continued with three and four models. The best model was identified by comparing fit statistics obtained from each model. These evaluations included AIC and Sample-Adjusted Bayesian Information Criterion (SABIC), Bootstrapped Likelihood Ratio Test (BLRT), Entropy values, number of cases in each profile, and (d) posterior probabilities. The best model was determined based on the lowest AIC and SABIC values, the BLRT value meaningful and closest to 0, an entropy value closest to 1, and the probability values of profiles. In addition, the interpretability of the profiles was considered.
Results
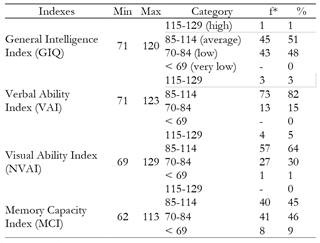
The distribution of ASIS index scores of children with SLDs is presented in Table 1. According to the findings, children's general intelligence scores ranged from 71 to 120, with a very high heterogeneous profile. While 51% had an intelligence level in the average range, 48% had intelligence one standard deviation below the average range. Only one child (1%) was in the high range. Their index sores (component scores) had a higher dispersion, with the visual ability index having the highest dispersion from very low to high. In addition, there were more individuals in the very low range (below 69 IQ) in the working memory capacity index than in the other indexes. The working memory capacity index had no individuals in the high range. Only 45% of individuals fell in the average range in the working memory capacity index, whereas 82% in the verbal ability index and 64% in the visual ability index.
Comparisons with the Matched Control Group
The research group's ASIS index and subtest scores were compared with the matched control group's scores using the independent sample t-test. The results are presented in Table 2. Overall, all the index scores of the children with SLDs were found to be significantly lower than the control group's scores (GIQ: t(179) = 8.26, p < .001; VAI: t(179) = 5.43, p < .001; NVAI: t(179) = 3.40, p < .001; MCI: t(179) = 10.79, p < .001). The largest effect sizes were found in the memory capacity index (d = 1.605), general intelligence index (d = 1.229), and verbal ability index (d = .808). The effect size for the difference between the visual ability index was medium (d = .505).
Table 2. Comparison of the ASIS Scores of Children with SLDs with the Matched Control Group.
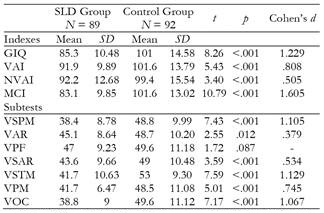
*GIQ = General Intelligence Index, VAI = Verbal Ability Index, NVAI = Visual Ability Index, MCI = Memory Capacity Index, VSPM = Visual Sequential Processing Memory, VAR = Verbal Analogical Reasoning, VPF = Visual Perceptual Flexibility, VSAR = Visual Analogical Reasoning, VSTM = Verbal Short-term Memory, VPM = Visual Pattern Memory, VOC = Vocabulary.
Subtest scores of the research participants ranged from 9 to 69 on a t-score distribution, with visual sequential processing memory having the lowest mean (38,4) and the visual perceptual flexibility subtest having the highest mean (47). All the subtest scores, except visual perceptual flexibility, of the SLD participants were significantly lower than the control group's scores (VSPM: t(179) = 7.43, p < .001; VAR: t(179) = 2.55, p =.012; VPF: t(179) = 1.72, p =.087; VSAR: t(179) = 3.59, p < .001; VSTM: t(179) = 7.59, p < .001; VPM: t(179) = 5.01, p < .001; VOC: t(179) = 7.17, p < .001). The largest effect sizes were observed in visual sequential processing memory, vocabulary, visual pattern memory, and verbal short-term memory. The other effect sizes were medium or small. A large difference between the research participants and the norm in the visual sequential processing memory and vocabulary subtests is noteworthy. The largest effect sizes were observed in verbal short-term memory (d = 1.129), visual sequential processing memory (d = 1.105), and vocabulary (d = 1.067). The other effect sizes were medium or small. Particularly, the large differences in verbal short-term memory, visual sequential processing memory, and vocabulary subtests are noteworthy.
Within-Group Comparisons: Latent Profile Analysis
ASIS index scores of children with SLDs were compared using a paired-samples t-test to explore whether they showed within-group differences. The Latent Profile Analysis was conducted to examine the cognitive profiles of the participants. The index-level findings are presented in Table 3. According to the results, all the differences between the indexes were significant, except the difference between the visual ability index and the verbal ability index. The largest effect sizes were found between the general intelligence index (GIQ) and verbal ability index (d = -.865) and between the verbal ability index and memory capacity index (d = .823). The other effect sizes were medium or small. Memory capacity scores were seemingly lower than all the other indexes.
Table 3. Within-Group Comparisons of the ASIS Index Scores.
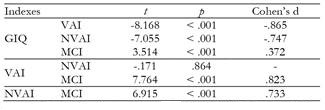
*GIQ = General Intelligence Index, VAI = Verbal Ability Index, NVAI = Visual Ability Index, MCI = Memory Capacity Index.
The fit statistics of the subtests and the profiles produced by the Latent Profile Analysis (LPA) are presented in Table 4. Overall, the LPA yielded three profiles with significant BLRT values. The four-profile model had better fit statistics than the other two profiles. However, the three-profile model was found to be more interpretable. In addition, the differences between the four-profile model and the three-profile model were not substantial. Therefore, the three-profile model was selected for further analysis. Descriptive statistics related to the three-profile model are presented in table 5.
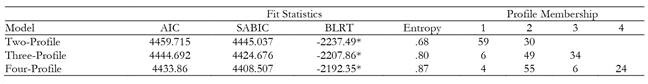
Table 5. LPA Results for the Three-Profile Model.
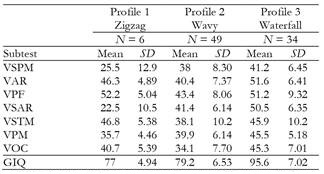
*VSPM = Visual Sequential Processing Memory, VAR = Verbal Analogical Reasoning, VPF = Visual Perceptual Flexibility, VSAR = Visual Analogical Reasoning, VSTM = Verbal Short-term Memory, VPM = Visual Pattern Memory, VOC = Vocabulary, GIQ = General Intelligence Index.
The first profile included six individuals with a zigzag cognitive profile based on subtest scores and general intelligence (77) below average (figure 1). This group had markedly fluctuating subtest scores in visual-spatial areas (table 5), with very low mean scores in the visual sequential processing memory (25.5), visual pattern memory (35.7), and visual-spatial analogical reasoning (22.5), whereas its mean scores were in the average range in the other four subtests.
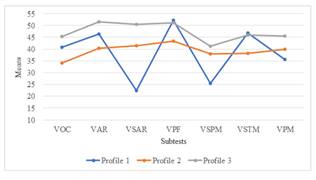
Profile two had the largest number of individuals (N = 49), with a wavy subtest profile and general intelligence (79.2) below average (figure 1). This group had substantially lower scores in the verbal domain (table 5), with a score of 34.1 in vocabulary development (VOC) and 38.1 in verbal short-term memory, as well as in visual sequential processing memory (38). Seemingly, this group's development was weak in verbal and visual memory.
The third group (N= 36) displayed a waterfall-like profile, with average scores in six subtests and relatively low scores in visual sequential processing memory. Their mean general intelligence (95.6) was also within the normal range (Table 5).
Discussion and Conclusions
The cognitive profiles of children with SLDs were examined using the Anadolu-Sak Intelligence Scale (ASIS). An important finding of this study is related to the subtest-level findings that depict cognitive profiles of children with SLDs in specific skills. The subtest performance of the participants is relatively heterogeneous, with three distinct cognitive profiles: Zigzag, wavy, and waterfall. Prior studies show that children with SLDs perform better in visual-spatial processing and reasoning than in verbal skills and sequential processing (Alm & Kaufman, 2002; Altınoğlu-Dikmeer & Gençöz, 2009; Kaufman et al., 2005; Soysal et al., 2001). However, this study shows a more heterogeneous cognitive profile for children with SLDs. Their cognitive heterogeneity is reflected differently on the ASIS subtests, with each profile showing one or more distinct weaknesses. The degree of the weaknesses of the children with a zigzag profile differs seemingly from the other two profiles in all the domains of cognitive processing. The wavy and waterfall profiles show a similar pattern of cognitive profile in their performance in the subtests, albeit the wavy profile has much lower scores and more distinct weaknesses than the waterfall profile in all the subtests.
Children with a zigzag profile have the lowest mean of general intelligence (77 IQ), below the lower borderline of the average range (85 - 115), and display irregular jumps and slumps in subtest performance. They have a unique cognitive profile in that they all perform average in the verbal domain, including vocabulary, verbal reasoning, and verbal short-term memory, but are very weak in three visual processes: visual sequential processing memory, visual-spatial pattern memory, and visual-spatial reasoning. Particularly, they show remarkable weakness in visual sequential processing memory and visual-spatial reasoning. Children with a zigzag profile are distinguishable from children with wavy and waterfall profiles for having severe weakness only in the visual domain, including low performance in visual-spatial reasoning that is average in children with wavy and waterfall profiles.
Similar to children with a zigzag profile, children with a wavy cognitive profile show a substantial weakness in three processes but both in visual and verbal domains, an indication distinguishing this profile from the zigzag and waterfall profile. This group also has low general intelligence (79 IQ), below the average. Unlike the zigzag profile, this group does not display radical jumps and slumps but shows wave-like increases and decreases in subtest performance. Particularly, the wavy profile has weakness in both verbal and visual domains of memory and only in the vocabulary, not reasoning, of the verbal domain. Low vocabulary development further distinguishes this group of children from children with zigzag and waterfall profiles in two ways. First, vocabulary development is the weakest part of this profile (within-group difference). Second, this group has the weakest vocabulary development among the three profiles (between-group differences).
Children with a waterfall profile show average performance in six processes and weak performance in one process, visual sequential processing memory, which is near the lower borderline of the average range. They have average general intelligence (95.6 IQ). Having slight weakness in visual sequential processing memory distinguishes these children from children with zigzag and wavy profiles, as the latter profiles have weaknesses in three processes.
The three profiles share a commonality: having weakness in the visual sequential processing of information, which is an essential component of working memory and has important implications for practice as visual sequential processing is an essential skill for learning arithmetic, reading, and writing. For example, vocabulary development is facilitated by reading, which is the sequential processing of symbols. Reading ability development first requires syntax skills (Turan & Ege, 2003; Turgut, 2008). Further, weak sequential processing hampers the acquisition of new knowledge (Alm & Kaufman, 2002; Altınoğlu-Dikmeer & Gençöz, 2009; Bilgiç et al., 2006; D'Angulli & Siegel, 2003; Rugel, 1974) and therefore may lead to poor vocabulary development and skill acquisition in mathematics. Because of weak working memory performance, many children with SLDs cannot complete classroom tasks as scheduled and quickly forget information they learn in school. They cannot efficiently carry out sequential tasks (Alloway, 2009). Therefore, we suggest that measures of sequential processing can provide evidence for diagnosing SLDs.
Another important finding of this study is related to component-level scores. First, general intelligence, verbal ability, visual ability, and memory scores are widely dispersed among children with SLDs. Component scores disperse three to four standard deviations, from low 70s to high 120s in verbal ability, visual ability, and memory. Second, all the component scores of the participants are much lower than the matched control group's scores. The mean intelligence of the participants is approximately one standard deviation below the mean of the matched control group. These results appear to be partly compatible with prior research on children with SLDs (D'angiulli & Siegel, 2003; Mayes et al., 1998; Nelson, 2008; Sözel et al., 2018; Roid, 2003). The general assumption children with SLDs display an intelligence level that is one standard deviation below the mean (Nelson, 2008), is supported in the current study.
The discrepancy analysis of the current study sheds light on diagnostic practices in special learning disabilities. Discrepancies between the verbal and performance domains in intelligence tests have been used as evidence of learning disabilities (Alm & Kaufman, 2002; D'Angulli & Siegel, 2003; Kaufman, 1981). Contrary to this hypothesis made in prior studies, this study shows no significant difference between the two domains. Children's verbal ability and visual ability scores are in the normal range though they are significantly lower than the matched control group's scores in the same domains. This finding is noteworthy because it has implications for practice. The finding suggests that the validity of the criteria, a significant discrepancy between the verbal domain and performance domain, used to diagnose children with SLDs should be questioned seriously.
The most notable area in which children with SLDs perform weakly is working memory. Research shows that the working memory performance of children with SLDs is distinctively lower than the performance of typically developing children (Alloway, 2009; Altınoğlu-Dikmeer & Gençöz, 2009; Prifitera & Dersh, 1993). Similarly, in the current study, children with SLDs show remarkably low memory capacity, one standard deviation below the control group. Further, although the participants show no discrepancy in their performance between verbal and visual domains, their memory performance reflects a discrepancy as it is significantly lower than their verbal ability and visual ability, a finding that makes children with SLDs more unique and that may be evidence for practitioners in diagnosing and educating children with SLDs.
Lastly, the limitations of this study should be noted. First, the sample with SLDs is not representative of the population. Second, the type of learning disability the participants were diagnosed with was not specific, as they were all diagnosed with a general learning disability. Because of this limitation, the data analyses did not include comparisons of cognitive profiles across specific learning disabilities, such as dyslexia or dyscalculia. Each specific learning disability may have a different cognitive profile. Thus, the generalizability of the findings in this study is limited to the characteristics of the participants and cognitive processes measured by the ASIS.

