


My SciELO
 Custom services
Services on Demand
Journal
Article
 English (pdf)
 Article in xml format
 Article references
 Send this article by e-mail
Indicators
-
 Cited by SciELO
 -
 Access statistics
Related links
-
 Cited by Google
 -
 Similars in
SciELO
Similars in
SciELO -
 Similars in Google
Share

 Permalink
The European Journal of Psychiatry
Print version ISSN 0213-6163
Eur. J. Psychiat. vol.23 n.2 Zaragoza Apr./Jun. 2009
A review on the use of NEO-PI-R validity scales in normative, job selection, and clinical samples
Angel Blanch*,**, Anton Aluja*,**, Salvador Gallart**,***, Joan-Marc Dolcet***
* Department of Pedagogy and Psychology, University of Lleida
** Institute of Biomedical Research (IRB Lleida)
*** Hospital Santa Maria, Lleida. Spain
ABSTRACT
Background and Objectives: In this study we review the use of the Positive Presentation Management (PPM) and Negative Presentation Management (NPM) scales, two NEO-PI-R derived measures originally devised to control for biased and distorted responses. These scales have been used with normative, job selection and clinical samples, in cross-sectional and experimental studies.
Methods: Web-based and manual searches in personality and psychological assessment journals were conducted, and information on the PPM and NPM scales was systematically recorded. Means, standard deviations and reliability coefficients were summarized and compared between three types of samples: normative, job selection and clinical.
Results: Five studies were performed with normative samples (33%), 3 with employment samples (20%) and 7 with clinical samples (47%). Cross-sectional designs were most common (60%), although there were also experimental studies (40%). Reported reliability coefficients were lower than usually accepted. There were differences in mean PPM and NPM scores in regard to the study sample background.
Conclusions: There were some discrepancies when reporting PPM and NPM results across the reviewed studies. Normative and employment samples scored higher in PPM than clinical samples. Clinical samples scored higher in NPM than normative and employment samples The PPM and NPM scales could be useful in applied situations, although parallel sources of information should be taken into account to detect distorted responses to the questionnaire. However, the results on these scales should be systematically reported in future studies.
Key words: NEO-PI-R; validity scales; presentation management; PPM; NPM.
Introduction
The NEO-PI-R is a measure of the five factor model of personality, a personality inventory that includes the factors of Neuroticism, Extraversion, Openness, Agreeableness, and Conscientiousness1. This questionnaire has been widely used in basic research, but also in applied settings such as clinical assessment2,3, and job selection4,5. The usefulness of the NEO-PI-R for clinical assessment was advocated in the early development stage of the instrument6. Nevertheless, this point of view was questioned because of the failure of the instrument to incorporate validity scales designed to detect misleading answers7. Clinical patients showing very low self-esteem and lacking of defensive strategies, present personality profiles characterized by an unstable emotionality and a social withdrawal consolidated pattern. Therefore, they would be likely to respond to the NEO-PI-R in accordance with a negative presentation. Moreover, in forensic contexts an individual might exaggerate or create psychopathological symptoms, or underreport symptoms of mental illness8,9. In regard to the particular case of applicants in a job selection situation, meta-analytic studies have shown that those people who complete a personality inventory as part of a job selection process tend to present themselves in a more positive manner, although in a lesser extent than when instructed to fake, and as a function of the particular personality dimension, and the type of job and test10. Besides, scores in social desirability were suggested to indicate true individual differences in personality variables such as emotional stability and conscientiousness, that is, job applicants with high scores on social desirability measures also scored high on these big five personality dimensions. This fact might be problematic for personality assessment in employment contexts, considering that conscientiousness and emotional stability are perhaps the best predictors of job performance. However, social desirability was not considered as a consistent predictor, suppressor, or mediator variable between personality and job performance, as controlling for its effects did not increase in any way the predictive power of personality variables in regard to job performance11.
A considerable body of research has addressed the answering style in personality self-report instruments12-15. Particularly, seminal personality inventories such as the Minnesota Multidimensional Personality Inventory (MMPI)16, or the 16PF17 have included a variety of control scales to detect several forms of distorted responses such as reading or understanding problems, non cooperative, defensive or negative attitudes, a random response, or willingness to appear in a favourable or a non favourable manner. Schinka, Kinder and Kremer18 designed three 10-item validity scales from the NEO-PI-R items: Positive Presentation Management (PPM), Negative Presentation Management (NPM) and Inconsistence (INC). PPM was intended to identify respondents claiming uncommon virtues and/or denying common faults. In contrast, NPM was intended to identify respondents claiming uncommon faults and/or denying common virtues. The INC scale was basically designed to detect random responding, although in the present study we focus on PPM and NPM scales. While Extraversion and Conscientiousness are significantly positively correlated with NPM, they are significantly negatively correlated with NPM. The opposite is true for Neuroticism, which is positively correlated with NPM but negatively with PPM4,18,19.
It has been argued that PPM and NPM scales might be useful to detect particular personality profiles addressed to manipulate individual presentation in either a positive or negative way, as they have shown from moderate to good discriminant capacity between faking and standard responding instructions2,20. However, the usefulness of these scales has also been questioned, advocating for the comparison of self-reports with independent scores as a plausible alternative to the common use of validity scales in personality assessment21. The PPM and NPM scales have been used with normative, clinical and employment samples. Therefore, the aim of the present study was to collect and review the information that has been generated on the use of the NEO-PI-R, PPM and NPM validity scales. Descriptive basic statistics, reliability and correlational data were summarized and compared in regard to the type of sample background.
Method
Literature search
In accordance with the design of the PPM and NPM scales18, we looked for studies from 1997 onwards. We conducted a web-based literature search using PsychINFO and Social Sciences Citation Index databases, including several boolean combinations of the keywords "Positive Presentation Management", "Negative Presentation Management", "Validity scales" and "NEO-PI-R". In addition, we performed a manual search in 8 key international journals that address personality assessment issues: European Journal of Personality, Journal of Personality, Journal of Personality Assessment, Journal of Personality and Social Psychology, Journal of Research in Personality, Personality and Individual Differences, Personality and Social Psychology Bulletin, and Psychological Assessment.
The PPM and NPM scales
The NEO-PI-R Personality Inventory1,22 is used to tap the Big Five personality dimensions (Neuroticism, Extraversion, Openness, Agreeableness, and Conscientiousness), with six facets within each domain allowing for a more fine-grained description of human personality. The instrument contains 240 items to which individuals respond on a 5-point Likert-type scale with response options ranging from "strongly disagree" (0) to "strongly agree"4. Scores on Positive Presentation Management (PPM) and Negative Presentation Management (NPM) are obtained from the NEO-PI-R scales. The items from the NEO-PI-R facets integrated in PPM and NPM scales are shown in Table I. All items are to be recoded in the adequate direction. PPM identifies respondents claiming uncommon virtues and/or denying common faults, whereas NPM is intended to identify respondents claiming uncommon faults and/or denying common virtues.

Results
Table II shows the studies using the PPM and NPM scales performed since 199718, considering its sample size and design, mean scores, standard deviations and reliabilities and whether correlations between PPM and NPM with the NEO-PI-R dimensions were reported or not. In the case of experimental studies, only means belonging to standard instructions were considered. There were 15 studies, 5 with normative samples (33%), 3 with employment samples (20%) and 7 with clinical samples (47%). Most studies employed a cross-sectional design (60%), although 40% conducted experimental studies addressed to determine differences between groups with standard and faking response instructions. Sample sizes of studies varied greatly from 22 to 21349 individuals5,9. For PPM, raw means and standard deviations were reported in 14 studies (93%), with two studies reporting instead T scores3,20, and one study not reporting any information on basic statistics such as means and standard deviations23. For NPM, raw means and standard deviations reporting decreased to 12 studies (80%). PPM reliability coefficients were reported for 8 studies (53%), whereas there were only 6 studies (40%) that reported the reliability coefficients for NPM. Reliabilities in PPM for normative, employment and clinical samples ranged between 0.46 to 0.50, 0.50 to 0.60, and 0.43 to 0.70, respectively, whereas NPM reliabilities ranged between 0.52, 0.52 to 0.57, and 0.60 to 0.75. These coefficients were lower than the usually accepted standards except for the Young and Schinka3 study (PPM = 0.70, NPM = 0.75). In addition, only 6 studies (40%) reported the intercorrelations between PPM and NPM with the NEO-PI-R dimensions.
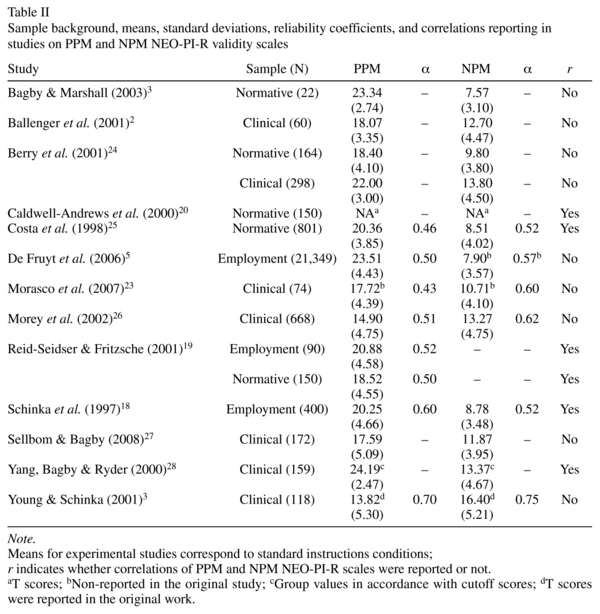
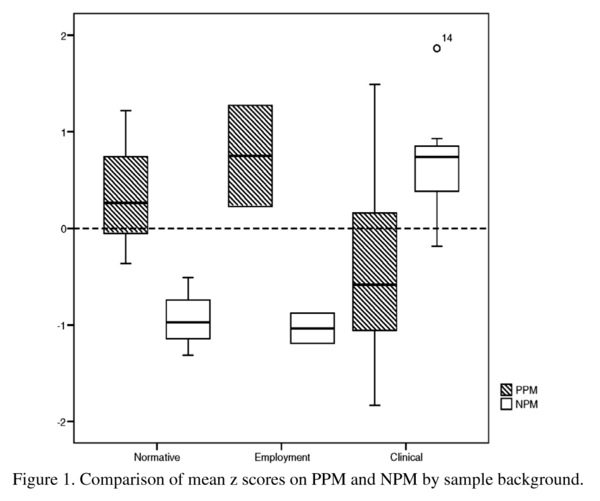
Normative, employment and clinical samples PPM mean scores ranged between 18.40 to 23.34, 20.25 to 23.51, and 13.82 to 24.19, whereas for NPM mean scores ranged between 7.57 to 9.80, 7.90 to 8.78, and 10.71 to 16.40. Using standardized mean difference (d29), moderate differences were noted on PPM between normative and employment (d = -0.67) and normative and clinical (d = 0.55) samples, while a larger difference was evident between employment and clinical (d = 0.99) samples. There were moderate differences on NPM between normative and employment samples (d = 0.37), and large differences between normative and clinical (d = -2.78), and employment and clinical samples (d = -2.91). Standardized scores were computed for both PPM and NPM (z = xi - x- / sd), in order to facilitate the comparison of mean scores in the two scales across the three sample types. Figure 1 shows that PPM z scores were mostly above the mean for both, normative and employment samples and well below the mean for clinical samples. In contrast, the NPM z scores were essentially above the mean for clinical samples and around a standard deviation below the mean for normative and employment samples. These results suggest that the studies that have obtained data from the PPM and NPM scales, report that normative and employment samples tend to score higher in PPM than clinical samples, whereas clinical samples tend to score higher in the NPM scale than normative and employment samples.
Discussion
While a body of research has highlighted the usefulness of the PPM and NPM scales to detect distorted responding to the NEO-PI-R3,19,24, other research works have suggested alternative ways of controlling for the validity of responses, such as comparing multiple sources of data in the interpretation of a given questionnaire2,21. Independently of this debate, the present study was designed to analyze from a descriptive point of view the research done to date since the development of PPM and NPM validity scales18. The results of this review suggest some discrepancies in the reporting of PPM and NPM results. In addition, there appears to be a moderating effect of the sample background in regard to the results reported in the literature.
There exist some discrepancies in PPM and NPM results reporting. For instance, some studies reported mean T scores instead of providing the raw means and standard deviations, do not report the scores in one of the scales, or even both of them. Most notably, experimental studies do not report reliability coefficients, whereas the reported reliability coefficients tend to be lower than accepted standards. This is probably due to the fact that both scales are composed of items from different personality constructs, which precludes an acceptable internal consistency. On the contrary, if these scales were made up from 'external' items such as those used by the MMPI16 or the 16PF17, better internal consistencies could perhaps be expected30. Reporting reliabilities is a particularly important issue, because with low reliabilities users of the PPM and NPM scales might not be sure whether they are measuring in fact a unified construct, and might not be able to make valid predictions whatsoever.
Only half of the studies informed about PPM and NPM intercorrelations with the rest of NEO-PI-R dimensions. Therefore, we think that future studies on the PPM and NPM scales should provide raw mean and standard deviation scores, inform about the reliability coefficients, and provide the correlation coefficients with the NEO-PI-R personality factors, or in any case, make this information readily available to interested researchers in performing for instance, a meta-analytic review. This fact, refrain us from carry out a meta-analytic review on the PPM and NPM scales, and constitutes from our viewpoint an important limitation in order to perform this sort of analyses. In this review, we succeed when asking to some researchers for this missing data in published research reports, but in other cases original authors could not be reached and therefore, that information could not be used.
The present work shows that the obtained outcomes on both, PPM and NPM differ in regard to the sample background: normative and employment samples score higher in PPM than clinical samples, whereas clinical samples have higher scores in NPM than normative and employment samples. Nevertheless, there are cases where scores in PPM were much higher in a clinical sample than in a NEO-PI-R normative sample24,25. This finding suggests that individuals included in normative and particularly in employment samples tend to present themselves as more positive than individuals in clinical samples. Nevertheless, the present results should be interpreted with caution considering a number of factors in regard to the available studies: a) the reduced size of studies; b) the great diversity of sample size; c) the only reliance on published studies; and d) the fact that some included studies might not be completely independent.
The application of the NEO-PI-R for clinical purposes has been the origin of a debate on whether or not contemplating validity scales in this instrument is sufficiently adequate6,7. As far as we know, the research interested on the PPM and NPM validity scales18 has been rather limited and on occasions critical. For instance, Piedmont21 questioned the usefulness of validity scales for research purposes, although suggested that their results did not consistently support the invalidity of these validity scales in applied settings, i.e., clinical or in industrial / organizational psychology. Further, more robust results were recently obtained with a relative-scored personality questionnaire when compared with a standard likert-type big five questionnaire in regard to faking31. On the other hand, there is evidence pointing out to the usefulness of the PPM scale to screen for potentially distorted NEO-PI-R responses27. Therefore, while there is some agreement regarding the usefulness of the PPM and NPM scales in applied situations, it has also been recommended to use parallel sources of information such as independent ratings, personal interviews, or relative-scored personality questionnaires. The results reviewed in the present study about the PPM and NPM scales indicate that: a) there have been only a few studies which are insufficient to reach any consistent conclusions about its usefulness; b) results are reported in different forms across studies, which poses some difficulties in order to perform a meta-analytical review of these scales; and c) there are differences in mean scores across different sample types. Future studies might perhaps attempt to report PPM and NPM results in a uniform way, and to compare their results with the present findings considering the sample background.
References
Articles preceded by an asterisk were included in the analysis.
1. Costa PT, McCrae RR. Professional manual: Revised NEO personality inventory (NEO-PI-R) and NEO five-factor-inventory (NEO-FFI). Odessa, FL: Psychological Assessment Resources; 1992. [ Links ]
2. *Ballenger JF, Caldwell-Andrews A, Baer RA. Effects of positive impression management on the NEO personality inventory - revised in a clinical population. Psychol Assess 2001; 13(2): 254-260. [ Links ]
3. *Young MS, Schinka JA. Research validity scales for the NEO-PI-R: Additional evidence for reliability and validity. J Pers Assess 2001; 76(3): 412-420. [ Links ]
4. Marshall MB, De Fruyt F, Rolland JP, Bagby RM. Social desirable responding and the factorial stability of the NEO PI-R. Psychol Assess 2005; 17(3): 379-384. [ Links ]
5. *De Fruyt F, Aluja A, García LF, Rolland JP, Jung SC. Positive presentation management and intelligence and the personality differentiation by intelligence hypothesis in job applicants. International Journal of Selection and Assessment 2006; 14(2): 101-112. [ Links ]
6. Costa PT, McCrae RR. Normal personality assessment in clinical practice. Psychol Assess 1992; 4(1): 5-13. [ Links ]
7. Ben-Porath YS, Waller MK. Five big issues in clinical personality assessment: A rejoinder to Costa and McCrae. Psychol Assess 1992; 4(1): 23-25. [ Links ]
8. Baer RA, Miller J. Underreporting of psychopathology on the MMPI-2: A meta-analytic review. Psychol Assess 2002; 14(1): 16-26. [ Links ]
9. *Bagby RM, Marshall MB. Positive Impression Management and its influence on the revised NEO Personality Inventory: A comparison of analog and differential prevalence group designs. Psychol Assess 2003; 15(3): 333-339. [ Links ]
10. Birkeland SA, Manson TM, Kisamore JL, Brannick MT, Smith MA. A meta-analytic investigation of job applicant faking on personality measures. International Journal of Selection and Assessment 2006; 14(4): 317-335. [ Links ]
11. Ones DS, Viswesvaran C, Reiss AD. Role of social desirability in personality testing for personnel selection: The red herring. J Appl Psychol 1996; 81(6): 660-679. [ Links ]
12. Cronbach LJ. Response sets and test validity. Educ Psychol Meas 1946; 6: 475-494. [ Links ]
13. Edwards AL. The social desirability variable in personality assessment and research. New York: Dryden; 1957. [ Links ]
14. Jackson DN, Messick S. Acquiescence and desirability as response determinants on the MMPI. Educ Psychol Meas 1961; 21: 771-790. [ Links ]
15. Tellegen A. The analysis of consistency in personality assessment. J Pers 1988; 56: 621-663. [ Links ]
16. Hathaway SR, McKinley JC. The Minnesota Multiphasic Personality Inventory (Rev. ed.). Minneapolis: University of Minnesota Press; 1942. [ Links ]
17. Cattell RB, Eber HW, Tatsuoka MM. Handbook for sixteen personality factor questionnaire. San Francisco: Jossey-Bass; 1970. [ Links ]
18. *Schinka JA, Kinder BN, Kremer T. Research validity scales for the NEO-PI-R: Development and initial validation. J Pers Assess 1997; 68(1): 127-138. [ Links ]
19. *Reid-Seiser HL, Fritzsche BA. The usefulness of the NEO-PI-R positive presentation management scale for detecting response distortion in employment contexts. Pers Individ Dif 2001; 31(4): 639-650. [ Links ]
20. *Caldwell-Andrews A, Baer RA, Berry DTR. Effects of response sets on NEO-PI-R scores and their relations to external criteria. J Pers Assess 2000; 74(3): 472-488. [ Links ]
21. Piedmont RL, McCrae RR, Reiman R, Angleitner A. On the invalidity of validity scales: Evidence from self-reports and observer ratings in volunteer samples. J Pers Soc Psychol 2000; 78(3): 582-593. [ Links ]
22. Aluja A, García O, García LF. A comparative study of Zuckerman's three structural models for personality through the NEO-PI-R, ZKPQ-III-R, EPQ-R and Goldberg's 50-bipolar adjectives. Pers Individ Dif 2002; 33(5): 713-725. [ Links ]
23. *Morasco BJ, Gfeller JD, Elder KA. The utility of the NEO-PI-R validity scales to detect response distortion: A comparison with the MMPI-2. J Pers Assess 2007; 88(3): 276-283. [ Links ]
24. *Berry DTR, Bagby RM, Smerz J, Rinaldo JC, Caldwell-Andrews A, Baer RA. Effectiveness of NEO-PI-R research validity scales for discriminating analog malingering and genuine psychopathology. J Pers Assess 2001; 76(3): 496-516. [ Links ]
25. *Costa PT, McCrae RR, Rolland JP. NEO PI-R: Inventaire de Personnalité Révisé. Adaptation Française: Manuel (Revised NEO PI-R, French adaptation); 1998. [ Links ]
26. *Morey LC, Quigley BD, Sanislow CA, Skodol AE, McGlashan TH, Shea MT, et al. Substance or style? An investigation of the NEO-PI-R validity scales. J Pers Assess 2002; 79(3): 583-599. [ Links ]
27. *Sellbom M, Bagby RM. The validity and utility of the Positive Presentation Management and Negative Presentation Management scales for the Revised NEO Personality Inventory. Assessment 2008; 15: 165-176. [ Links ]
28. *Yang J, Bagby RM, Ryder AG. Response style and the revised NEO personality inventory: Validity scales and spousal ratings in a chinese psychiatric sample. Assessment 2000; 7(4): 389-402. [ Links ]
29. Cohen J. Statistical power analysis for the behavioural sciences. New Jersey: Lawerence Erlbaum Associates, Inc; 1988. [ Links ]
30. Crowne D, Marlowe D. The approval motive. New York: Wiley and Sons; 1964. [ Links ]
31. Hirsh JB, Peterson JB. Predicting creativity and academic success with a "fake-proof" measure of the Big Five. J Res Pers 2008; 42: 1323-1333. [ Links ]
![]() Correspondence:
Correspondence:
Angel Blanch
Department of Pedagogy and Psychology
Avda. Estudi General, 4
25001 Lleida (Catalonia). Spain
Tel: 973706529
Fax: 973706505
E-mail: ablanch@pip.udl.cat
Received: 7 July 2008
Revised:5 February 2009
Accepted: 10 February 2009

