


My SciELO
 Custom services
Services on Demand
Journal
Article
 English (pdf)
 Article in xml format
 Article references
 Send this article by e-mail
Indicators
-
 Cited by SciELO
 -
 Access statistics
Related links
-
 Cited by Google
 -
 Similars in
SciELO
Similars in
SciELO -
 Similars in Google
Share

 Permalink
The European Journal of Psychiatry
Print version ISSN 0213-6163
Eur. J. Psychiat. vol.29 n.4 Zaragoza Oct./Dec. 2015
https://dx.doi.org/10.4321/S0213-61632015000400003
Eating attitudes, weight control behaviors and risk factors for eating disorders among Chinese female dance students
Zhuoli Taoa and Yuhan Sunb
a School of Humanity, South East University, Nanjing. China
b School of Dance, National Culture College of Province Xingjiang. China
The manuscript was supported by "2011 program" and "Citizen Moral and Social Customs Collaborative Innovation Center" in South East University.
ABSTRACT
Background and Objectives: Along with the economic development, eating disorders begin to appear in China. In this context, we study potential risks for eating disorders.
Methods: 1,199 Chinese students, aged 12-25 years, were randomly selected in spring 2006 from a survey with a series of scales (EAT-26, EDI) that were used as a screening examination for eating attitudes, weight control behaviors and risk factors. Among them were 31 female Chinese dance students. The dancer students were compared with the female high risk group of eating disorders (EAT ≥ 20) and the female low risk group (EAT 0-9) according to their scores on EAT-26 and EDI.
Results: There were just 3 dancers (10%) with scores on the EAT-26 who were over the cut-off point of 20 for high risk of an eating disorder. The dance group also showed significantly higher scores than the low risk group (EAT 0-9) not only on the subscales Dieting, and EAT-26 total scores on the EAT-26, but also on the subscales Perfectionism and Maturity Fears on the EDI.
Conclusions: Among the group of female Chinese dance students, most participants did not show a high risk for eating disorders and their high scores on some subscales on the EAT-26 and EDI could be caused by their occupation.
Key words: Female; Dance students; China; Eating attitudes; Weight control behavior; Eating disorders.
Introduction
Eating disorders were previously assumed to be culturally special to Western populations, but the increasing number of reports of eating disorders from a number of Chinese and other non-Western societies has cast doubt on this assumption1. It seems like that the rise of eating disorders in large cities in China is correlated to the rapid sociocultural changes taking place in China today2.
Studies in the world show that special groups like ballet dancers3-6 are at high-risk of getting eating disorders, "for whom weight and body shape are of paramount importance"7. The dance community is ''the most obsessively weight-conscious subculture in the country"8. "The extremely low body weight expected from a female ballet dancer in recent decades appears to be asocial phenomenon of fashion rather than a reflection of pragmatism5".
To our knowledge, there are no reports about the eating attitudes and dieting behavior among dancers in China.
The aim of this study therefore was to compare Chinese female dance students (their major is dance in a national culture college), a female high risk group for an eating disorder (EAT over 20, no dancers included) and a female low risk group for an eating disorder (EAT 0-9, no dancers included) regarding their eating attitudes, weight control behaviors and risk factors for eating disorders.
Methods
Participants
This survey was based on the author's dissertation; it was approved by School of Dance, National Culture College of Province Xingjiang, China. The data for this survey was collected from February to April 2006 using a cohort of 1,252 Chinese secondary school - and college students aged 12 to 25 years (M = 18.99, SD = 2.92) in two cities- Nanjing (five million inhabitants) and Urumqi (three million inhabitants). There were seven data collection sites (one university and two schools in Nanjing and two universities and two schools in Urumqi). Authorities, teachers and students had previously received a written description of the survey. Consent forms were distributed to secondary school students; seeking the signature of at least one parent. The test takers were informed that participation was voluntary and anonymous. The questionnaire was translated by the author into Chinese for the Han participants, and it was also translated into Uiguren for Uiguren participants by native Uiguren. Students responded to self-administered questionnaires in the classroom during a 20-30 minute session. All participants were categorized along with their EAT scores into three groups: (EAT 0-9), (EAT 10-19) and (EAT ≥ 20). The available questionnaire was returned by 1,199 participants (95.67%), including 767 females (63.9% of respondents) and 432 males (36.1% of respondents). Among them were 490 Han females (40.9% of respondents), 277 Uiguren females (23.1% of respondents), 380 Han males (31.7% of respondents) and 52 Uiguren males (4.3% of respondents). Furthermore, in order to obtain data about dance school students, who are considered as a group with high risk of eating disorder, we gained information about 36 female students majoring in dancing at a national college of culture in Urimuqi. The available questionnaire was also returned by 31 female dancers (86.11% of dancers).
Both secondary school students and college students completed more than 80% of the questionnaire items. Missing values for both groups were replaced with the mean responses of same-gender participants of the same age. Keel, Heatherton, Dorer, Joiner and Zalta (2006)9 have used the 80% as the criterion for their survey, so the criterion was adapted in this represent survey.
This current survey was conducted with a sample of Chinese secondary school and college students in a cross culture study. Originally, this survey was designed to compare mental health between two race groups in China: Han Chinese (the majority group in China, over 90% of China's 1.3 billion populations are ethnically Han Chinese) and Uiguren Chinese (a Muslim minority of 8 million people living in West China).
Assessment Instruments
The Demographic Features Questions
The demographic characteristics of the participants were obtained through a questionnaire covering the participant's gender, age, height, weight, and ideal weight.
The Eating Attitudes Test (EAT-26)
The EAT-2610 is a shortened version of the questionnaire EAT-40. EAT-40 is a self-reporting instrument for the study of eating disorders within clinical and non-clinical groups; it was devised by Garner & Garfinkel (1979)11. A later factor analytic study10 identified three factors/subscales (dieting, bulimia and oral control) and found that the EAT-26 did not lose internal reliability or discriminatory diagnostic validity12.
Cronbach's α for the EAT-26 of female participants was 0.83, Cronbach's α for the EAT-26 of female dancer students was 0.76.
The Eating Disorder Inventory (EDI)
"The original EDI-113 is a 64-item self-report instrument that measures psychological and behavioural traits common in individuals with an eating disorder14". The Eating Disorder Inventory is supposed to measure not only symptomatic aspects of eating disorders (determined by the Drive for Thinness, Bulimia and Body Dissatisfaction subscales) but also psychological characteristics relevant to eating disorders (determined by the ineffectiveness, perfectionism, interpersonal distrust, interoceptive awareness and maturity fears subscales)15.
Aschenbrenner, Aschenbrenner, Kirchmann and Strauss16 used the first three subscales of EAT-26 (dieting, bulimia and oral control), the last six subscales of EDI-1 (body dissatisfaction, ineffectiveness, perfectionism, interpersonal distrust, interoceptive awareness and maturity fears) and indicated in their survey an acceptable degree of validity and reliability. The instrument was used in this survey with permission of the first author (Aschenbrenner).
Cronbach's α for the EDI of female participants was 0.83, Cronbach's α for the EDI of female dancer students was 0.84.
Influential factors
The eating behaviors of the participants were described using a scale covering the degree of teasing experienced by the participants in the family and in school, the meaning of a thin figure and important sources of information about their ideas about figure, diet, weight. The scale was adapted by Aschenbrenner et al. (2004)16.
Weight Control Behaviors
The dieting behaviours of the participants were obtained through a scale covering their participation in sports, the use of dieting pills and diet. The scale was adapted by Aschenbrenner et al. (2004)16.
Data analysis
Analyses in SPSS 13.0 (SPSS Inc., Chicago, IL, USA). When fewer than 80 % of the items were completed on the scales, scale scores were coded as missing. An ANOVA test was used to compare the demographic characteristics. An ANOVA test was also used to compared the scores on the scales EAT-26 and part of subscales of EDI between the dancer group, the female high risk group (EAT ≥ 20) (no dancers included) and the female low risk group (EAT 0-9) (no dancers included).
Result
Demographic Data
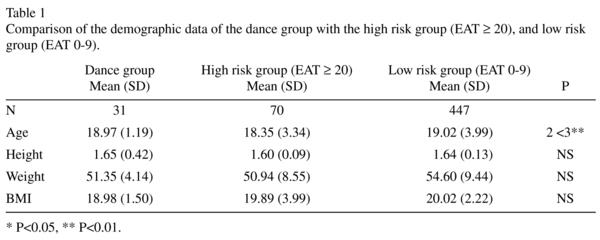
Comparison of the Dance Group with the High Risk Group and Low Risk Group
The high risk group (EAT ≥ 20) was significantly younger than the low risk group (EAT 0-9). Furthermore, there was no significant difference between the three groups (Table 1).
Weight Concern and Psychological Characteristics Related to Eating Disorders
The high risk group (EAT ≥ 20) demonstrated significantly higher scores than the low risk group (EAT 0-9) on subscales on the EAT-26- Dieting, Bulimia, Oral control and EAT-26 total scores, and on subscales on the EDI-body dissatisfaction, ineffectiveness, perfectionism, interpersonal distrust, interoceptive awareness and maturity fears (Table 2).
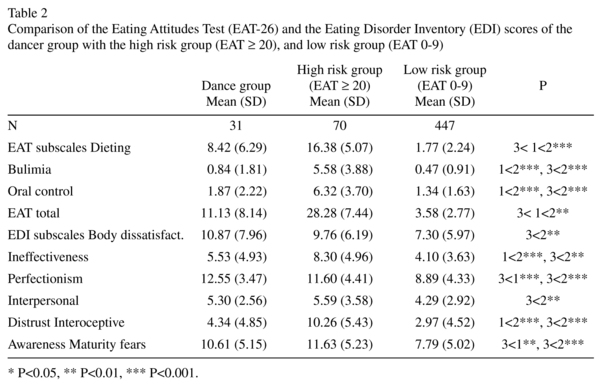
The high risk group (EAT ≥ 20) scored significantly higher than the dance group on the subscales on the EAT-26-Dieting, Bulimia, Oral control and EAT-26 total scores; and on subscales ineffectiveness and interoceptive awareness on the EDI (Table 2).
The dance group also showed significantly higher scores than the low risk group (EAT 0-9) on the subscales Dieting and EAT-26 total scores in the EAT-26, and on subscales perfectionism and maturity fears on the EDI (Table 2).
From the point BMI = 19, the line of the dance group rose more steeply than those of the high risk group (EAT ≥ 20) and the low risk group (EAT 0-9) (Figure 1).

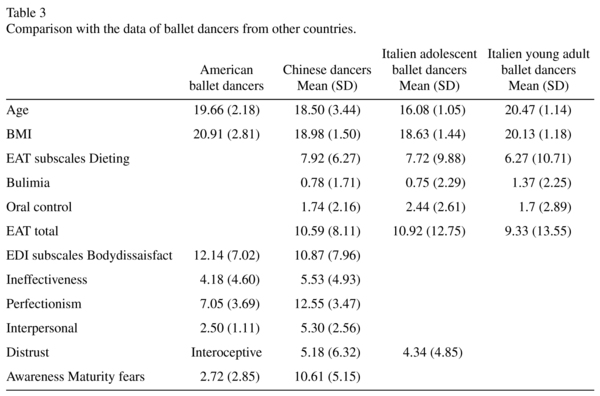
Comparison with the Western Data (in the USA and Italy)
The Chinese dancers scored on the subscales Dieting, Bulimia and Oral control on the EAT-26 close to the results of the study done on the Italian ballet dancers. In comparison with the American ballet dancers, the Chinese dancers reported much higher perfectionism and maturity fears scores on the EDI (Table 3).
Influential Factors
There were no significant difference among the three groups on influential factors.
Weight Control Behaviors
There were just 3 dancers, whose scores on the EAT-26 reached the cut-off point of 20, indicating high eating risk. Nineteen dancers (59.4%) took exercise more than 7 hours each week, it was significantly higher than the high risk group (EAT ≥ 20) (10.7%, N = 8) or the low risk group (EAT 0-9) (9.0%, N = 29). On average, the dancers in the present survey reported spending an average of more than 30 hours per week in training for their discipline, and 7 hours or more each week in addition. (15.6% N = 5) of the dancers reported having to use diet pills, the percentage was lower than the high risk group (EAT ≥ 20) (28.6%, N = 20) and higher than the low risk group (EAT 0-9) (4.5% N = 19). Twenty three of the dancers (69.7%), who reported having diet, and this proportion (69.7%) was higher than in the high risk group (EAT ≥ 20) (60.2%, N = 50), and higher than in the low risk group (EAT 0-9) (33.9%, N = 147).
Discussion
The dance group scored significantly higher on the subscale Dieting and EAT-26 total scores on the EAT-26, significantly higher on the subscales body dissatisfaction and perfectionism on the EDI, in comparison with female low risk group (EAT 0-9). The higher dieting and body dissatisfaction may have been a result of their discipline. Female ballet students are less satisfied with their weight in comparison with their non-dancing peers17 and often wish to decrease weight despite a low body mass index (BMI)18.
In this present survey, there was a significant difference between the dance group and the high risk group in all three subscales of the EAT-26, as well as two subscales on the EDI. We hypothesized that the group of Chinese dance students and the group of Chinese students with high risk for an eating disorder who reveal different eating attitudes and behaviours.
The dance group showed much higher scores on the subscale Dieting on the EAT-26 and on the subscales body dissatisfaction, perfectionism and maturity fear on the EDI than the low risk group. The high risk group showed much higher scores on the subscales Dieting, Bulimia and Oral control on the EAT-26 and higher scores on the subscales ineffectiveness and interoceptive awareness than the low risk group. It is possible that the dancer group and high risk group may have different psychopathology mechanisms. The dancers showed significantly higher scores on the subscales body dissatisfaction, perfectionism and maturity fear, however not significantly on subscales ineffectiveness and interoceptive awareness, which describing psychological characteristics. It can be hypothesized that the eating attitudes and weight concern of the dance group is more related to their occupation, and they showed lower susceptibility to psychological problems than the high risk group. The eating attitudes and behavior among the high risk group is more correlated with their personal psychological problems like Ineffectiveness and Interoceptive Awareness.
From the point BMI = 19, the curve describing the dance group rose more steeply than those of the high risk group (EAT ≥ 20) or the low risk group (EAT 0-9). It can be assumed that at the same BMI, the dance group presented stronger Body Dissatisfaction compared to the high risk group (EAT ≥ 20) and the low risk group (EAT 0-9). We hypothesized that the dance students were more sensitive to their weight than the high risk group (EAT ≥ 20) or the low risk group (EAT 0-9) (Figure 1).
There were just 3 dancers (10%) in this present survey whose scores on the EAT-26 reached the cut-off point of 20 indicating a high risk for an eating disorder. This was slightly lower than the report in Germany- 8 of 58 Germany female ballet dancers (13.7%) scored on the EAT-40 over the cut-off point of 3018. In this present survey the college dance students with more academic focus and whose major subject is folk dance may be under lower pressure than ballet dancers to diet. It may explain the reason why so small a group of Chinese dance student is at high risk for eating disorders. Students studying at highly competitive ballet schools with an emphasis on preparing students for professional dance careers scored significantly higher on the Eating Attitudes Test (EAT) and exhibited a higher prevalence of anorexia nervosa than those studying at less competitive schools with a more academic and less professional focus19. Comparison among different dance groups about their weight concerns and eating behaviors can be conducted in further studies.
The subscales on the EAT-26 showed the Chinese dancers to be slightly different in comparison with the Italian ballet dancers, suggesting that they may share similar eating attitudes and behaviors. In comparison with the American ballet dancers reported the Chinese dancer students much higher maturity fears and perfectionism scores on the EDI. To our knowledge, there has been no similar comparison study between Chinese and American dancers, and therefore we could only use the results of other surveys, which were not specially focused on dancers.
Maturity Fear
Compared with the North American standardization sample, all the Japanese groups with anorexia and bulimia reported significantly greater maturity fears with EDI-220. Lee et al. compared their survey with Hong Kong university students and the data of Canadian females and found that the Hong Kong students showed significantly higher Maturity Fear21.
In a review of previous studies, different Chinese or Asian groups showed higher Maturity Fear than the North American sample, which supported the result of the present survey. "In Chinese society a highly cohesive parent-child relationship is lifelong, and adolescence is likened to a moratorium with no obvious endpoint. Intergenerational dependence, not personal autonomy, is treasured. The high maturity fear scores may similarly reflect such a cultural reality22.
Perfectionism
Hong Kong students displayed higher scores gap on perfectionism on the questionnaire Almost Perfect Scale-Revised in comparison to U.S. students' scores in previous studies23. Asian Americans students scored significantly higher than Afro-Americans and Caucasian Americans on 3 of 6 perfectionism items on the EDI24. Compared with the North American sample, the Japanese AN-restricting subtype group (AN-R) presented lower levels of drive for thinness and perfectionism20. The Hong Kong students showed significantly lower perfectionism than the Canadian female sample21.
The results of comparisons concerning perfectionism varied widerly. perfectionism among Chinese middle school students was correlated with their parental rearing Behavior25. A study done with Asian-Americans and non-Asian Americans showed that Asians are demographically similar to their non-Asian peers but tend to come from higher-income families who are more achievement oriented26. We speculated that at the moment, most Chinese families are allowed to have one child, so the parents focus their expectations on their children. This may correlate with the high perfectionism among the group of Chinese dancers.
Some limitations should be pointed out. First, it should be acknowledged that some researchers reported that the questionnaire EAT is an inadequate screening tool for eating disturbances in young people27,28. The results of the survey must be cautiously interpreted. Second, the number of dance students was small, it making the generalization of the results difficult. Third, the cross-sectional self-report design limits our ability to make causal inferences. Fourth, the reliability and validity of the Chinese version of the questionnaire needs the test of time.
Acknowledgments
We wish to thank Mr. Christopher Angell for the correction with the manuscript.
References
1. Lee S. Self-starvation in context: towards a culturally sensitive understanding of anorexia nervosa. Soc Sci Med. 1995; 41(1): 25-36. [ Links ]
2. Tong J, Miao SJ, Wang J, Zhang JJ, Wu HM, Li T, Hsu LK. Five cases of male eating disorders in Central China. Int J Eat Disord. 2005; 37(1): 72-5. [ Links ]
3. Hamilton LH, Brooks-Gunn J, Warren MP, Hamilton WG. The impact of thinness and dieting on the professional ballet dancer. J Can Assoc Health Phys Educ Recr 1986; 52: 4-9. [ Links ]
4. Vaisman N, Voet H, Akivis A, Sive-Ner I. Weight perception of adolescent dancing school students. Arch Pediatr Adolesc Med. 1996; 150(2): 187-90. [ Links ]
5. Abraham S. Eating and weight controlling behaviours of young ballet dancers. Psychopathology. 1996; 29(4): 218-22. [ Links ]
6. Szmukler GI, Eisler I, Gillies C, Hayward ME. The implications of anorexia nervosa in a ballet school. J Psychiatr Res. 1985; 19(2-3): 177-81. [ Links ]
7. Dotti A, Fioravanti M, Balotta M, Tozzi F, Cannella C, Lazzari R. Eating behaviour of ballet dancers. Eat Weight Disord. 2002 Mar; 7(1): 60-7. [ Links ]
8. Lowenkopf EL, Vincent LM. The student ballet dancer and anorexia. Hillside J Clin Psychiatry 1982; 4: 53-64. [ Links ]
9. Keel PK, Heatherton TF, Dorer DJ, Joiner TE, Zalta AK. Point prevalence of bulimia nervosa in 1982, 1992, and 2002. Psychol Med. 2006; 36(1): 119-27. [ Links ]
10. Garner DM, Olmsted MP, Bohr Y, Garfinkel PE. The eating attitudes test: psychometric features and clinical correlates. Psychol Med. 1982; 12(4): 871-8. [ Links ]
11. Garner DM, Garfinkel PE. The Eating Attitude Test: an index of the symptoms of anorexia nervosa. Psychol Med 1979; 9: 273-9. [ Links ]
12. Eagles JM, McLeod IH, Mercer G, Watson F. Seasonality of eating pathology on the eating attitudes test in a nonclinical population. Int J Eat Disord. 2000; 27(3): 335-40. [ Links ]
13. Garner DM, Olmsted MP, Polivy J. Development and Validation of multidimensional Eating Disorder Inventory for anorexia nervosa and bulimia. Int J Eat Disord. 1983; 2: 15-34. [ Links ]
14. Franko DL, Striegel-Moore RH, Barton BA, Schumann BC, Garner DM, Daniels SR, Schreiber GB, Crawford PB. Measuring eating concerns in black and white adolescent girls. Int J Eat Disord. 2004 Mar; 35(2): 179-89. [ Links ]
15. Kinzl JF, Traweger C, Guenther V, Biebl W. Family background and sexual abuse associated with eating disorders. Am J Psychiatry. 1994; 151(8): 1127-31. [ Links ]
16. Aschenbrenner K, Aschenbrenner F, Kirchmann H, Strauss B. Störungen des Essverhaltens bei Gymnasiasten und Studenten. Psychoth Psychosom Med Psychol (in German) 2004; 6: 259-63. [ Links ]
17. Bettle N, Bettle O, Neumärker U, Neumärker KJ. Body image and self-esteem in adolescent ballet dancers. Percept Mot Skills. 2001; 93(1): 297-309. [ Links ]
18. Bettle N, Bettle O, Neumärker U, Neumärker KJ. Adolescent ballet school students: their quest for body weight change. Psychopathology. 1998; 31(3): 153-9. [ Links ]
19. Garner DM, Garfinkel PE. Socio-cultural factors in the development of anorexia nervosa. Psychol Med. 1980; 10(4): 647-56. [ Links ]
20. Pike KM, Mizushima H. The clinical presentation of Japanese women with anorexia nervosa and bulimia nervosa: a study of the Eating Disorders Inventory-2. Int J Eat Disord. 2005; 37(1): 26-31. [ Links ]
21. Lee S, Lee AM, Leung T, Yu H. Psychometric properties of the Eating Disorders Inventory (EDI-1) in a nonclinical Chinese population in Hong Kong. Int J Eat Disord. 1997; 21(2): 187-94. [ Links ]
22. Yang KS. Chinese social orientation: An integrative analysis. In TY Lin, WS Tseng, E. K. Yeh (Eds), Chinese societies and mental health Hong Kong: Oxford University Press; 1995/ pp. 19-39. [ Links ]
23. Wang KT, Yuen M, Slaney RB. Perfectionism, Depression, Loneliness, and Life Satisfaction: A Study of High School Students in Hong Kong. The Counseling Psychologist 2009; 37: 249-74. [ Links ]
24. Castro JR, Rice KG. Perfectionism and ethnicity: implications for depressive symptoms and self-reported academic achievement. Cultur Divers Ethnic Minor Psychol. 2003; 9(1): 64-78. [ Links ]
25. Zhu D, Zhang X, Li J. Relationship between middle school students perfectionism and parental rearing behavior. J Chinese Clinic Psycho 2009; 17: 93-5. [ Links ]
26. Lee HY, Lock J. Anorexia nervosa in Asian-American adolescents: do they differ from their non-Asian peers. Int J Eat Disord. 2007; 40(3): 227-31. [ Links ]
27. Tanofsky-Kraff M, Morgan CM, Yanovski SZ, Marmarosh C, Wilfley DE, Yanovski JA. Comparison of assessments of children's eating-disordered behaviors by interview and questionnaire. Int J Eat Disord. 2003; 33(2): 213-24. [ Links ]
28. Colton PA, Olmsted MP, Rodin GM. Eating disturbances in a school population of preteen girls: assessment and screening. Int J Eat Disord. 2007; 40(5): 435-40. [ Links ]
![]() Correspondence:
Correspondence:
Dr. Zhuoli Tao
School of Humanity
South East University
Sipailou Nr. 2
Nanjing, 210096
China
E-mail: 101011422@seu.edu.cn
Received: 16 August 2015
Revised: 21 October 2015
Accepted: 26 October 2015

