


My SciELO
 Custom services
Services on Demand
Journal
Article
 English (pdf)
 Article in xml format
 Article references
 Send this article by e-mail
Indicators
-
 Cited by SciELO
 -
 Access statistics
Related links
-
 Cited by Google
 -
 Similars in
SciELO
Similars in
SciELO -
 Similars in Google
Share

 Permalink
Gaceta Sanitaria
Print version ISSN 0213-9111
Gac Sanit vol.23 n.1 Barcelona Jan./Feb. 2009
Construction of the birth weight by gestational age population reference curves of Catalonia (Spain): Methods and development
Elaboración de las curvas poblacionales de referencia del peso al nacer, según la edad gestacional, de Cataluña: métodos y desarrollo
Francisca Ramos a,b,* , Glória Pérez c,d,e, Mireia Jané f and Ramon Prats f
a Doctorate Program in Public Health and Biomedical Research of Autonomous University of Barcelona, Barcelona, Spain
b Servei d'Atenció Primària Alt Penedès-Garraf, Institut Català de la Salut, Vilanova i la Geltrú, Barcelona, Spain
c Agency of Public Health of Barcelona, Barcelona, Spain
d Pompeu Fabra University, Barcelona, Spain
e CIBER of Epidemiology and Public Health (CIBERESP), Spain
f Mother and Child Health Program, Department of Health, Barcelona, Spain
This manuscript was in part funded by the Mother and Child Programme of the Department of Health. Generalitat de Catalunya.
Dirección para correspondencia
ABSTRACT
Infant size at birth is a useful indicator to evaluate fetal growth in relation to gestational age. There is no standard model to create anthropometric reference curves in neonates, but the method chosen could determine the reference values estimated. We describe the methods used to construct population-based reference curves of birth weight for gestational age in Catalonia, Spain. These methods included detection of implausible values of birth weight for gestational age by a probabilistic cluster model, utilization of the Generalized Additive Model for Location and Scale method to obtain smoothed percentiles and z-scores, and calculation of 95% confidence intervals by bootstrapping. To our knowledge, these are the first reference curves in neonates constructed through a method allowing asymmetric distributions with kurtosis to be modelled. Estimation of confidence intervals is useful to determine which reference intervals can be employed to assess newborn size.
Palabras clave: Growth curves. Implausible values. Smoothing. Skewness. Kurtosis. Confidence intervals.
RESUMEN
La evaluación del tamaño en el nacimiento es un indicador útil para evaluar el crecimiento fetal en relación con la edad gestacional. No hay un modelo estándar para crear curvas de referencia antropométricas en recién nacidos, pero el método escogido podría determinar los valores de referencia estimados. Describimos los métodos utilizados para elaborar las curvas de referencia poblacionales del peso al nacer según la edad gestacional en Cataluña, España. Estos métodos incluyen la detección de los valores inverosímiles de peso al nacer para la edad gestacional mediante un modelo probabilístico de agrupaciones, la utilización del modelo Generalized Additive Model for Location and Scale para la obtención de los percentiles alisados, y las puntuaciones z y el cálculo de los intervalos de confianza del 95% mediante remuestreos. Hasta donde conocemos, éstas son las primeras curvas de referencia en recién nacidos en las cuales se ha utilizado un método que permite modelar distribuciones asimétricas con curtosis. La valoración de intervalos de confianza es útil para determinar los intervalos de referencia que pueden emplearse para evaluar el tamaño del recién nacido.
Palabras clave: Curvas de crecimiento. Valores inverosímiles. Alisado. Asimetría. Curtosis. Intervalos de confianza.
Birth weight by gestational age is recommended by the World Health Organization (WHO) as an indicator to assess the infant size at birth, prenatal and postnatal health.1 To obtain this indicator, reference curves and tables which relates birth weight to gestational age must be developed. Since 1947, when the first such curves were made in Birmingham2 a variety of curves have been published. These curves are not comparable due to the varying characteristics of the populations used to construct them but also due to differences in methodology as source of information (hospital versus population registry), exclusion criteria (congenital malformations, maternal diseases, implausible values, etc.), stratum of references (sex, ethnicity, multiplicity, etc.) and the statistical methods used to estimate reference values.3 There is not a standard model to create reference curves, but it is generally agreed that inclusion of all live births, including newborns with health problems, and the use of basedpopulation data assures the generalization of the curves.3 On the other hand, there is much variability in the statistical methods that are used for obtaining the reference values. Furthermore, it is important to have present that the chosen method can overestimate or underestimate the percentiles flattened.4
The objective is to describe the methods used to elaborate the population reference curves of birth weight for gestational age of Catalonia, Spain,5 using a methodology never used before in the published curves in our country.
The references we constructed were based on population data. The reference population was all alive births from mother residents in Catalonia during the period 1997-2001 (n=301,241). The source of information was the birth registry of Mother and Child Health Program of the Catalan Regional Government Department of Health. Data on birth was collected from hospital records in the screening of congenital metabolopathies and cystic fibrosis in all newborns that it is carried out in the first 72 h of life.6
The variables used were: birth weight (in grams), gestational age (in weeks), sex, multiple pregnancy (yes/no) and year of birth. We assigned the multiple newborns to a twin or triplet pregnancy by conducting various recordlinkages using identifier variables. Reference curves were stratified by sex for singleton and twin births, but not for triplets due to the small number of cases. All registries with valid birth weight, gestational age and sex were included. Only were excluded those newborns classified as multiple pregnancy in which the siblings could not be identified by the record linkage or those in which the registries showed implausible values of birth weight for gestational age.
Implausible values for gestational age are due to systematic or random errors in the determination of the date of the last menstruation that could distort the upper percentiles of the reference curves if them not be removed.7 There are different methods to detect and to eliminate these erroneous values. In a basic way, some methods are based in the utilization of cutpoints from which the values would be considerate implausible and other in the utilization of statistical methods of probability assignment to this values.7 We chose a probabilistic cluster model to detect these implausible values because do not make any assumption about types of error were occurring in the data.8 The distributions of birth weight for early gestational ages were positively skewed and clearly bimodal between 30-32 weeks of gestation which suggested that data were not homogeneous (Fig. 1). The positively skewed and bimodal distributions of data suggested that they were a normal mixture distribution with two components.8 The hypothesis is that major component consisted of values of birth weight with greatest probability of belonging to the corresponding gestational age and the minor component for the values wrongly assigned to it. This method was used for gestational ages ranging from 26-34 weeks because in this range it was observed asymmetry and/or bimodality. After 34 week of gestation asymmetry disappeared. Birth weight value was considered implausible for the gestational age if the probability of belonging to the minor component was greater than 0.5 as used Tentoni et al.8 We also considered that to have more than 50% probability of being mistaken were sufficient to considered that the birth weight were erroneously assigned to the corresponding gestational age. The implausible values detected were 21.7% (n=1565) of the 7212 cases in this range. However, 9.8% (n=705) values were finally excluded, as they presented probabilities greater than 0.5 of belonging to the minor component. The implausible values detected by the probabilistic cluster model were similar to the data finally excluded between 26th and 32th weeks of gestation. The difference were greater in 33th and 34th gestational ages: 15.9% detected vs. 6.0% excluded in 33th gestational age and 30.27% detected vs. 5.74% excluded in 34th gestational age. These was due because their bimodal distribution were more overlapping, but we considered that asymmetry were sufficiently greater to considered that their distributions had two components. Furthermore, implausible values excluded in each week of gestation in this study were similar with the values obtained in the study by Tentoni et al8 which also observed a maximum of cases excluded in week 30 (32.21% our study vs 26.9% by Tentoni). Once implausible values have been removed the smoothed curves showed more biological plausibility (Fig. 2). The statistical package used was the EM-clust library via S-Plus version 6.1.

Figure 1. Histograms of birth weight by 26th to 43th gestational age and the function of normal density.
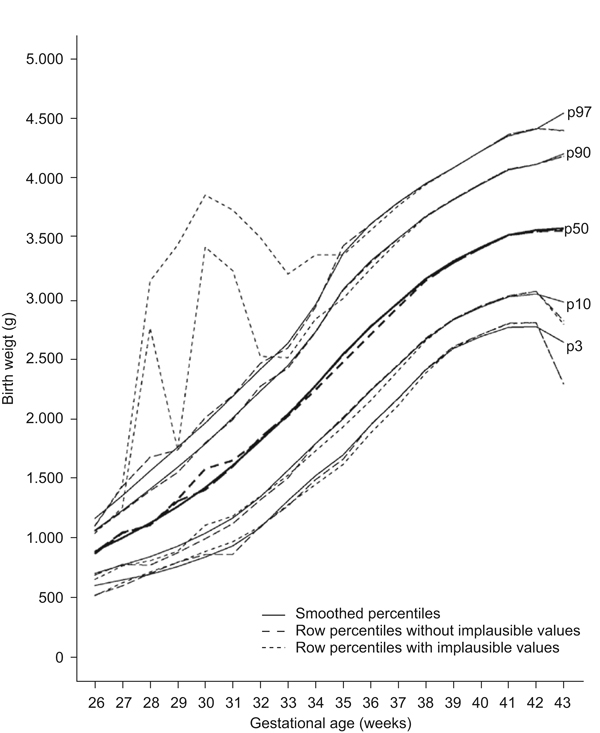
Figure 2. Comparison between row percentiles with and without implausible values
and smoothed percentiles (p3, p10, p50, p90, p97). Male singleton.
After removing implausible values, we have to choose the method for obtaining the reference values. The simplest form is to obtain the crude percentiles without applying any method of smoothing, but even if the sample size is great the obtained percentiles would be robust. Then to be able to obtain flattened curves it is necessary to apply statistical methods of smoothing, but which? In a basic way there are two family of methods, the non parametric methods and the parametric ones. The first do not make any assumption in the type of probability distribution of the birth weight at gestational age, giving in general percentiles less precise than the parametric methods.9 The parametric methods assume that the birth weight distribution for every week of gestational age follows the normal probability distribution. If we choose a parametric method, first we will determine if the probability distribution of weight for every gestational age is normal or not. If it is not normal, we will choose which transformation (logarithmic, Box-Cox, exponential, etc.) will be necessary to transform it to a normal distribution. We chose the Generalized Additive Model for Location and Scale Shape (GAMLSS) model because which allowed to model asymmetric distributions with kurtosis, to estimate any smoothed percentile values and the corresponding z-score.10 Other similar methods, such as the socalled LMS method,11 does not permit modelling kurtosis and hence, the estimated percentiles could be affected since the assumption of normality should not be fully satisfied. As far as we know, the GAMLSS method was used in the child growth standards developed by WHO12 but not in any other study obtaining newborn reference curves. This model allows to model the parameters of many distributions, like Normal distribution, Box-Cox distribution, exponential power distribution and Box-Cox-power-exponential (BCPE) distribution, among others. In our case we had chosen the BCPE distribution because it provided a model for variables with positive/negative skewness, and with leptokurtosis/platykurtosis, as in our study. Another reason was the minor deviance of the BCPE distribution compared with other distributions, indicating that it presented a better adjustment to our datum. The distribution has four parameters and expresses like BCPE (μ, σ, V, T). These parameters μ, σ, V, T are the parameters of location (median), dispersion (coefficient of variation), skewness (power of Box-Cox to transform the positive or negative assymetry) and kurtosis (exponential power to transform the lepto/platicurtosis). The assumption of the model is that once carried out the BoxCox and exponential transformations, the original variable will distribute according to the Normal istribution with median 0, standard deviation 1, assimetry 0 and kurtosis 3. The functions of each of the parameters are: g1(μ)=h1(x), g2(σ)=h2(x), g3(V)=h3(x) and g4(T)=h4(x). The left part of the function of each parameter indicates the link function which the parameter will be modelled, that it can be modelled in the original units or in transformed units like logarithm in basis 10, as in our study. The right part of the function are the non parametric functions cubic splines. The different non parametric functions are estimated by maximizing the penalized likelihood through the Fisher algorithm. The general criterion to select the model is to choose that minimize the GAIC («generalized Akaike Information Criterion»). From the estimation of the 4 parameters the model GAMLSS allows to obtain any percentile value with their corresponding zscore. The different models chose for log (birthweight) were: BCPE (10,11,6,7) for male singleton birth; BCPE (10,8,6,6) for female singleton birth; BCPE (3,2,1, CONSTANT) for twin, male sex; BCPE (3,0,0,0) for twin, female sex and BCPE (6,0,0, CONSTANT) for triplets. Q-test and wormplot (Fig. 3) methods check the assumptions of normality of the GAMLSS models by the assessment of deviation from normality of the z-scores in different contiguous gestational age groups. When the fit poorly it was repeated, increasing the parameters degrees of freedom in an attempt to improve the fit.10 In our study, all the models for singleton and twin pregnancies fitted well because the normality of zscores was satisfied. Thus, the different percentiles obtained are comparable to the corresponding standardized normal z-scores. Regarding the model for triplets, the degree to which normality assumptions are satisfied must be considered with caution, due to the small number of cases, something which may affect not only the estimations of percentiles but also the power of the various tests. The statistical package used was the GAMLSS library via R version 2.0.1.
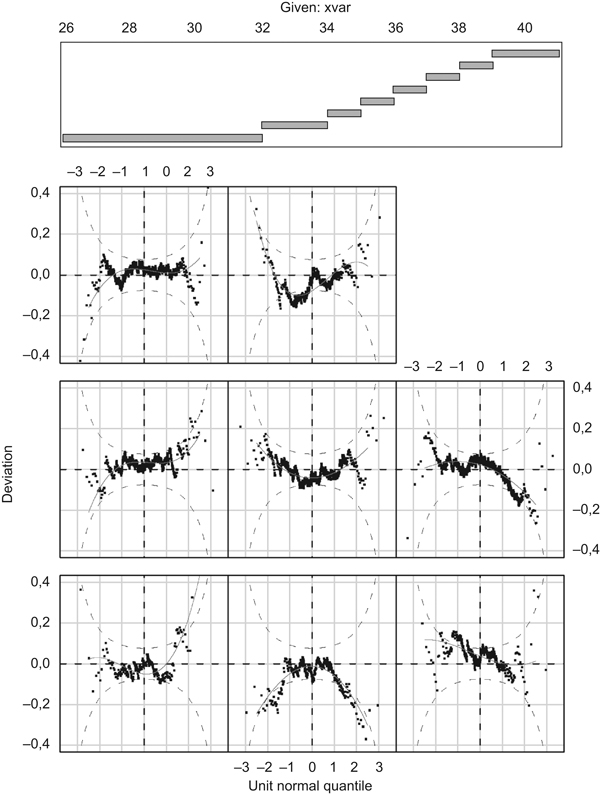
Figure 3. Worm plot of model BCPE (3,0,0,0) for birth weight by gestational age of male sex twin.
Finally, when the percentiles and z-scores are estimated, is important to obtain the 95% confidence intervals to determine their precision. To obtain the confidence intervals for the percentiles, 25 bootstraps11 with replacement were carried out for each of the groups. New models were fitted for each of the bootstraps with the same degrees of freedom as the respective original models, in order to ensure that the degree of smoothing was the same. The percentiles obtained were ordered, and the maximum and minimum values represent an approximate 95% confidence interval.11 The appraisal of the overlap of the limits of the 95% confidence intervals of the adjacent extreme percentiles permit to describe which percentiles it could be use to assess if a newborn are small or great for gestational age, and consequently, which reference interval could be used: 80% (percentile 10 to 90), 90% (percentile 5 to 95) and 95% (percentile 3 to 97). The precision estimated permit to use a 80%, 90% or 95% singleton and twin reference intervals in almost all weeks of gestation with a confidence of 95% that a newborn classified as small for gestational age really are allocated below and not above 10th percentile in the 80% reference interval for example (Table 1). We are not aware of any other study assessing precision and non-overlapping of 95% confidence intervals of percentiles, although various authors have recommended it.9,11 Instead of presenting 95% confidence intervals, other studies have reported percentile curves guaranteeing precision above certain minimum numbers of cases in each week of gestation and strata.13

The methods used allows to obtain reference curves and tables population-based, statistical modelling of gestational ages to correct biologically implausible values, the sex-specific and multifetal pregnancy percentiles, the adaptability to the use of either percentiles or z-scores and the assessment of the precision of the extreme percentiles by the calculation of 95% confidence intervals. In conclusion, the methods used are applicable to develop newborn reference curves.
Acknowledgements
We are grateful for the collaboration of Dave MacFarlane for English translation and edition reviewing of the last manuscript version.
Bibliografía
1. World Health Organization Expert Committee on the Use and Interpretation of Anthropometry. Physical status: the use and interpretation of anthropometry. World Health Organization, 1995. [ Links ]
2. Gibson JR, McKeown T. Observations on all births (23,970) in Birmingham, 1947. VI. Birth weight, duration of gestation, and survival related to sex. Br J Soc Med. 1952;6:152-8. [ Links ]
3. Goldenberg RL, Cutter GR, Hoffman HJ, et al. Intrauterine growth retardation: standards for diagnosis. Am J Obstet Gynecol. 1989;161:271-7. [ Links ]
4. Flegal KM. Curve smoothing and transformations in the development of growth curves. Am J Clin Nutr. 1999;70:163S-5S. [ Links ]
5. Departament de Salut. Corbes de referencia de pes, perímetre cranial i longitud en néixer de nounats d'embarassos únics, de bessons i de trigèmins a Catalunya. Barcelona: Departament de Salut; 2008. [ Links ]
6. Departament de Salut. Indicadors de salut materno-infantil a Catalunya, 2000-2002. Barcelona: Departament de Salut (cited 2007 Dec 3). Available from: http://www.gencat.net/salut/depsan/units/sanitat/pdf/indica2002.pdf (Catalan). [ Links ]
7. Platt RW, Abrahamowicz M, Kramer MS, et al. Detecting and eliminating erroneous gestational ages: a normal mixture model. Stat Med. 2001;20:3491-503. [ Links ]
8. Tentoni S, Astolfi P, De Pasquale A, et al. Birthweight by gestational age in preterm babies according to a Gaussian mixture model. BJOG. 2004;111:31-7. [ Links ]
9. Wright E, Royston P. A comparison of statistical methods for age-related reference intervals. JR Statist Soc A. 1997;160:47-69. [ Links ]
10. Rigby RA, Stasinopoulos DM. Smooth centile curves for skew and kurtotic data modelled using the Box-Cox power exponential distribution. Stat Med. 2004;23:3053-76. [ Links ]
11. Cole TJ, Freeman JV, Preece MA. British 1990 growth reference centiles for weight, height, body mass index and head circumference fitted by maximum penalized likelihood. Stat Med. 1998;17:407-29. [ Links ]
12. Borghi E, De Onis M, Garza C, et al. Construction of the World Health Organization child growth standards: selection of methods for attained growth curves. Stat Med. 2006;25:247-65. [ Links ]
13. Kuczmarski RJ, Ogden CL, Guo SS, et al. 2000 CDC Growth Charts for the United States: methods and development. Vital Health Stat 11. 2002;246:1-190. [ Links ]
![]() Dirección para correspondencia:
Dirección para correspondencia:
Correo electrónico: pramos@ambitcp.catsalut.net
(F. Ramos)
Recibido el 19 de diciembre de 2007
Aceptado el 12 de marzo de 2008

