


Mi SciELO
 Servicios personalizados
Servicios Personalizados
Revista
Articulo
 Inglés (pdf)
 Articulo en XML
 Referencias del artículo
 Enviar articulo por email
Indicadores
-
 Citado por SciELO
 -
 Accesos
Links relacionados
-
 Citado por Google
 -
 Similares en
SciELO
Similares en
SciELO -
 Similares en Google
Compartir

 Permalink
Revista Española de Enfermedades Digestivas
versión impresa ISSN 1130-0108
Rev. esp. enferm. dig. vol.108 no.8 Madrid ago. 2016
https://dx.doi.org/10.17235/reed.2016.3980/2016
Evaluation of large esophageal varices in cirrhotic patients by transient elastography: a meta-analysis
Tao Li, Yundong Qu, Baohua Yang, Yan Xue and Lei Wang
Department of Infectious Diseases and Hepatology. The Second Hospital of Shandong University. Jinan, China
This study was funded by Youth Fund of the 2nd Hospital of Shandong University (grant number: Y2014010012).
ABSTRACT
Background and purpose: Transient elastography (TE) has been shown to be a valuable tool for the prediction of large esophageal varices. However, the conclusions have not been always consistent throughout the different studies. Therefore, we performed a further meta-analysis in order to evaluate the diagnostic accuracy of transient elastography for the prediction of large esophageal varices.
Methods: We performed a systematic literature search in PubMed, EMBASE, Web of Science, and CENTRAL in The Cochrane Library without time restriction. The strategy we used was "(fibroscan OR transient elastography OR stiffness) AND esophageal varices". Accuracy measures such as pooled sensitivity, specificity, among others, were calculated using Meta-DiSc statistical software.
Results: Twenty studies (2,994 patients) were included in our meta-analysis. The values of pooled sensitivity, specificity, positive and negative likelihood ratios and diagnostic odds ratio were as follows: 0.81 (95% CI, 0.79-0.84), 0.71 (95% CI, 0.69-0.73), 2.63 (95% CI, 2.15-3.23), 0.27 (95% CI, 0.22-0.34) and 10.30 (95% CI, 7.33-14.47). The area under the receiver operating characteristics curve was 0.83. The Spearman correlation coefficient was 0.246 with a p-value of 0.296, indicating the absence of any significant threshold effects. In our subgroup analysis, the heterogeneity could be partially explained by the geographical origin of the study or etiology; or it could be partially explained blindingly, through the appropriate interval and cut-off value of the liver stiffness (LS).
Conclusions: Transient elastography could be used as a valuable non-invasive screening tool for the prediction of large esophageal varices. However, since LS cut-off values vary throughout the different studies and significant heterogeneity also exists among them, we need more reasonable approaches or flow diagram in order to improve the operability of this technology.
Key words: Transient elastography. Liver stiffness. Esophageal varices. Meta-analysis.
Introduction
Cirrhosis is the advanced stage of almost all chronic liver diseases. Esophageal varices (EV), which may cause a rupture and variceal hemorrhages, are one of the most dreaded complications of cirrhosis. The rate of patients without varices, that developed varices later on, and the rate of patients with small varices which developed into large varices were 8% per year (1). The risk of first bleeding is related to the size of varices and the severity of red wale marks (2), which emphasizes the importance of screening for large esophageal varices (LEV). Screening for the presence of esophageal varices with esophagogastroduodenoscopy (EGD, the gold standard) in cirrhotic patients is recommended by current guidelines (1). However, the cost of screening with EGD for EV remains too high for patients suffering from cirrhosis, especially for people from under-developed countries. Furthermore, EGD may be unpleasant, of poor compliance, or even risky for some patients. Repeated endoscopic examinations may not be accepted easily by those who are in need of a long-term follow-up. Considering all of the above, an alternative, non-invasive and relatively inexpensive tool is needed in order to predict the presence of LEV.
Several non-invasive methods, such as capsule endoscopy, CT scan and Fibrotest, transientelastography (TE), have been developed to predict EV (3-6). Among them, TE (Fibroscan®) has demonstrated excellent diagnostic accuracy for the staging of liver fibrosis and cirrhosis (7). This non-invasive method has also shown potential value in the prediction of LEV, which will soon have clinical significance throughout the clinical practice. However, the current evidence available is not consistent and it can vary from a good correlation (6,8) to a poor correlation (9). Therefore, we performed a further meta-analysis of all the available studies to assess the diagnostic accuracy of TE (in comparison to EGD) for the prediction of LEV in adult cirrhotic patients.
Methods
The process of our meta-analysis followed a prior established protocol.
Literature search
We performed a systematic literature search of PubMed, EMBASE, Web of Science, and CENTRAL in the Cochrane Library without time and language restrictions. The search strategy used was "(fibroscan OR transient elastography OR stiffness) AND esophageal varices". The search was conducted independently by three reviewers. All disagreements were resolved by full discussions within the group of researchers or with another author. After reviewing all titles and abstracts, the full-text articles of eligible studies were obtained. The references of each full-text article were also reviewed carefully to include studies that met with the inclusion criteria. The search strategy was last updated on the 31st of March 2015.
Eligibility criteria
1. Participants: liver cirrhosis patients (18 years of age or older) with cirrhosis confirmed by liver biopsy or other clinical/imaging methods.
2. Interventions, comparisons and outcomes: liver stiffness (LS) was performed by TE (Fibroscan) in order to predict LEV and EGD was used as the gold standard.
3. Study: no restriction of research type.
4. Enough data was extracted to be able to calculate the true positive, false positive, true negative and false negative value for diagnostic performance.
5. Esophageal varices were graded according to their size by EGD: grade 0, no varices; grade I, minimal increase of esophageal varices; grade II, enlarged, tortuous varices that occupy less than 1/3 of the lumen; and grade III, large, coil-shaped varices that occupy more than 1/3 of the lumen (10). LEV was defined as EV > grade II.
Exclusion criteria
We excluded those studies that met the following criteria:
1. The participants were not restricted to adult cirrhotic patients.
2. TE (Fibroscan) was not used to evaluate LS.
3. EGD was not used as the gold standard for the diagnosis of LEV.
4. The classification of the gold standard and the diagnostic criteria of liver cirrhosis were not proper.
5. Patients co-infected with HIV were included.
6. Patients with liver carcinoma were included.
7. The documents did not report the necessary data to calculate diagnostic results.
8. Review articles, letters providing no original data, or abstracts with data that have been published as full-text articles.
Data extraction
Two of the three reviewers carried out the extraction of the following data from retrieved studies:
1. General characteristics, including the study design, author, publishing year, geographical origin, sample size, median age, gender, time period, and etiology of liver cirrhosis.
2. The cut-off value, sensitivity, specificity, positive likelihood ratio (PLR) and negative likelihood ratio (NLR) to calculate the true positive, false positive, true negative and false negative values for diagnostic performance of TE for LEV.
Assessment of methodological quality
Three reviewers independently assessed the methodological quality of the relevant studies by using the Quality Assessment of Diagnostic Accuracy Studies-2 (QUADAS-2) tool (11). The QUADAS-2 tool contains four domains: patient selection, index test, reference standard, and flow and timing. The risk of bias was assessed in all four domains and the degree of applicability was assessed in the first three domains (11). All discrepancies were resolved by full discussions within the group of researchers or with another author.
Statistical analysis
We evaluated the threshold effects by calculating the Spearman correlation coefficient between the logit of sensitivity and the logit of (1-specificity). Threshold effects were considered as significant if p < 0.05. Pooled sensitivity, specificity, PLR, NLR and diagnostic odds ratio (DOR) were calculated with the corresponding 95% confidence interval (CI). We added 1/2 to all cells of studies containing a count of zero. We also computed the summary receiver operating characteristics curve (SROC) and the area under the receiver operating characteristics curve (AUROC). The heterogeneity of all test parameters was examined with the Q-statistic test and the I2 index for sensitivity and specificity. Heterogeneity was considered to be significant if p < 0.10 (Q statistic) or the I2 value was 50% or more (12). If available, we conducted subgroup analyses according to the study characteristics (geographical origin, gender, etiology of liver cirrhosis, blind or not, appropriate interval or not, cut-off value, study design, etc.) in order to analyze sources of heterogeneity. All the above statistical analyses were performed by Meta-DiSc statistical software version 1.4 (Hospital Ramón y Cajal, Madrid, Spain).
We used the Deeks' funnel plot asymmetry test to assess publication bias, where a formal test was conducted by a regression of the diagnostic log odds ratio, with p < 0.10 for the slope coefficient which indicated significant asymmetry (13). This statistical analysis was conducted using the Stata 12.0 statistical software package (StataCorp LP, College Station, TX, USA).
Results
Following the chosen strategy, we found 231 potentially relevant articles during the preliminary stage. By reviewing the abstracts of all these articles, 180 articles were excluded because they failed to meet the eligibility criteria. In the next round of selection, 31 of the remaining 51 articles were also excluded. Finally, 20 studies (2,994 patients) (6,8,9,14-30) were included for our meta-analysis. Figure 1 shows the flow diagram of literature search and study selection.
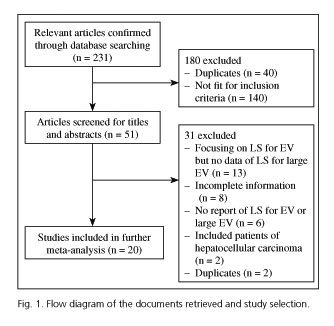
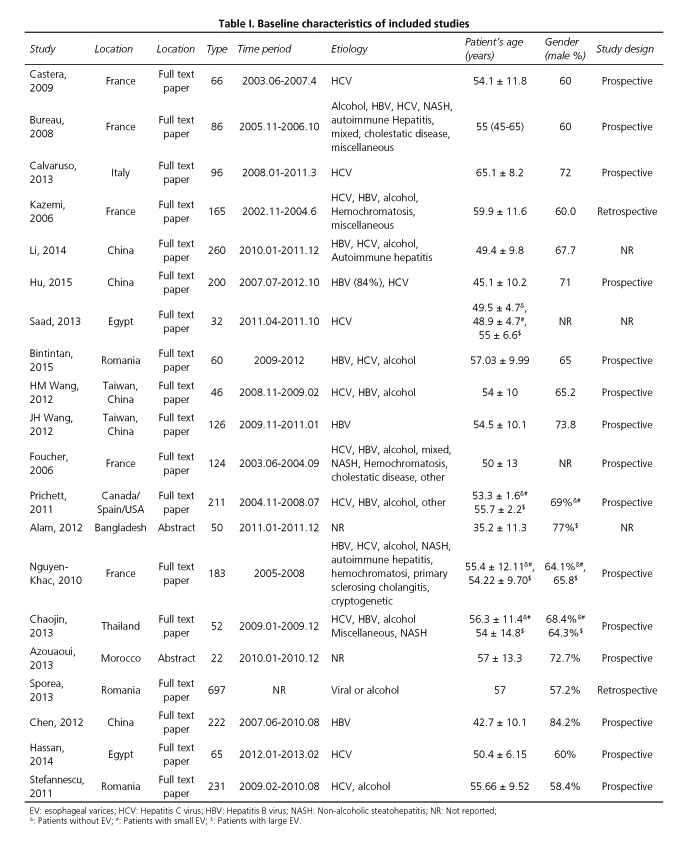
Table I outlines the baseline characteristics of the 20 studies included. Ten studies were performed in Western populations (6,8,9,14,18,21,23,26,28,30), while 7 studies were performed in Asian populations (15,16,19,20,22,24,27). The other 3 studies were performed in Africa (Egypt [17,29] and Morocco [25]). The earliest study started patient recruitment in June 2003 (23) and the latest study included patients in February 2013 (29). All patients were diagnosed with liver cirrhosis based on a liver biopsy or clinical judgment. The etiology of liver cirrhosis included virus, alcohol, non-alcoholic steatohepatitis (NASH), and autoimmune hepatitis. Seven studies only included patients with viral liver cirrhosis (8,9,16,17,20,22,29).
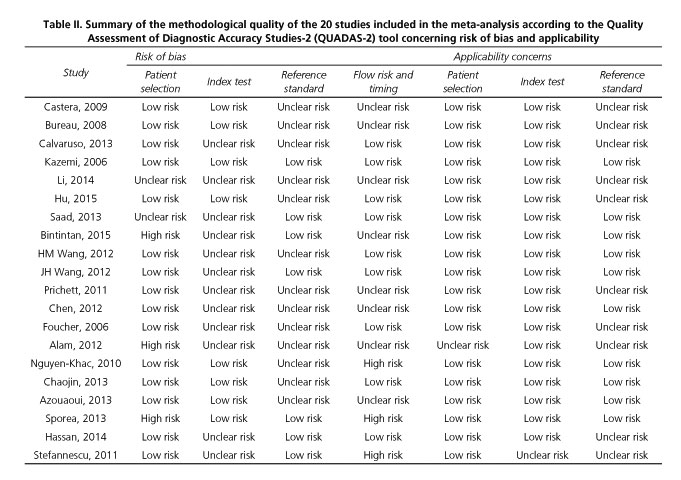
We used QUADAS-2 scale to assess the methodological quality of the 20 studies included (Table II). Ten studies did not provide sufficient information to be able to ascertain if the investigators that performed the endoscopy were unaware of the LS value, or vice versa, which put them at risk of review bias (8,9,14,15,18,21,23,24,29,30). The time interval between the performance of EGD and the performance of the TE was too long in 2 studies (28,30) and undefined in 8 studies (8,14,15,20-22,24,25), putting them at risk of disease progression bias.
Liver stiffness for detection of LEV
We evaluated whether the heterogeneity between each study was caused by a threshold effect. The Spearman correlation coefficient between the logit of sensitivity and the logit of (1-specificity) was computed. In our study, the Spearman correlation coefficient was 0.246 with a p-value of 0.296, which indicates the absence of any significant threshold effects.
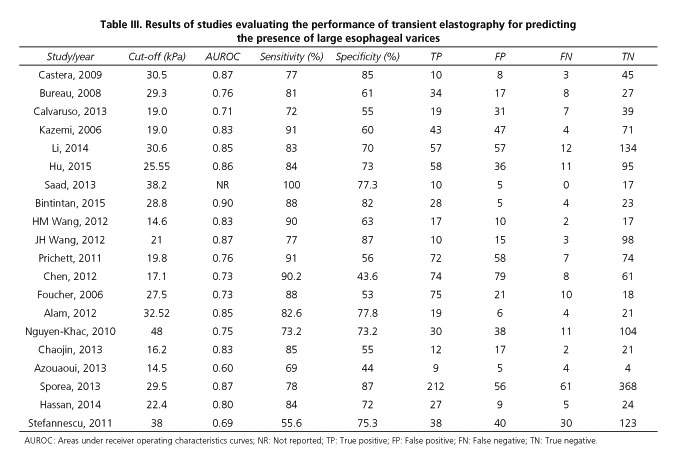
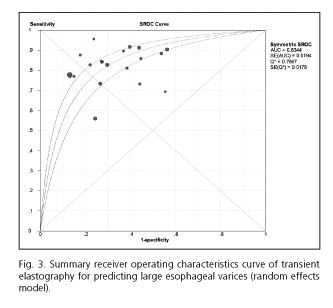
Table III summarized the results of the studies that assessed the performance of LS to detect the presence of LEV. The cut-off values ranged from 14.5 kPa to 48.0 kPa. The pooled sensitivity of the 20 studies included in the meta-analysis was 0.81 (95% CI, 0.79-0.84), whereas the pooled specificity was 0.71 (95% CI, 0.69-0.73). The PLR and NLR were 2.63 (95% CI, 2.15-3.23) and 0.27 (95% CI, 0.22-0.34), respectively. The DOR was 10.30 (95% CI, 7.33-14.47) and the AUROC was 0.83 (Figs. 2 and 3). We used a random effects model in our meta-analysis because of the significant heterogeneity we observed.
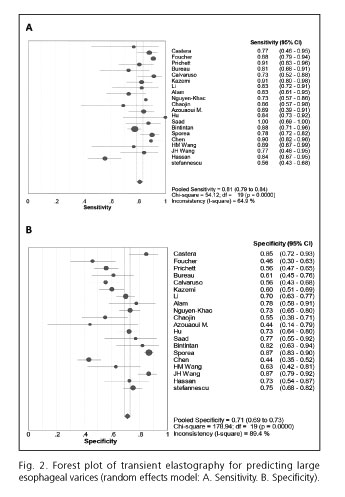
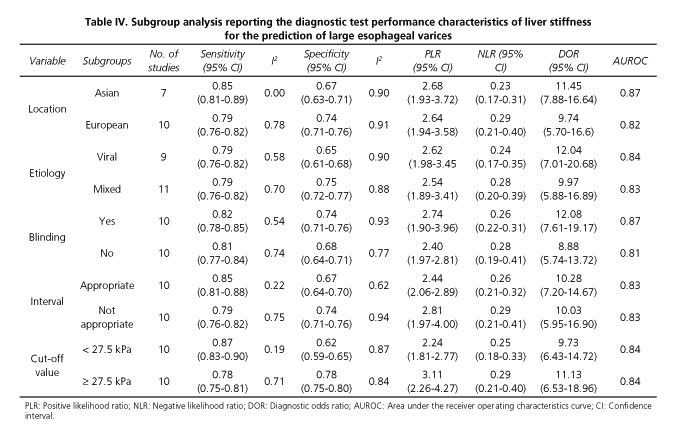
There was considerable heterogeneity across the different studies (I2 values of pooled sensitivity and specificity were 65% and 89%, respectively). In our study, the absence of significant threshold effects did not contribute to heterogeneity. Thus, several subgroup analyses were performed according to the characteristics of the study. In our subgroup analysis, the heterogeneity could be partially explained by the geographical origin, etiology, blinding, and appropriate interval of the study as well as the cut-off values of LS (Table IV). There was no significant difference in the diagnostic performance of LS based on the analysis of subgroups (pinteraction > 0.05).
Sensitivity analysis
The pooled sensitivity, specificity, PLR, NLR, DOR and AUROC changed slightly after the omission of any individual study, which indicated the stability of the outcome in our meta-analysis.
Publication bias
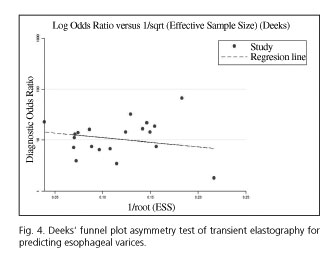
We performed the Deeks' funnel plot asymmetry test and there was no evidence of a significant publication bias (p = 0.313) (Fig. 4).
Discussion
Esophageal variceal bleeding is a major cause of death in cirrhotic patients. Screening with EGD is recommended, especially for LEV cases, which may require frequent inspections. Liver stiffness by transient elastography correlates with the presence of LEV, although the conclusions from available evidence were not always consistent. In this meta-analysis, we evaluated the performance of TE for the prediction of LEV and analyzed the source of heterogeneity between the retrieved research documents.
We included 20 individual studies with a total of 2,994 patients in our meta-analysis. The pooled sensitivity (81%) was good, while the specificity (71%) was moderate. Additionally, the overall test performance as evaluated by AUROC (83%) was also good, indicating a relatively high level of diagnostic accuracy for TE, which should be considered as a valuable tool for the prediction of LEV.
We observed a significant heterogeneity among studies. To analyze the origins of heterogeneity, we first evaluated the threshold effects. Despite the fact that the cut-off values of TE to predict LEV were different among studies, the p value for the Spearman correlation coefficient showed no significant threshold effects. Furthermore, subgroup analyses were conducted by stratifying original estimates based on the characteristics of the study.
The cut-off values of AUROC of the 20 studies included in our meta-analysis ranged from 14.5 kPa to 48 kPa. We attributed this variation to the diversity of etiology of the liver cirrhosis considered in the different studies, and the severity of cirrhosis in the recruited patients. Using the value of 27.5 kPa (the median cut-off value) as a line of demarcation between the cut-off values, we found no significant heterogeneity for sensitivity in the "< 27.5kPa subgroup", which means that heterogeneity could be partially explained by the different cut-off values.
Pritchett et al. (21) included 211 cirrhotic patients without ascites (Child A) from any underlying liver diseases in their study. They found that the optimal cut-off value for predicting large esophageal varices using transient elastography was disease-specific. We also conducted a subgroup analysis according to the etiology of cirrhosis and found that the heterogeneity of sensitivity and specificity in the "mixed" and "viral" subgroups were both significant, although the I2 value for specificity in "viral" subgroups was much lower. The etiology of cirrhosis might be one of the causes of heterogeneity, which has not been proved by the available sources.
Furthermore, the geographical origin of the included patients might also have some effects on the final results. A subgroup analysis was conducted in this regard. The I2 value of sensitivity in 7 studies that were carried out in Asian countries was 0.00, which indicates an absence of heterogeneity. Thus, the geographic origin of patients accounted for the observed heterogeneity in our meta-analysis.
The methodological quality of articles is of the utmost importance for the credibility of meta-analysis conclusions. Here, we used QUADAS-2 tool to assess the methodological quality of the included studies and found that the deficiency of blinding and appropriate time intervals were the main drawbacks in some studies. Furthermore, the lack of blinding during EGD performance may have caused misclassification in diagnosing and grading of varices (31). We therefore conducted a subgroup analysis related to the performance of blinding. In spite of the fact that the heterogeneity of sensitivity and specificity in two subgroups were both significant, the DOR increased by 1/3. Moreover, a subgroup analysis, related to whether an appropriate interval was included, revealed that the heterogeneity for sensitivity in the "appropriate interval" subgroup was not significant, and that the I2 value for specificity had declined by about 1/3. Both "blinding" and "time interval" subgroup analyses indicated that the methodological quality could be one of the causes of heterogeneity.
Although we identified some causes of heterogeneity via several subgroup analyses, we could not define a "standard" cut-off value, even for single liver cirrhosis etiology. The discrepancy in optimal cut-off values may hinder potential widespread use of TE in clinical practice. The moderate summary specificity may be an additional obstacle. In order to achieve a wider application, such technology needs to be improved and facilitated by more thorough research.
Pritchett et al. (21) reported a NPV of 98% for LEV using a cut-off value of 19.0 kPa in HCV patients, which allowed clinicians to identify when it was unnecessary for certain patients to undergo screening with EGD. In our meta-analysis, we included 5 studies (8,9,17,21,29) that assessed HCV-related cirrhotic patients. The NPVs of the corresponding optimal cut-off value in 5 studies were 98% (Pritchett [21], 19.8 kPa), 94% (Castera [8], 30.5 kPa), 84% (Calvaruso [9], 19.0 kPa), 100% (Saad [17], 38.2 kPa) and 72% (Hassan [29], 22.4 kPa), respectively. The pooled NPV estimate of these 5 studies was 92%. Although the NPV was relatively high, further studies will be required in the future in order to set the optimal or "standard" exclusion value of TE in HCV-related cirrhotic patients.
Colecchia et al. (32) defined two cut-off values for predicting the presence of EV, one related to the highest PLR to rule in (25.0 kPa with a sensitivity of 56.6% and a specificity of 97.9%) and the other related to the lowest NLR to rule out (16.4 kPa with a sensitivity of 96.2% and a specificity of 59.6%) the target clinical feature. This may be useful for clinical practice as with this method it is possible to identify patients with relatively low and relatively high risk of LEV. Nevertheless, the remaining "average" population would still have to accept EGD. More studies will be required to set reasonable cut-off values for the screening of specific "low risk" or "high risk" patients in the future.
Augustin et al. (33) assessed a sequential screening-diagnostic strategy based on the joint use of routine clinical data (platelet count, abdominal ultrasonography) and TE in order to identify patients with EV. They concluded that patients with a low liver stiffness value (< 13.6 kPa) and normal platelets/ultrasonography were less likely to be exposed to the risk of EV, and, therefore, they could be exempt from endoscopy examination. This indicates that the diagnostic flow diagram for EV can be optimized in order to be more accurate and practical in the clinic. In addition, this flow diagram might act as a good approach to balance costs and benefits.
We should take into account some limitations of this meta-analysis: a) due to the fact that the TE cut-off values to detect LEV in each study were different, it is difficult to determine an accurate diagnostic threshold, which may restrict the clinical application; b) we observed significant heterogeneity and how it is influenced by many factors, such as the experience of operators, patient characteristics, appropriateness of the time interval, etiology of liver disease, etc., and some of these factors are difficult to avoid; and c) liver fibrosis can result in portal hypertension and esophageal varices, but the formation of the latter is influenced by portal hemodynamics, collateral circulation, and so on. As an indirect method to predict LS (34), the results of TE should be explained according to clinical practice and patients characteristics.
In conclusion, our meta-analysis indicates that TE could serve as a valuable non-invasive screening tool for the prediction of LEV. In spite of the many advantages that it has shown over EGD, the research has not been completed in this regard. Further studies on a "standard" cut-off value for single etiology and specific geographies will be required in the near future and the methodological quality of studies should be strengthened. Meanwhile, more reasonable approaches or diagnostic flow diagrams to specifically screen for "low risk" or "high risk" patients will also be needed if we want to improve the operability of the technology.
References
1. Garcia-Tsao G, Sanyal AJ, Grace ND, et al. Practice Guidelines Committee of the American Association for the Study of Liver D, Practice Parameters Committee of the American College of G. Prevention and management of gastroesophageal varices and variceal hemorrhage in cirrhosis. Hepatology 2007;46(3):922-38. DOI: 10.1002/hep.21907. [ Links ]
2. Merkel C, Zoli M, Siringo S, et al. Prognostic indicators of risk for first variceal bleeding in cirrhosis: A multicenter study in 711 patients to validate and improve the North Italian Endoscopic Club (NIEC) index. The American Journal of Gastroenterology 2000;95(10):2915-20. DOI: 10.1111/j.1572-0241.2000.03204.x. [ Links ]
3. De Franchis R, Eisen GM, Laine L, et al. Esophageal capsule endoscopy for screening and surveillance of esophageal varices in patients with portal hypertension. Hepatology 2008;47(5):1595-603. DOI: 10.1002/hep.22227. [ Links ]
4. Perri RE, Chiorean MV, Fidler JL, et al. A prospective evaluation of computerized tomographic (CT) scanning as a screening modality for esophageal varices. Hepatology 2008;47(5):1587-94. DOI: 10.1002/hep.22219. [ Links ]
5. Thabut D, Trabut JB, Massard J, et al. Non-invasive diagnosis of large oesophageal varices with FibroTest in patients with cirrhosis: A preliminary retrospective study. Liver International: Official Journal of the International Association for the Study of the Liver 2006;26(3):271-8. DOI: 10.1111/j.1478-3231.2005.01227.x. [ Links ]
6. Kazemi F, Kettaneh A, N'Kontchou G, et al. Liver stiffness measurement selects patients with cirrhosis at risk of bearing large oesophageal varices. Journal of Hepatology 2006;45(2):230-5. DOI: 10.1016/j.jhep.2006.04.006. [ Links ]
7. Friedrich-Rust M, Ong MF, Martens S, et al. Performance of transient elastography for the staging of liver fibrosis: A meta-analysis. Gastroenterology 2008;134(4):960-74. DOI: 10.1053/j.gastro.2008.01.034. [ Links ]
8. Castera L, Le Bail B, Roudot-Thoraval F, et al. Early detection in routine clinical practice of cirrhosis and oesophageal varices in chronic hepatitis C: Comparison of transient elastography (FibroScan) with standard laboratory tests and non-invasive scores. Journal of Hepatology 2009;50(1):59-68. DOI: 10.1016/j.jhep.2008.08.018. [ Links ]
9. Calvaruso V, Bronte F, Conte E, et al. Modified spleen stiffness measurement by transient elastography is associated with presence of large oesophageal varices in patients with compensated hepatitis C virus cirrhosis. Journal of Viral Hepatitis 2013;20(12):867-74. DOI: 10.1111/jvh.12114. [ Links ]
10. North Italian Endoscopic Club for the Study and Treatment of Esophageal Varices. Prediction of the first variceal hemorrhage in patients with cirrhosis of the liver and esophageal varices. A prospective multicenter study. N Engl J Med 1988;319(15):983-9. [ Links ]
11. Whiting PF, Rutjes AWS, Westwood ME, et al. QUADAS-2: A revised tool for the quality assessment of diagnostic accuracy studies. Ann Intern Med 2011;155:529-36. DOI: 10.7326/0003-4819-155-8-201110180-00009. [ Links ]
12. Higgins JPT, Thompson SG, Deeks JJ, et al. Measuring inconsistency in meta-analyses. BMJ 2003;327:557-60. DOI: 10.1136/bmj.327.7414.557. [ Links ]
13. Deeks JJ, Macaskill P, Irwig L. The performance of tests of publication bias and other sample size effects in systematic reviews of diagnostic test accuracy was assessed. Journal of Clinical Epidemiology 2005;58(9):882-93. DOI: 10.1016/j.jclinepi.2005.01.016. [ Links ]
14. Bureau C, Metivier S, Peron JM, et al. Transient elastography accurately predicts presence of significant portal hypertension in patients with chronic liver disease. Alimentary Pharmacology & Therapeutics 2008;27(12):1261-8. DOI: 10.1111/j.1365-2036.2008.03701.x. [ Links ]
15. Li F, Yan T, Shao Q, et al. Clinical study of FibroScan efficiency for diagnosing size of oesophageal variees in liver cirrhosis patients. Zhonghua Gan Zang Bing Za Zhi 2014;22(8):600-3. [ Links ]
16. Hu Z, Li Y, Li C, et al. Using ultrasonic transient elastometry (FibroScan) to predict esophageal varices in patients with viral liver cirrhosis. Ultrasound in Medicine & Biology 2015. DOI: 10.1016/j.ultrasmedbio.2015.02.005. [ Links ]
17. Saad Y, Said M, Idris MO, et al. Liver stiffness measurement by fibroscan predicts the presence and size of esophageal varices in Egyptian patients with HCV related liver cirrhosis. Journal of Clinical and Diagnostic Research (JCDR) 2013;7(10):2253-7. DOI: 10.7860/JCDR/2013/6026.3484. [ Links ]
18. Bintintan A, Chira RI, Bintintan VV, et al. Value of hepatic elastography and Doppler indexes for predictions of esophageal varices in liver cirrhosis. Med Ultrason 2015;17(1):5-11. [ Links ]
19. Wang HM, Lo GH, Chen WC, et al. Efficacy of transient elastography in screening for large esophageal varices in patients with suspicious or proven liver cirrhosis. Journal of Digestive Diseases 2012;13(8):430-8. DOI: 10.1111/j.1751-2980.2012.00603.x. [ Links ]
20. Wang JH, Chuah SK, Lu SN, et al. Transient elastography and simple blood markers in the diagnosis of esophageal varices for compensated patients with hepatitis B virus-related cirrhosis. Journal of Gastroenterology and Hepatology 2012;27(7):1213-8. DOI: 10.1111/j.1440-1746.2012.07132.x. [ Links ]
21. Pritchett S, Cardenas A, Manning D, et al. The optimal cut-off for predicting large oesophageal varices using transient elastography is disease specific. Journal of Viral Hepatitis 2011;18(4):e75-80. DOI: 10.1111/j.1365-2893.2010.01375.x. [ Links ]
22. Chen YP, Zhang Q, Dai L, et al. Is transient elastography valuable for high-risk esophageal varices prediction in patients with hepatitis-B-related cirrhosis? Journal of Gastroenterology and Hepatology 2012;27(3):533-9. DOI: 10.1111/j.1440-1746.2011.06889.x. [ Links ]
23. Foucher J, Chanteloup E, Vergniol J, et al. Diagnosis of cirrhosis by transient elastography (FibroScan): A prospective study. Gut 2006;55(3):403-8. DOI: 10.1136/gut.2005.069153. [ Links ]
24. Alam S, Moben A, Alam A. Prediction of oesophageal varices in cirrhotic patients by measuring liver stiffness with fibroscan. Hepatology International 2012;6:1(297-). [ Links ]
25. Azouaoui M, Benyachou B, Mellouki I, et al. Interest of the liver elastography in the detection and staging of esophageal varices in cirrhotic patients. Hepatology International 2013;7(Suppl 1):S542. [ Links ]
26. Nguyen-Khac E, Saint-Leger P, Tramier B, et al. Noninvasive diagnosis of large esophageal varices by Fibroscan: Strong influence of the cirrhosis etiology. Alcoholism, Clinical and Experimental Research 2010;34(7):1146-53. DOI: 10.1111/j.1530-0277.2010.01191.x. [ Links ]
27. Chaojin T, Piratvisuth T. The prediction values of transient elastography for clinically significant esophageal varices in patients with liver cirrhosis. Thai J Gastroenterol 2013;14(2):66-70. [ Links ]
28. Sporea I. Are different cut-off values of liver stiffness assessed by transient elastography according to the etiology of liver cirrhosis for predicting significant esophageal varices? Medical Ultrasonography 2013;15(2):111-5. DOI: 10.11152/mu.2013.2066.152.is1ir2. [ Links ]
29. Hassan EM, Omran DA, El Beshlawey ML, et al. Can transient elastography, Fib-4, Forns Index, and Lok Score predict esophageal varices in HCV-related cirrhotic patients? Gastroenterología y Hepatología 2014;37(2):58-65. DOI: 10.1016/j.gastrohep.2013.09.008. [ Links ]
30. Stefanescu H, Grigorescu M, Lupsor M, et al. A new and simple algorithm for the noninvasive assessment of esophageal varices in cirrhotic patients using serum fibrosis markers and transient elastography. J Gastrointestin Liver Dis 2011;20(1):57-64. [ Links ]
31. Bendtsen F, Skovgaard LT, Sørensen TI, et al. Agreement among multiple observers on endoscopic diagnosis of esophageal varices before bleeding. Hepatology 1990;11(3):341-7. DOI: 10.1002/hep.1840110302. [ Links ]
32. Colecchia A, Montrone L, Scaioli E, et al. Measurement of spleen stiffness to evaluate portal hypertension and the presence of esophageal varices in patients with HCV-related cirrhosis. Gastroenterology 2012;143(3):646-54. DOI: 10.1053/j.gastro.2012.05.035. [ Links ]
33. Augustin S, Millan L, Gonzalez A, et al. Detection of early portal hypertension with routine data and liver stiffness in patients with asymptomatic liver disease: A prospective study. Journal of Hepatology 2014;60(3):561-9. DOI: 10.1016/j.jhep.2013.10.027. [ Links ]
34. Ganne-Carrié N, Ziol M, De Ledinghen V, et al. Accuracy of liver stiffness measurement for the diagnosis of cirrhosis in patients with chronic liver diseases. Hepatology 2006;44(6):1511-7. DOI: 10.1002/hep.21420. [ Links ]
![]() Correspondence:
Correspondence:
Lei Wang.
Department of Infectious Diseases and Hepatology.
The Second Hospital of Shandong University.
247 Beiyuan Road.
250033 Jinan, China
e-mail: wlsdeygbk@163.com
Received: 28-04-2016
Accepted: 04-05-2016
