


Meu SciELO
 Serviços customizados
Serviços Personalizados
Journal
Artigo
 texto em
  Inglês (pdf)
 Artigo em XML
 Referências do artigo
 Enviar este artigo por email
Indicadores
-
 Citado por SciELO
 -
 Acessos
Links relacionados
-
 Citado por Google
 -
 Similares em
SciELO
Similares em
SciELO -
 Similares em Google
Compartilhar

 Permalink
Revista Española de Enfermedades Digestivas
versão impressa ISSN 1130-0108
Rev. esp. enferm. dig. vol.110 no.12 Madrid Dez. 2018
https://dx.doi.org/10.17235/reed.2018.5473/2018
ORIGINAL PAPERS
Graft survival after liver transplantation: an approach to a new Spanish risk index
1Coordinación de Trasplantes. Hospital Universitario Lozano Blesa. Zaragoza, Spain
2Unidad de Cuidados Intensivos. Hospital Universitario Lozano Blesa. Zaragoza, Spain
3Departamentos de Medicina. Universidad de Zaragoza. Zaragoza, Spain
4Instituto de Investigación Sanitaria de Aragón (IIS Aragón). Zaragoza, Spain
5Departamento de Gastroenterología. Unidad de Hígado. Hospital Universitario Lozano Blesa. Zaragoza, Spain
6Departamento de Cirugía. Unidad de Cirugía Hepática. Hospital Universitario Lozano Blesa. Zaragoza, Spain
7Departamentos de Cirugía. Universidad de Zaragoza. Zaragoza, Spain
INTRODUCTION
Graft outcome is one of the factors that most conditions the subsequent evolution of patients undergoing a liver transplantation. This risk is carefully assessed by transplant teams and depends on donor-related variables, even more so when organ donors are managed using expanded criteria. Furthermore, variables associated with the donation-transplant process, which may differ from one program to the next, are also assessed. Finally, recipient-related variables are also studied, even more so when previously defined transplant indication limits are extended for new recipients. Therefore, indicators have been established to assess both liver graft and recipient survival post-transplantation. These include: MELD and CTP 1, NDDF 2, SOLD 3, DRI 4, SOFT 5, D-MELD 6, BAR 7, ET-DRI 8, NN-CCR and NN-MS 9, NNtop15 10, and DLI 11 (Supplementary Table 1). However, significant differences exist between donation-transplantation programs in different countries and organizations, both with regard to donor characteristics and transplant outcome (Supplementary Table 2). These differences are most remarkable for donor age and ethnicity, number of brain-dead donors (DBDs) vs cardiac-dead donors (DCDs), causes of brain death and liver bipartition, among others. All the above mean that donors and recipients are quite different between countries and/or regions. Hence a region/site specific scoring system would be more appropriate for liver graft acceptance and allocation.
Supplementary Table 1 Survival indicators in liver transplantation
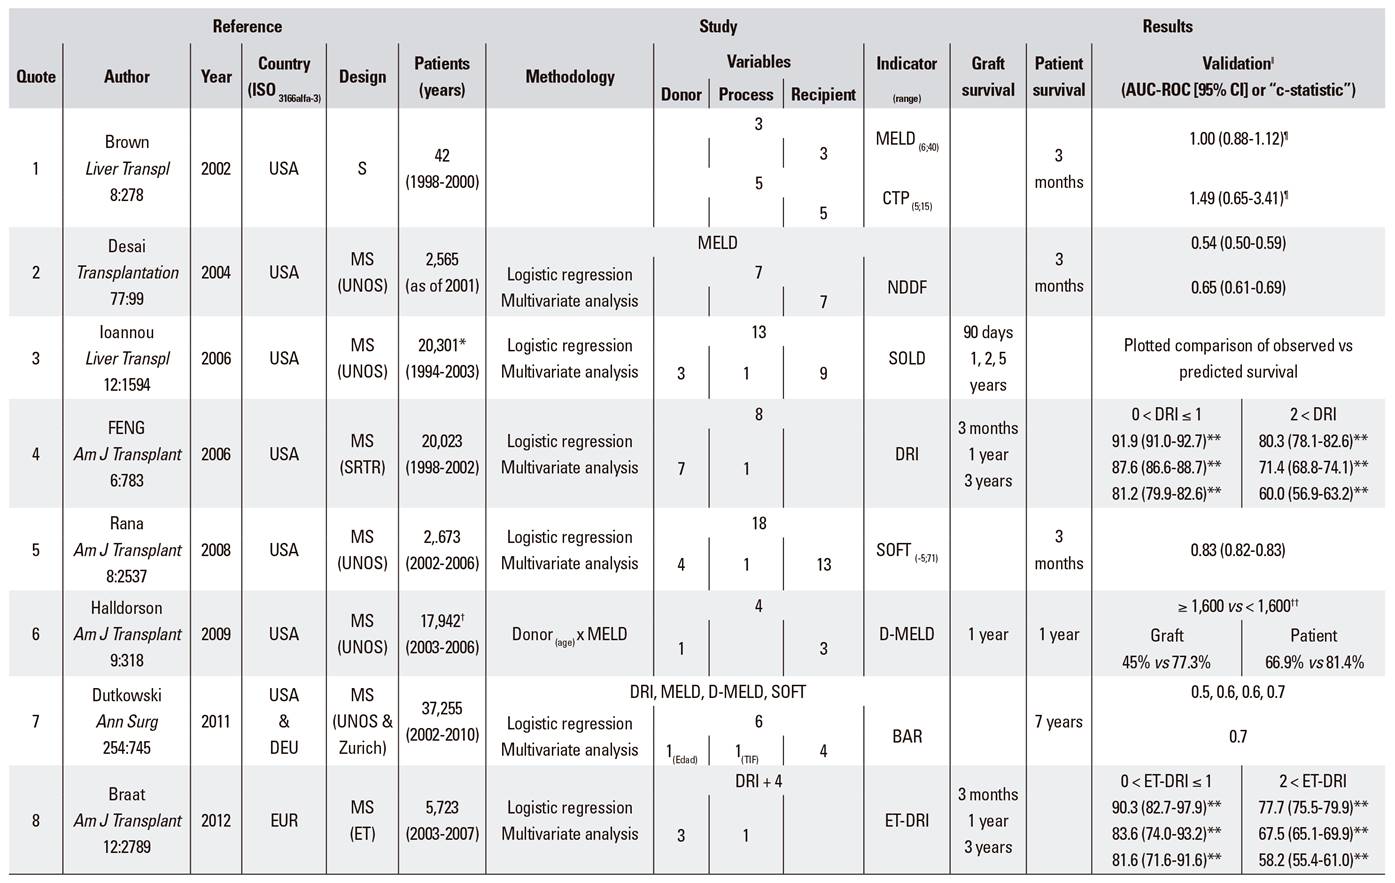
Reference: S: single-center study; MS: multicenter study; UNOS: United Network for Organ Sharing; SRTR: Scientific Registry of Transplants Recipients ET: Eurotransplant; UKTR: United Kingdom Transplant Registry. *Combined transplants and re-transplants excluded. †Re-transplants, acute liver failure, and donation after cardiac death excluded. ‡Split, living donor, and combined transplants excluded. §Recipients < 16 years, heterotopic or auxiliary liver and blood incompatibility excluded.
Study: MELD: model for end-stage liver disease; CTP: Child-Turcotte-Pugh score; NNDF: newly derived discrimination function; SOLD: score of liver donor; DRI: donor risk index; SOFT: survival outcome following liver transplantation; D-MELD: donor-MELD; BAR: balance of risk score; ET-DRI: Eurotransplant donor risk index; NN-CCR: neural network-correct classification rate; NN-MS: neural network-minimum sensitivity; DLI: donor liver index.
Results: ǁExcept when indicated, AUC-ROC (95% CI): area under the ROC curve (95% confidence interval); ¶Linear regression OR (95% CI); **Adjusted survival; ††Kaplan-Meier.
Supplementary Table 2 Activity at OPTN, ET, and ON during 2016*

DBD: donor brain dead; DCD: donor cardiac dead. Data in absolute value (%). *Based on: OPTN, Organ Procurement and Transplantation Network. Available from: https://optn.transplant.hrsa.gov/data/; ET : Eurotransplant. Available from: http://statistics.eurotransplant.org/; ONT: Organización Nacional de Trasplantes. Available from: http://www.ont.es/infesp/Paginas/Memorias.aspx; Newsletter Transplant 2017. Available from: http://www.ont.es/publicaciones/Documents/. †OPTN2011-2014: mean and 95% confidence interval; ONT2016: median and interquartile range. ‡Data < or ≥ 60 years.
The Registro Español de Trasplante Hepático (RETH) records the experience with liver transplantation in Spain, including systematic data, for all liver transplants.
Therefore, it is a tool that can be used to gain insight into our own experience. The goal of the study was to describe a new liver graft risk indicator based on the RETH results. The indicator combined donor, process and recipient related factors to facilitate decision making on organ acceptance and allocation to specific patients. Attempts were also made to validate and compare this indicator with the American DRI and European ET-DRI in our setting.
MATERIAL AND METHOD
Data sources
The description of the new indicator was based on data collected from the RETH annual report 12. This report includes donor characteristics and outcome for all liver transplants performed in Spain. Specifically, it contains systematic data of 22,846 liver transplants carried out at 24 transplant centers from 1984 to 2016. This is a public report that is available online. Data from 600 adult (above 15 years of age) liver transplants performed consecutively in our center were used for the validation of the aforementioned indicators. The data were collected prospectively and the characteristics are described below. The study was compliant with the Spanish Organic Law 15/1999 for the protection of personal data. It was also approved by the Aragon ethics committee, CodeCEICA PI18/0097, on April 24th 2018.
GRI description
The study methodology for the design and validation of the GRI is summarized in Table 1:
The RETH report includes a Cox proportional hazards regression analysis of the factors associated with overall graft survival. Results are expressed as CoxPH (RR) values with their corresponding 95% confidence intervals (95% CI) (Table 1A).
Based on the Cox regression equation [ln (λt) = a + b1x1 + b2x2 + ... + bnxn], an indicator may be defined as an exponential (inverse logarithm) of a linear risk score. Three indicators were defined by grouping together variables with statistically significant differences (SSDs) according to the multivariate analysis: donor risk index (dRI), recipient risk index (rRI) and graft risk index (GRI), where GRI = dRI x rRI (Table 1B).
The new indicator (GRI) was validated and compared to the American DRI and European ET-DRI in our series (Table 1C).
Two events were considered for indicator assessment:
Event 1. Graft survival (GS): defined as the time elapsed from the transplant to either re-transplantation or recipient death from any cause, whichever comes first.
Event 2. Failure-free graft survival (ffGS): defined as the time elapsed from the transplant date to the either re-transplantation or recipient death with an associated chronic graft dysfunction, whichever comes first.
Table 1 GRI description: variables included (1A), formula (1B) and examples in comparison with DRI and ET-DRI (1C)
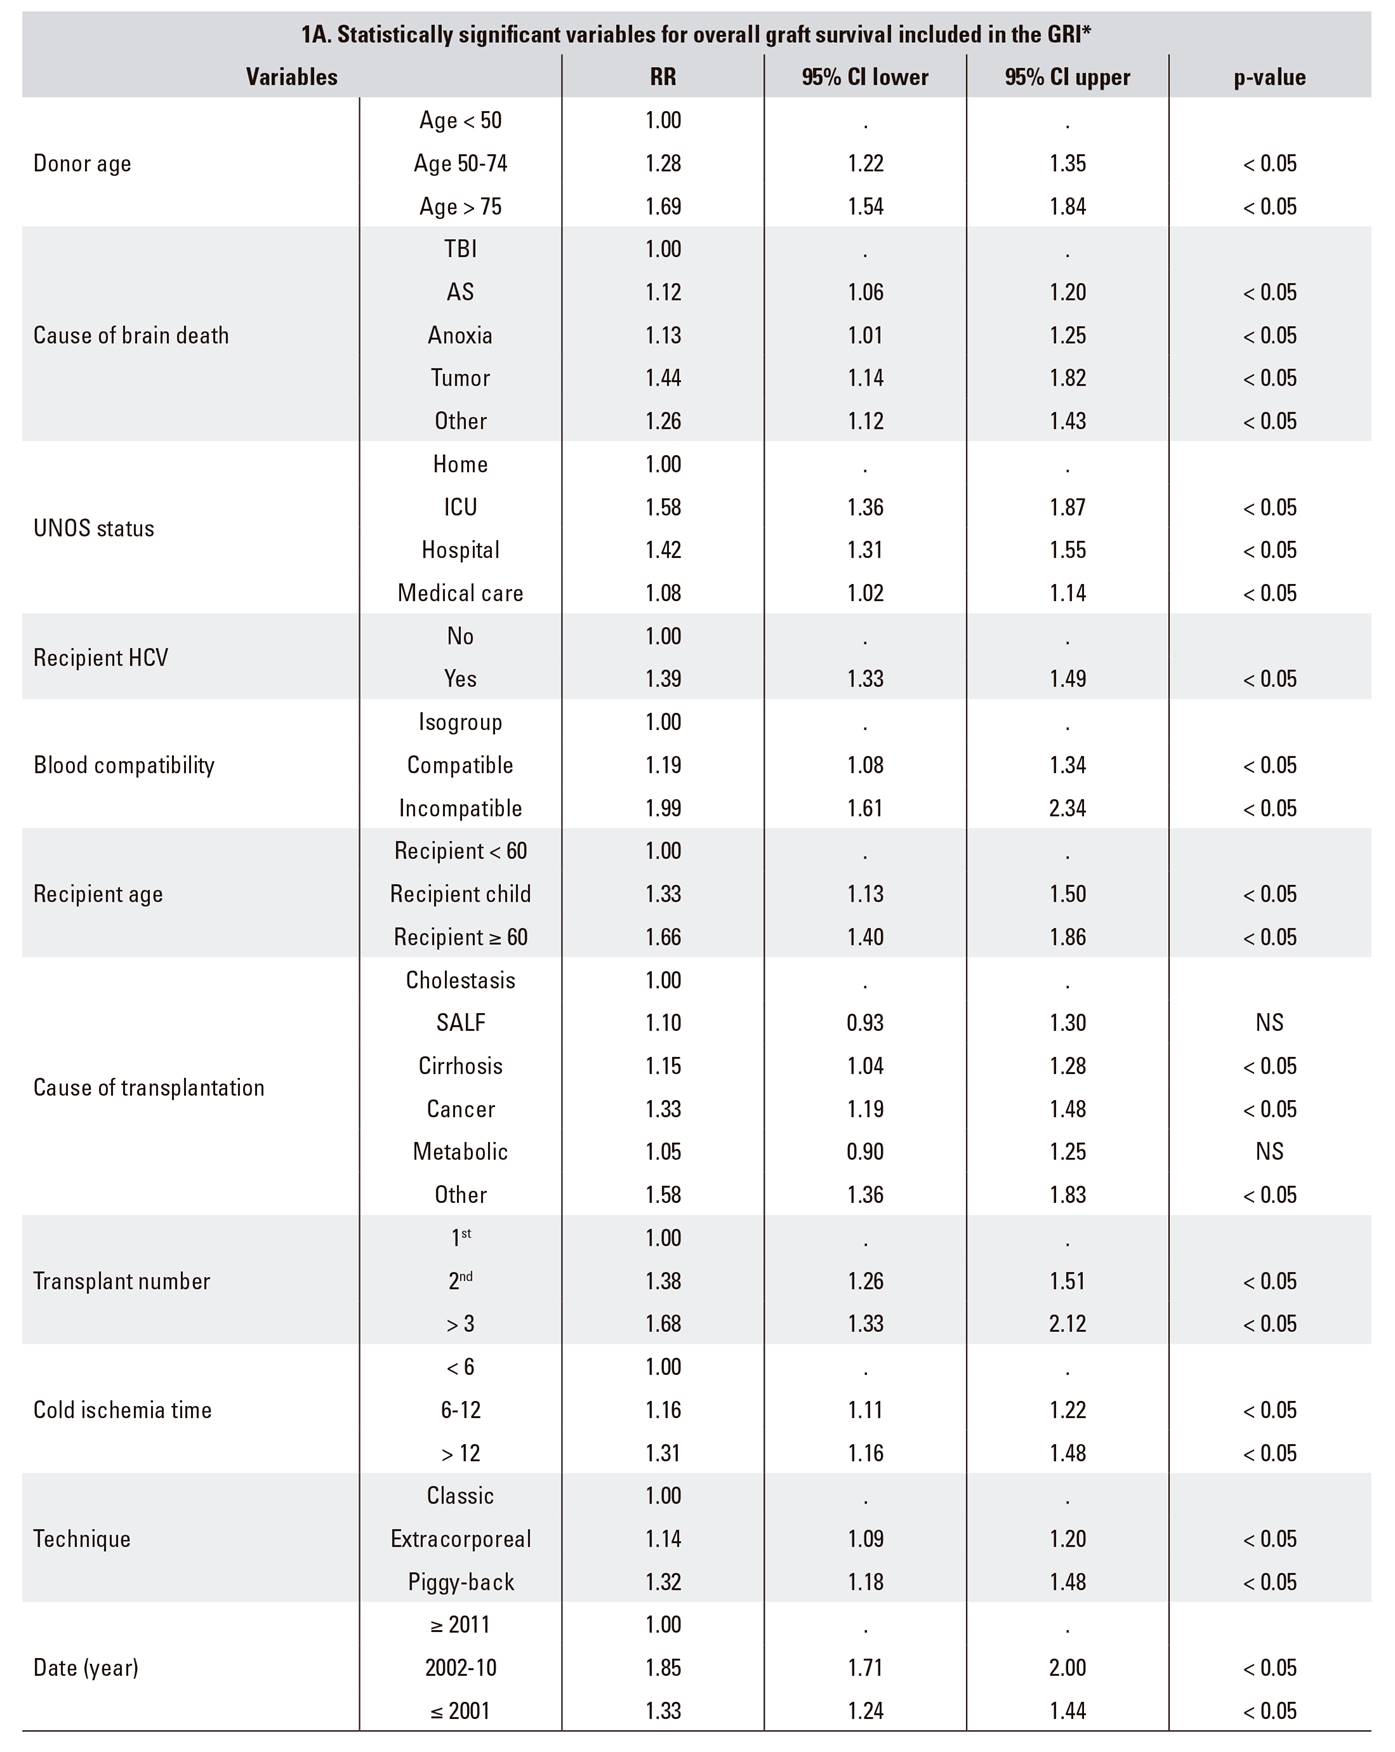
*RETH Results Report (Memoria de Resultados del RETH), available from: http://www.sethepatico.org. RR: risk ratio; CI: confidence interval; NS: not significant; AS: acute stroke; SALF: severe acute liver failure; TBI: traumatic brain injury; ICU: intensive care unit; UNOS: United Network for Organ Sharing; HCV: hepatitis C virus.
Example of reference in boldface (Risk 1); variables modified from reference in italics. In DRI and ET-DRI calculations variables not included in the GRI were considered to have a value of 0 (risk 1).
GRI logistic function
The Hosmer-Lemeshow goodness of fit test (p > 0.05) was used to assess model fit. Values were subsequently obtained for the logistic regression curve: regression coefficients (β0 y β1) with their corresponding standard errors, Wald statistic and odds ratio (OR) = e(β1), with the confidence interval.
Indicator comparisons: values, graft survival and hazard ratio by stratification
Graft survival curves were calculated via indicator-related risk groups using Kaplan-Meier estimations. The HR for each risk group was estimated versus a standard group using a Cox regression model.
ROC curves
DR, ET-DRI and GRI accuracy to predict graft survival was assessed using the area under the curve in a ROC curve analysis, where 1 represents a perfect discrimination and 0.5 represents a discrimination that is not above the level of chance.
A Wald p-value < 0.05 was considered as significant. All analyses were carried out using the IBM(r) SPSS(r) Statistics, version 22.0 software ((c)Copyright IBM Corporation 1989 to 2013, Chicago, IL, USA).
RESULTS
DRI, RRI and GRI description and calculation
The indicators DRI, RRI, and GRI were obtained based on the data collected from the Cox logistic regression analysis of overall graft survival in the RETH (Table 1). Table 1 includes an example of GRI with a score of 1 and an example of maximum risk (GRI: 81.045) with their corresponding DRI and ET-DRI scores.
Validation series
Data from 600 liver transplants performed in our center were used for the validation of the new indicators, DRI and ET-DRI. The data with regard to the validation series are listed in Table 2.
Table 2 Principal cohort characteristics

HCV: hepatitis C virus; HIV: human immunodeficiency virus; MELD: model for end-stage liver disease; UNOS: United Network for Organ Sharing; HCC: hepatocellular carcinoma; HBV: hepatitis B virus. *Quantitative variables are expressed as: mean ± standard deviation, median (interquartile range), and range. Qualitative variables are expressed as n (%).
AST: aspartate aminotransferase; ALT: alanine aminotransferase; GGT: gamma glutamyl transpeptidase; HBcAb: hepatitis B virus core antibody; CMV: cytomegalovirus; UW: University of Wisconsin. Location: local, in the city; regional, < 200 km; national, > 200 km. *Quantitative variables are expressed as: mean ± standard deviation, median (interquartile range), and range. Qualitative variables are expressed as n (%).
Clinical outcome variables categorized as in the RETH. DDG: died with dysfunctioning graft; DFG: died with a functioning graft. *Quantitative variables are expressed as: mean ± standard deviation, median (interquartile range), and range. Qualitative variables are expressed as n (%). Kaplan-Meier: mean (95% confidence interval). †Tweny-one patients died while on the re-transplantation waiting list.
GRI logistic function
A Hosmer-Lemeshow analysis showed that the observed probabilities were similar to those expected for the three indicators: DRI (p = 0.883), ET-DRI (p = 0.317) and GRI (p = 0.210). Figure 1 shows the logistic equation curve and the values observed by GRI interval. A GRI of 1 represents a graft loss likelihood of 23.25%; each point increase in the GRI multiplies this graft loss probability by 1.33 (95% CI: 1.24-1.44).

Indicator comparisons: values, graft survival and hazard ratios by stratification
No statistically significant differences in the mean DRI were seen between groups with and without graft survival: 1.54 (95% CI: 1.50-1.58) vs 1.60 (95% CI: 1.55-1.65), respectively. Moderate statistically significant differences were obtained for ET-DRI: 1.51 (95% CI: 1.47-1.55) vs 1.60 (95% CI: 1.56-1.63), p < 0.05, respectively.
Finally, GRI showed highly statistically significant differences between the groups: 4.27 (95% CI: 4.06-4.49) vs 6.46 (95% CI: 5.98-6.93), p < 0.0001.
Differences in graft survival between higher and lower indices are clearly seen for all three indicators. However, GRI had the best discriminating power for survival among intermediate groups of the three indicators. Furthermore, survival diminished progressively down to a GRI ≥ 9, which represents a 1-year graft survival rate of 47.5% (95% CI: 34.6-59.3) and there were highly significant differences versus the standard group (HR: 4.03; 95% CI: 2.63-6.19; p < 0.0001) (Table 3).

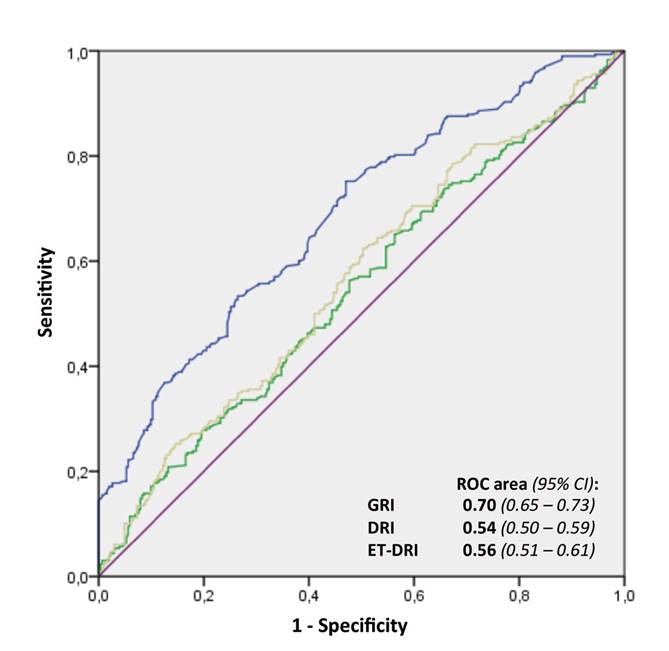
ROC curves
The area under the curve (AUC) according to the ROC analysis was 0.54 (95% CI: 0.50-0.59) for DRI and 0.56 (95% CI: 0.51-0.61) for ET-DRI. Thus, their ability to predict graft survival was not above the level of chance. The AUC for GRI was 0.70 (95% CI: 0.65-0.73) with highly significant differences when compared to the other two indices (DeLong test, p < 0.0001) (Fig. 2). With regard to the power of GRI to predict transplant futility, the fact that a GRI score ≥ 10 always forecasted graft loss should be highlighted. The specificity was 100%, the sensitivity was 14.4%, the positive predictive value was 100% and the negative predictive value was 54.2%.
All the results obtained for event 2 (ffGS) are superimposable on those described for event 1 (GS) (unpublished data).
DISCUSSION
Classic indicators to assess cirrhosis prognosis (Child-Pugh) or transplant waiting list mortality (MELD) are not suitable to predict post-transplant patient survival 1,2. The latest indicators based on neural networks are complex, rely on limited experience, are scarcely generalizable and are also difficult to extrapolate to the daily clinical practice 9,10. Finally, external validations for some indicators (DRI, MELD, D-MELD and SOFT [7], DRI and ET-DRI [13], DRI and SOFT [10]) do not confirm their validity when applied to scenarios different to their principal intended use, as is the case in our study. The latter point likely results from large differences between countries and programs, in terms of donor population and donation-transplantation process characteristics and not so much with recipient characteristics.
Donor-related variables may be linked to specific graft features and general donor characteristics. Most indicators described thus far share a number of variables including age, cause of brain death, etc. Furthermore, there are some variables where the justification or relation to graft or patient survival does not seem to be based on clear scientific grounds, such as smoking, height, etc. However, even though steatosis is a primary determinant of post-transplant liver function 14 (particularly within the first year), none of the established indicators include this variable, either directly or indirectly. Kulik et al. 15 highlighted in a recent study that allografts with a fatty liver are a significant cause of primary graft failure and an excessive mortality after transplantation. Traditionally, high donor sodium levels have been associated with graft failure and primary non-function (PNF) 16. A study by Sirivatanauksorn et al. 17 showed that high donor sodium was associated with marginal liver grafts, but only ALT > 65 IU/l was associated with higher PNF rates. More recently, Al-Freah et al. 18 did not find any donor variables that were associated with PNF, except for donor-recipient ABO mismatch. Finally, these indicators should contemplate specific donor variables. Some of these are considered on an international level under the expanded criteria donor concept. These are also included in Spain in the non-standard risk donor (Donantes de Riesgo no Estándar [DRNE]) category and may include drug abuse, intoxications, tumors, infections, hepatitis B or C, age above 65 years, etc.
With regard to recipient-related variables, allocating a specific organ to its most appropriate recipient is a difficult decision, particularly in certain situations. We agree with Feng et al. 4 that grafts are ideally a highly homogeneous group and thus an optimal organ may be allocated to any person, whereas non-ideal grafts make up a highly heterogeneous group with a high risk spectrum. In the latter case, allocating a suboptimal organ to a high-MELD recipient 19,20 with certain conditions 21 or with a higher waiting-list mortality rate 22 gambles with the risks of post-transplant survival versus wait-list mortality.
Finally, with regard to variables related with the donation-transplantation process, the most established indicators include cold ischemic time (CIT) in their design. CIT may in turn be dependent on donor location, available transportation means, surgeon skill and unforeseeable events associated with the surgical technique, etc. A good indicator should already be available at the time that an organ is offered and should not include variables that measure equal or similar factors (e.g., donor location or CIT). Perhaps decision making in medicine in the future, particularly in transplant medicine, will be based on complex artificial neural networks 23. The analysis of countless variables (big data) and numerous interdependent networks means that we will learn, decide and maybe even get it right or wrong. In the meantime, we still believe that a solution to the donor-recipient matching problem may be facilitated by these types of tools and it will not entail expunging the human component of awareness, conscience and sensitivity.
The present study has a number of limitations: the above indicator is based on a non-predictive analysis of a national registry with over 22,000 transplants; it was validated with a limited series in only one center; the actual weight of certain variables in graft survival will have to be refined and updated (HCV is the most significant instance) and these indices are intended to simplify complex situations dependent on multiple factors, which often reduces quantitative variables to categorical variables.
To conclude, our study highlights that neither DRI nor ET-DRI seem to adequately predict graft risks in our setting. A national GRI might be a very useful tool to categorize graft-recipient matching. Hence, a national study is needed to regularly streamline and update this indicator and to provide a wider validation thereof.
ACKNOWLEDGEMENTS
The views expressed in this paper are those of the authors and do not represent the position of the Registro Español de Trasplante Hepático (RETH).
The authors wish to express their appreciation to all the persons responsible for the RETH.
REFERENCES
1. Brown RS, Kumar KS, Russo MW, et al. Model for end-stage liver disease and Child-Turcotte-Pugh score as predictors of pretransplantation disease severity, post-transplantation outcome, and resource utilization in united network for organ sharing status 2A patients. Liver Transpl 2002;8:278-84. DOI: 10.1053/jlts.2002.31340 [ Links ]
2. Desai NM, Mange KC, Crawford MD, et al. Predicting outcome after liver transplantation: utility of the model for end-stage liver disease and a newly derived discrimination function. Transplantation 2004;77:99-106. DOI: 10.1097/01.TP.0000101009.91516.FC [ Links ]
3. Ioannou GN. Development and validation of a model predicting graft survival after liver transplantation. Liver Transpl 2006;12:1594-606. DOI: 10.1002/lt.20764 [ Links ]
4. Feng S, Goodrich NP, Bragg-Gresham JL, et al. Characteristics associated with liver graft failure: the concept of a donor risk index. Am J Transplant 2006;6:783-90. DOI: 10.1111/j.1600-6143.2006.01242.x [ Links ]
5. Rana A, Hardy MA, Halazun KJ, et al. Survival outcomes following liver transplantation (SOFT) score: a novel method to predict patient survival following liver transplantation. Am J Transpl 2008;8:2537-46. DOI: 10.1111/j.1600-6143.2008.02400.x [ Links ]
6. Halldorson JB, Bakthavatsalam R, Fix O, et al. D-MELD, a simple predictor of post liver transplant mortality for optimization of donor/recipient matching. Am J Transpl 2009;9:318-26. DOI: 10.1111/j.1600-6143.2008.02491.x [ Links ]
7. Dutkowski P, Oberkofler CE, Slankamenac K, et al. Are there better guidelines for allocation in liver transplantation? A novel score targeting justice and utility in the model for end-stage liver disease era. Ann Surg 2011;254:745-53. DOI: 10.1097/SLA.0b013e3182365081 [ Links ]
8. Braat AE, Blok JJ, Putter H, et al. The Eurotransplant donor risk index in liver transplantation: ET-DRI. Am J Transpl 2012;12:2789-96. DOI: 10.1111/j.1600-6143.2012.04195.x [ Links ]
9. Briceño J, Cruz-Ramírez M, Prieto M, et al. Use of artificial intelligence as an innovative donor-recipient matching model for liver transplantation: results from a multicenter Spanish study. J Hepatol 2014;61:1020-8. DOI: 10.1016/j.jhep.2014.05.039 [ Links ]
10. Lau L, Kankanige Y, Rubinstein B, et al. Machine-learning algorithms predict graft failure after liver transplantation. Transplantation 2017;101:e125-32. DOI: 10.1097/TP.0000000000001600 [ Links ]
11. Collett D, Friend PJ, Watson CJE. Factors associated with short- and long-term liver graft survival in the United Kingdom: development of a UK donor liver index. Transplantation 2017;101:786-92. DOI: 10.1097/TP.0000000000001576 [ Links ]
12. Memoria de Resultados del Registro Español de Trasplante Hepático. Disponible en: http://www.sethepatico.org. [ Links ]
13. Winter A, Féray C, Audureau E, et al. External validation of the donor risk index and the Eurotransplant donor risk index on the French liver transplantation registry. Liver Int 2017;00:1-10. DOI: 10.1111/liv.13378 [ Links ]
14. Jadlowiec CC, Taner T. Liver transplantation: current status and challenges. World J Gastroenterol 2016;22:4438-45. DOI: 10.3748/wjg.v22.i18.4438 [ Links ]
15. Kulik U, Lehner F, Klempnauer J, et al. Primary non-function is frequently associated with fatty liver allografts and high mortality after re-transplantation. Liver Int 2017;37:1219-28. DOI: 10.1111/liv.13404 [ Links ]
16. González FX, Rimola A, Grande L, et al. Predictive factors of early postoperative graft function in human liver transplantation. Hepatology 1994;20:565-73. DOI: 10.1002/hep.1840200304 [ Links ]
17. Sirivatanauksorn Y, Taweerutchana V, Limsrichamrern S, et al. Analysis of donor risk factors associated with graft outcomes in orthotopic liver transplantation. Transplant Proc 2012;44:320-3. DOI: 10.1016/j.transproceed.2011.12.031 [ Links ]
18. Al-Freah MAB, McPhail MJW, Dionigi E, et al. Improving the diagnostic criteria for primary liver graft nonfunction in adults utilizing standard and transportable laboratory parameters: an outcome-based analysis. Am J Transplant 2017;17:1255-66. DOI: 10.1111/ajt.14230 [ Links ]
19. Grat M, Wronka KM, Patkowski W, et al. Effects of donor age and cold ischemia on liver transplantation outcomes according to the severity of recipient status. Dig Dis Sci 2016;61:626-35. DOI: 10.1007/s10620-015-3910-7 [ Links ]
20. Schlegel A, Linecker M, Kron P, et al. Risk assessment in high- and low-MELD liver transplantation. Am J Transpl 2017;17:1050-63. DOI: 10.1111/ajt.14065 [ Links ]
21. Schoening W, Helbig M, Buescher N, et al. Eurotransplant donor-risk-index and recipient factors: influence on long-term outcome after liver transplantation - A large single-center experience. Clin Transplant 2016;30:508-17. DOI: 10.1111/ctr.12714 [ Links ]
22. Araiz JJ, Serrano MT, García-Gil FA, et al. Intention-to-treat survival analysis of hepatitis C virus/human immunodeficiency virus coinfected liver transplant: is it the waiting list? Liver Transpl 2016;22:1187-96. DOI: 10.1002/lt.24474 [ Links ]
23. Ayllón MD, Ciria R, Cruz-Ramírez M, et al. Validation of artificial neural networks as a methodology for donor-recipient matching for liver transplantation. Liver Transpl 2018;24(2):192-203. DOI: 10.1002/lt.24870 [ Links ]
Received: January 22, 2018; Accepted: May 23, 2018
 Este es un artículo publicado en acceso abierto bajo una licencia Creative Commons
