


 Servicios personalizados
 Inglés (pdf)
 Articulo en XML
 Referencias del artículo
 Enviar articulo por email
 Citado por SciELO
  Citado por Google
  Similares en
SciELO
Similares en
SciELO  Similares en Google
 Permalink
Introduction
Studies on smartphone addiction have recently identified some psychosocial vulnerabilities in addicted users that might be related to a higher propensity to be victimized by cybercrime. Longitudinal (Herrero, Torres, Vivas, & Urueña, 2019a; Herrero, Urueña, et al., 2019b; Lapierre & Zhao, 2021) and correlational research findings (Al-Kandari, & Al-Sejari, 2020; Herrero, Urueña, et al., 2019a; Ranney & Troop-Gordon, 2020) have suggested that smartphone-addicted users may have problems with social relationships in their daily lives (e.g., poor social support) compared to non-addicted users. While both smartphone addiction and social support have been linked primarily to subjective well-being and health, their relationship to cybercrime victimization has also been found in different studies (Judges, et al., 2018; Martínez-Ferrer et al., 2021; Mollenhorst, et al., 2018; Oksanen, & Keipi, 2013; Xing, et al., 2020). It is therefore likely that the tendency of addicted users to show poor social support or social isolation (see for reviews, Busch & McCarthy, 2020; Elhai, et al., 2017) could increase their potential to be victimized by cybercriminals (Alhaboby, et al., 2019; Buchanan & Whitty 2014). This ability of smartphone addiction to diminish users' social support and thereby enhance their vulnerability to cybercriminals has been scarcely addressed (Herrero, Torres, Vivas, Hidalgo, et al., 2021) and constitutes the research focus of the present study.
When a person is a crime victim, it is likely that an offender or a criminal organization has been able to take advantage of an existing vulnerability of the victim. Situational explanations of crime victimization emphasize that victimization occurs when a potential victim and a motivated offender coincide in time and space in the absence of a capable guardian. The two main situational theoretical orientations are lifestyle theory and routine activities theory. These two theories share some of their main theoretical assumptions, so they are usually combined into a single theory: the theory of lifestyle and routine activities (L-RAT).
According to the L-RAT, a victim is not vulnerable because of his or her personal characteristics, but rather a victim's lifestyle or routine activities lead to potential vulnerability. As routines or lifestyles change, vulnerability also changes. These conceptualizations, originally developed to explain mainly street crime, have been adapted to offer explanations of cybercrime victimization as well (Holtfreter, et al., 2008; Pratt, et al., 2014). The body of empirical studies on this perspective is substantial and is now considered among researchers to be one of the most widely used conceptual approaches to account for cybercrime victimization (Akdemir & Lawless, 2020; Herrero, Torres, Vivas, Hidalgo, et al., 2021; Kubrin, & Ousey, 2021; Wilcox, & Cullen, 2018).
As recently noted by Herrero, Torres, Vivas, Hidalgo, et al. (2021), despite efforts to apply L-RAT to cybercrime, researchers have been unenthusiastic about studying what potential effect the addictive or deregulated use of internet access devices (e.g., the smartphone) could also have on cybercrime victimization. Smartphone addiction incorporates several of the vulnerabilities pointed out by criminologists, and it is, therefore, to be expected that the higher the level of smartphone addiction, the greater the likelihood of being victimized by cybercrime.
Smartphone-addicted users may be more likely to be exposed to situations that increase the risk of cybercrime victimization, either because they are risky situations in themselves or because people interact very frequently in those situations (Turanovic, & Pratt, 2014). The available empirical evidence seems to point in this direction: high levels of addiction (and smartphone addiction) may increase exposure to the vulnerabilities indicated by L-RAT. Using data from a large online survey, Whitty (2019) found that L-RAT elements were important predictors of cybercrime victimization (i.e., cyberfraud) and that those elements were also positively associated with addiction. Although these results allowed linking L-RAT, addiction, and cybercrime victimization, L-RAT could only be partially confirmed (only exposure and lack of guardian were assessed), and addiction was assessed generically as an addiction-prone personality. Using nationally representative data of smartphone users in Spain, Herrero, Torres, Vivas, Hidalgo, et al. (2021) found that all dimensions of L-RAT (exposure, proximity, suitability, and lack of guardian) successfully predicted cyberfraud. What these results suggest is that addiction—and specifically smartphone addiction—may very likely drive potential vulnerability to being victimized by cybercrime. According to this, the addictive or deregulated use of smartphones can be an important factor for cybercrime victimization due to its ability to increase exposure to motivated cybercriminals in situations where there is no capable (cyber)guardian.
The Present Study
The available empirical evidence, which is still somewhat fragmented, suggests that smartphone addiction may be a potential risk for cyberfraud victimization. This potential risk derives from the double vulnerability associated with smartphone-addicted users (Herrero, Torres, Vivas, Hidalgo, et al., 2021). On the one hand, the addictive and deregulated use of smartphones can expose users to potential cybercriminals and to situations where there is no capable guardian. On the other hand, smartphone addiction also negatively affects the presence of protective factors in the user with a potential effect on cyberfraud victimization, such as the lack of social support.
Most of the evidence available to date on the relationship between smartphone addiction, social support, and cybercrime victimization is correlational in nature, which certainly limits the generalizability of the results. In the present study, we incorporate the temporal dimension in the examination of these relationships. To verify the empirical plausibility of this set of theoretical relationships, we followed up on smartphone addiction, social support, and cybercrime victimization (specifically, cyberfraud) over time in a representative sample of Spanish smartphone users. We tested the extent to which variations in smartphone addiction and social support over time were associated with the risk of being victimized by cyberfraud.
The evolution of smartphone addiction and social support were analyzed using latent growth models (LGMs). LGM is a longitudinal analysis technique to estimate "growth" over time. The evolution of cyberfraud victimization over time was modeled through discrete-time survival curves, which allowed us to investigate the time it takes for an event of interest to occur (i.e., cyberfraud). Finally, the latent growth mixture modeling (LGMM) technique was used to evaluate the association of different trajectories of smartphone addiction and social support and different survival curves of cyberfraud victimization (see Figure 1). LGMM allows the researcher to explain between-subject heterogeneity in growth on an outcome by identifying latent classes with different growth trajectories and survival rates. With these three combined statistical techniques, we aimed to empirically identify population subgroups with different trajectories in smartphone addiction and social support as well as different survival rates of cyberfraud victimization. A representation of the analysis strategy is presented in Figure 1 and discussed in more detail in the method section.

Note. SS1-SS6 = social support from T1 to T6; SA4-SA6 = smartphone addiction from T4 to T6; CF1-CF6 = cyber-fraud from T1 to T6; Iss = intercept for social support; Sss = slope for social support; Isa = intercept for smartphone addiction; Ssa = slope for smartphone addiction; SR = survival rates for cyber fraud over time; C = number of distinct classes.
Figure 1. Discrete-time Survival Mixture Growth Model: Social Support and Smartphone Addiction Trajectories and Different Survival Rates over Time.
We expected that the levels of smartphone addiction and social support and their evolution over time would allow the identification of participants with different vulnerabilities to cyberfraud. Our starting hypothesis was that a downward trajectory of smartphone addiction and increasing levels of social support would be associated with a lower risk of cyberfraud victimization.
Method
Participants
Data from the Cybersecurity and Confidence in Spanish Households National Survey (CCSHNS) conducted by the National Observatory of Telecommunications and Information Society were used for this study. The CCSHNS is a nationally representative survey of Spanish internet users on cybersecurity conducted every six months (see Herrero, Torres, Vivas, Arenas, et al., 2021). The survey has a fixed set of questions that are evaluated every semester and other modules that may undergo modifications in the different waves. Data from six time panels obtained between the first half of 2017 and the second half of 2019 were used for this study. Each panel of the study was conducted on a representative sample of the population of internet users aged 18 to 75. For this study, 716 participants had complete data on the study variables during the 36-month follow-up.
Social support and cyberfraud victimization were measured in all six panels of the study. In panels T1 and T3, smartphone addiction was assessed in a small number of participants (277 and 288, respectively), and from panel T4 onward, this variable was regularly assessed in all study participants. The reason for this strategy is that at the beginning of the study, only a subset of participants was assessed for smartphone addiction to pilot the potential assessment of addiction in all participants in the following waves. Once the pilot study was completed, starting from the T4 panel, smartphone addiction was assessed in all users. As a result of this strategy, data were available from six panels on social support and cyberfraud victimization (T1-T6) and from three panels for smartphone addiction (T4-T6).
Variables and Scales
Smartphone addiction. The survey used eight items from the Smartphone Addition Symptoms Scale (SAPS; Bian & Leung, 2015). The items originally have 5 response categories (from 1 = not true to 5 = extremely true), but for the calculation of smartphone addiction, the authors of the scale recommend dichotomizing the response categories in the following way: 4 (true) or 5 (extremely true) = 1; all remaining response categories were set to zero. Items were summed. The descriptive and internal consistency statistics are presented in Table 1.
Table 1. Descriptive Statistics and Internal Consistency of Variables of the Study in the Six Waves (N = 716)1
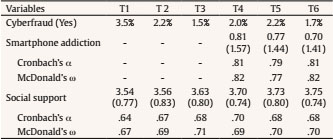
Note. 1For cyberfraud, percentages of participants having experienced cyberfraud at each time point are shown. For smartphone addiction and social support, means and standard deviation (in parenthesis) are displayed.
Social support. The strong-tie support scale (Lin, et al., 1981) was used to measure social support from intimate and confidant relationships with three items on a five-point scale from 1 = never to 5 = most of the time. The scale measures to what extent respondents felt their support needs were fulfilled by close companions. The three items of the strong-tie support scale are a recommended measure of social support for large-scale surveys (Herrero, et al., 2011). Social support was assessed in all panels from T1 to T6. The descriptive and internal consistency statistics are presented in Table 1.
Cyberfraud. The survey evaluated cyberfraud with a dichotomous response question (0 = no, 1 = yes) addressed to participants: "Have you suffered any financial loss in the last 6 months due to possible cyberfraud?". Cyberfraud was assessed in all panels from T1 to T6. The descriptive statistics are presented in Table 1. In each wave, between 1.5% and 3.5% of the participants claimed to have suffered cyberfraud.
Sociodemographic variables: sex (male 56.4%, female 43.6%); age in five age groups: 15 to 24 years (3.2%), 25 to 34 years (16.1%), 35 to 44 years (37.7%), 45 to 54 years (27.5%), and more than 55 years (15.5%) (M = 3.28, SD = 1.22); educational background: highest educational level attainment, 1 = elementary (0.7%), 2 = secondary (46.9%), and 3 = university studies (52.4%) (M = 2.48, SD = 0.53); and size of locality: from 1-less than 10,000 to 6-more than 500,000 inhabitants (M = 3.94, SD = 1.77).
Analytical Strategy
For the study of the trajectories of smartphone addiction, social support, and cyberfraud over time, we used a combined strategy of latent growth mixture modeling and survival curve analyses. We studied the evolution of cyberfraud over the 36 months of follow-up (data from six panels) using discrete-time survival analysis. This technique is specially designed to analyze survival rates in a sample of individuals. Survival here refers to the occurrence or nonoccurrence of an event (having experienced cyberfraud) in each panel. Participants who did not experience cyberfraud throughout the study were considered survivors.
Discrete-time survival analysis allows modeling the survival rates of a set of participants and relates that survival rate to other processes of interest. In our case, we modeled the relationship of the survival rate with the evolution of smartphone addiction and social support. We first modeled trajectories in social support and smartphone addiction using latent growth curves (LGMs). With this strategy, we tested whether the average evolution of users' smartphone addiction and social support were upward, downward, or zero during the three years of follow-up.
LGMM was then applied to the study of trajectories of smartphone addiction and social support and cyberfraud survival data to characterize the heterogeneity in these processes (i.e., growth and survival factors) in terms of latent classes (see Figure 1). The aim was to identify different subgroups among the participants with a differential profile in terms of their evolution of smartphone addiction, social support, and cyberfraud survival rates. According to Figure 1, the trajectories described by the latent growth factors of smartphone addiction (Ssa) and social support (Sss) may not be the same for all participants. This heterogeneity is modeled by the Factor C corresponding to the number of latent classes (or groups) that best describes the heterogeneity of the trajectories of smartphone addiction and social support. This part of the model is estimated using the latent growth mixture model technique. These heterogeneous trajectories, moreover, are associated with cyberfraud survival rates, represented by the survival factor SR. Models were estimated using MPLUS (version 8.2) software (Muthén, & Muthén, 1998-2017).
Discrete-time survival analysis predicts time-to-first cyberfraud events and considers cyberfraud to be a nonrepeatable event. The data did not fit exactly with these requirements, so a brief discussion is necessary to justify the analytical strategy. First, the study design did not allow us to completely rule out that some participants might have experienced cyberfraud prior to the beginning of the study. This is a circumstance that potentially limits the scope of the results. Second, it does not seem that cyberfraud is a nonrepeatable event, as might be death, the onset of drug use, or first school expulsion, to give just a few examples. Rather, it is a recurring event, in that a person could be a victim of cyberfraud multiple times. Prior to the implementation of the technique, we checked some issues related to the reoccurrence of cyberfraud. Out of 716 study participants, 118 suffered cyberfraud during the 36 months of follow-up. Of those 118 participants, 64% (n = 77) experienced cyberfraud in a single period, and 21% (n = 25) experienced it in two periods. It is interesting to note that all participants with a record of cyberfraud in two periods experienced it in contiguous periods. Given that approximately 85% of participants experienced cyberfraud in a very localized time span, the strategy of analyzing cyberfraud for the first time seemed plausible. With this strategy, the estimation of model parameters is less computationally difficult than the estimation of survival curves of repeatable events (Lougheed, et al., 2019).
Results
Attrition Analyses
Participants who remained in the study throughout the follow-up phase showed some significant differences with dropouts. There was a tendency for male (χ2 = 14.08, p < .001, Cramer's V = .68) and older [F(1, 3575) = 29.13, p < .001; dropouts = 3.11, follow-ups = 3.36], participants to remain in the study. There was also a trend that participants who remained in the study throughout follow-up showed higher levels of social support at baseline, [F(1, 575) = 11.33, p < .001; dropouts = 3.41, follow-up = 3.54], lower initial levels of smartphone addiction [dropouts = 1.02, follow-ups = 0.81, F(1, 1766) = 5.96, p < .01], and lower cyberfraud victimization rates (χ2 = 15.01, p < .001, Cramer's V = .65) than those who dropped out. A total of 7.5% of the participants who dropped out of the study experienced cyberfraud at T1. This percentage was reduced to 3.5% among those who completed the follow-up. It is interesting to note at this point that there appeared to be self-selection in users to participate in the study guided by low smartphone addiction, high social support, and lower rates of cyberfraud victimization at T1. Table 1 shows the descriptive statistics of the study variables. The percentage of participants victimized by cybercrime in each period remained between 1.5% and 3.5%. This suggested that the rate of cyberfraud did not fluctuate significantly over time. On average, smartphone addiction showed a decrease (from 0.81 to 0.70), while social support showed an increase (from 3.54 to 3.75) throughout the study.
Growth Trajectories
The trajectories of smartphone addiction and social support were estimated using LGM. The model with joint estimation of the trajectories of smartphone addiction and social support showed a good fit to the data (χ2 = 47.08, df = 31, p = .003; CFI = .99; RMSEA = .04, 95% CI [0.03, 0.04]). For the overall sample, at baseline, smartphone addiction was 0.81 (SE = 0.13, p < .001), and social support was 3.54 (SE = 0.03, p < .001). Smartphone addiction showed a slight decrease (slope = -0.06, SE = 0.03, p = .03), and social support showed an average increase (slope = 0.05, SE = 0.01, p < .001) over the six waves. Both the slope variance for smartphone addiction (var. slope = 0.19, SE = 0.09, p =.03) and social support (var. slope = 0.01, SE = 0.00, p = .03) were statistically significant. Likewise, variances of the intercepts (smartphone addiction and social support at baseline) were statistically significant (smartphone addiction, 4.18, SE = 1.53, p = .04; social support, 0.37, SE = 0.04, p < .001). Therefore, not all participants started the study with the same levels of smartphone addiction and social support. The variability of their slopes suggested heterogeneity in the trajectories (not all participants decreased their smartphone addiction or increased their social support scores in the same way or at the same rate). Baseline levels of smartphone addiction and social support were significantly and negatively related (-0.24, SE = 0.11, p = .03): at baseline, the lower the score for smartphone addiction, the higher the score for social support.
Survival and Latent Growth Mixture Analyses
In the next step, we sought to examine this heterogeneity in trajectories of smartphone addiction and social support in relation to survival rates in cyberfraud over time. The aim was to find different groups or classes of participants with significant differences in their trajectories of smartphone addiction and social support and verify whether they also showed different cyberfraud survival rates (see Figure 1). Discrete-time survival mixture analysis with survival predicted by growth trajectory classes was estimated. LGMM proceeds with the estimation of different models with an increasing number of classes, and then the model with the optimal number of classes is selected. Although there is no single method for the selection of these models, the literature in this field has pointed out that the selection should be conceptually and empirically guided. On the one hand, the resulting models must be consistent with available theory. On the other hand, empirical criteria such as entropy, number of participants per class, and likelihood ratio test (LRT) between models with a class difference of k =1 can help the researcher select the most suitable models. Entropy can range from zero to one, with values closer to one indicating higher classification accuracy and the degree to which classes are distinct from each other. Models with higher values of entropy (and closer to 1) are preferable to models with values farther from 1. LRT allows to statistically compare the chi-square difference of a model with k classes versus a model with one fewer class (k-1). A significant p value rejects the k-1 class model in favor of the k class model. Both entropy and LRT serve to guide the decision on the selection of the optimal number of classes that best define the sample. However, models that either identify classes with too few members or whose classes lack a theoretical basis are candidates for rejection, even with adequate levels of entropy or supported by LRT (see Bauer & Curran, 2003; Celeux, et al., 2018; Muthén & Muthén, 1998-2017, for an analysis). Maximum likelihood estimation with robust standard errors was used for model estimation.
Models with 1, 2, 3, 4 and 5 classes were estimated. First, we performed a likelihood ratio test using bootstrap LRT χ2 (BLRT). Instead of assuming that the difference distribution follows a known distribution (e.g., the chi-square distribution), the BLRT empirically estimates the difference distribution and outperforms other LRTs to help determine whether the inclusion of an additional latent class while maintaining the same model specifications significantly improves the model fit (Nylund, et al., 2007). The 2-class model was a statistical improvement over the 1-class model, according to BLRT results (value = 541.81, p < .001). The 3-class model did not provide a statistically significant improvement over the 2-class model (value = 326.32, ns). Subsequent models with a number of classes from 4 to 5 also showed no statistical improvement. The 2-3- and 5-class models showed a similar level of entropy (entropy = 0.98), while the 4-class model showed a considerable reduction in entropy (0.77). In terms of the number of participants per class, the 5-class model had two very small classes of 12 and 13 participants, while the 3- and 4-class models had two classes with approximately 40 participants each. The 2-class model grouped the majority of participants (n = 653) in one class and the remaining (n = 63) in another.
In the 2-class model, each class had different growth rates in smartphone addiction and social support and different survival curves. This reinforced the idea that classes 1 and 2 allowed the identification of statistically distinct subgroups and was also in accordance with substantive theory on trajectories of smartphone addiction and social support among the general population (Herrero, Torres, Vivas, & Urueña, 2019a). Overall, the model comparison suggested that it would be appropriate to analyze latent classes in which these trajectories and the survival curve were different across classes to explain the heterogeneity observed in the growth trajectories for smartphone addiction and social support. The 2-class model met these requirements and was retained for further analysis.
Table 2. Unstandardized Parameter Estimates for the 2-latent Class Model1 (N = 716)

Note. 1Standard errors in parenthesis.
Smartphone addiction. Class 1 participants showed higher levels of smartphone addiction at the beginning of the study than class 2 participants (class 1, smartphone addiction = 2.26, SE = 1.05, p < .01; class 2, smartphone addiction = 0.78, SE = 0.14, p < .001). The evolution of smartphone addiction was also different in the two classes: class 1, smartphone addiction showed a marginal increase (slope = 0.40, SE = 0.23, p = .09), while in class 2, it significantly decreased (slope = -0.11, SE = 0.03, p = .001).
Social support. Class 1 participants showed lower levels of social support at the beginning of the study (class 1, social support = 3.16, SE = 0.09, p < .001; class 2, social support = 3.58, SE = 0.03, p < .001). The evolution of social support was also different in the two classes. In class 1, social support did not change (slope = 0.04, SE = 0.03, ns), while in class 2, it increased (slope = 0.05, SE = 0.01, p < .001) during the study. In summary, class 1 encompassed participants with high levels of addiction and low social support, while class 2 encompassed participants with lower levels of addiction and higher levels of social support.
Survival rates. The statistical significance of survival rates across classes was estimated from the mean of the latent factor (SR) in Figure 1. The study of the survival rates between classes was performed by taking class 2 as the comparison group (with a mean of zero). Class 1 participants showed a significant drop in survival rates throughout the study (factor SR mean = 1.54, SE = 0.25, p < .001) compared to class 2 participants. In other words, class 1 participants experienced higher rates of cyberfraud throughout the study (see Figure 2). Figure 2 plots the Kaplan-Meier estimator of survival curves for class 1 and class 2. The Kaplan-Meier estimator is a nonparametric statistic used to estimate the survival function. The decreasing horizontal steps shown in Figure 2, with a sufficiently large sample size, approximate the true survival function of both classes.

Note. All survival estimates to a given point represent the cumulative probability of surviving to that time. The probability for each group at time 7 represents the cumulative probability of survival (not having suffered cyber fraud) over the three-year follow-up period. The curve begins at T1 (which would be T0 at follow-up) with a 100% survival rate prior to the start of the study. Thus, T2 in the figure would be equivalent to T1 in our study and so on.
Figure 2. Survival Kaplan-Meier Estimates for Class 1 and Class 2.
For class 1, the probability of surviving (to not experience cyberfraud) at the end of the six periods of follow-up (36 months) was 0.59; conversely, for class 2, the probability of surviving after six months was slightly more than 0.89. In terms of percentages, 41% of class 1 participants (n = 26) experienced cyberfraud throughout the study, while only 11% of class 2 participants (n = 66) did. Class 1 participants showed a higher risk of cyberfraud during the study.
Class 1 participants, with a higher risk for cyberfraud, showed high levels of smartphone addiction and low levels of social support. Class 2 participants, with a lower risk of cyberfraud, started with higher levels of social support, which increased during follow-up, and low levels of smartphone addiction, which decreased over time. These results suggested that the levels of smartphone addiction and social support and their evolution over time allow the identification of participants with a higher risk of being victims of cyberfraud.
Discussion
The empirical literature on smartphone addiction has identified some psychosocial vulnerabilities in addicted users that could also be related to cyberfraud victimization. In this study, we focus specifically on social support. Using data from 716 smartphone users from a nationally representative sample, we analyze the relationship between smartphone addiction, social support and cyberfraud victimization. Our hypothesis was that downward trajectories of smartphone addiction and upward trajectories of social support will be associated with a lower risk of cyberfraud victimization over time.
The results of discrete-time survival mixture analysis with survival predicted by growth trajectory classes provided empirical support for our starting hypothesis: survival rates were significantly better in users with lower levels of smartphone addiction and higher social support and who presented a favorable evolution in both trajectories (smartphone addiction decreased and social support increased). Additionally, a small percentage of users with higher levels of smartphone addiction and lower levels of social support at baseline not only had worse outcomes on both variables (addiction showed an increasing trend and social support remained at low levels) but also showed substantially lower survival rates. In fact, the combination of high smartphone addiction and low social support reduced the survival rate of users by approximately 33% (from 0.89 to 0.59) compared to users with lower levels of addiction and higher levels of social support and a favorable evolution in both variables over time. Our results showed that both smartphone addiction and social support were clearly associated with cyberfraud victimization.
These results confirm the findings of other longitudinal research indicating that smartphone addiction and social support seem to follow inverse trajectories. Using a subset of users of the CCSHNS data, Herrero, Torres, Vivas, and Urueña (2019a) found that the greater the increase in smartphone addiction, the less the increase in social support and that higher smartphone addiction was predictive of lower levels of social support. These results have been partially replicated with different samples and measures of social support and smartphone addiction in both longitudinal (Lapierre & Zhao, 2021) and correlational studies (Al-Kandari & Al-Sejari, 2020; Ihm, 2018; ; Kim & Koh, 2018; Liu & Ma, 2018; Yayan et al., 2019).
Although smartphone addiction and social support have traditionally been linked to subjective well-being and health, less scientific attention has been given to their relationship to cybercrime victimization. There is empirical evidence that social connectedness problems, such as low social support, could be an antecedent of crime victimization (Spano & Nagy, 2005; Yap & Devilly, 2004), probably because isolated people might be seen by offenders as easy targets (Alves & Wilson, 2008; Matthews et al., 2020) and be more at risk of fraud victimization (Xing et al., 2020). When transferred to the study of cyberfraud, however, social isolation is unlikely to be a visible characteristic of potential victims. As has been pointed out (Ghazi-Tehrani & Pontell, 2021; Leukfeldt, 2015), cybercriminals do not tend to select their victims individually, but rather their technique consists of accessing large population groups (fraudulent messages and websites, for example) who, by self-selection, respond to those messages or visit those websites. In this sense, users with low social support may show a greater tendency to self-select and contact cybercriminals, thereby increasing the likelihood of being a victim of cyberfraud, as our results suggest.
This trend is also observed in users with higher rates of smartphone addiction, whose deregulated use of the device could also encourage self-selection and be more likely to respond to cyberfraud attempts. In this regard, the empirical literature on smartphone addiction has noted how users with higher rates of smartphone addiction tend to respond more frequently to fraudulent messages and are also recipients of more malicious attacks, as their devices have greater security threats (Herrero, Urueña, et al., 2019a).
This opens new avenues of research on the mechanisms that tend to increase smartphone addiction and that would have an effect on cyberfraud victimization. In this paper, we explored the effect of social support. However, there may be other important determinants of smartphone addiction with a potential effect on cyberfraud victimization that should be addressed by research.
One seemingly harmless element that could be related to an increased risk of cyberfraud victimization would be the need for users to expand their communication capabilities with other users through the use of increasingly sophisticated applications. These communication applications are designed to retain and capture users' attention (Kushlev et al., 2019), so social digital pressure could be an undesirable outcome (Gui & Büchi, 2021; Herrero, Torres, Vivas, Arenas, et al., 2021) associated with the design of these applications. Recent empirical evidence suggests that social digital pressure may become an important antecedent of smartphone addiction (Herrero, Torres, Vivas, Arenas, et al., 2021). Thus, personal tendencies to seek fun or connectivity with other users could lead to a higher risk of cyberfraud victimization. This is, in principle, an unexpected result that our study is able to anticipate and that, undoubtedly, requires further scientific scrutiny.
Strengths and Limitations
A strength of the study is its longitudinal nature. Compared to other research in this area that uses cross-sectional data to tentatively explore explanatory hypotheses, the availability of panel data allowed for the combined study of trajectories in smartphone addiction, social support, and cyberfraud over time. This circumstance adds robustness to the results of the study while allowing for a dynamic interpretation of the processes under scrutiny. From a theoretical point of view, the study combines different explanations of cyberfraud victimization that have traditionally followed parallel paths, something that can be considered a strength of the research. Thus, situational explanations of cybercrime victimization (L-RAT) indirectly suggest that smartphone addiction could be related to cyberfraud. These theoretical contributions, however, do not anticipate a particular incidence of social support on cyberfraud victimization, as our results suggest.
Beyond the strengths of the study, we also detected some potential limitations. The first of these potential limitations has to do with the estimation of survival curves for cyberfraud. As we have already briefly discussed in the rationale for choosing the discrete-time survival analysis technique to study the evolution of cyberfraud, it is likely that this variable does not fully fit the type of nonrepeatable events recommended for this statistical technique. Although most of the study participants experienced cyberfraud in a very temporally localized period, a small percentage reported cyberfraud in noncontiguous periods. In these participants, only the first victimization was predicted, so the models tested did not take into account subsequent victimizations. This may have affected the results of the study. When events are repeatable, a survival curve should be calculated for each event, where the time interval is counted from the last episode of victimization suffered (Masyn, 2009). Another potential limitation that may have affected the results of the study lies in the fact that levels of smartphone addiction, social support, and cyberfraud were significantly related to permanence in the study. Thus, at higher levels of smartphone addiction, lower levels of social support, and higher rates of cyberfraud, participation in the study was significantly lower. This may have affected the results of the study, mainly as a consequence of reduced variability in the study variables. Further research should elucidate whether this circumstance could have had a downward effect on the magnitude of the coefficients found.
To summarize, our study seems to confirm that the addictive use of smartphones not only negatively affects the psychosocial well-being of users, as has been recognized in the scientific literature. It may also lead to the vulnerability of these addicted users to cybercrime. This circumstance places this type of user in a double vulnerability (in their well-being and in their cybersecurity) that should be the subject of further scientific scrutiny in future research.

