


Mi SciELO
 Servicios personalizados
Servicios Personalizados
Revista
Articulo
 Inglés (pdf)
 Articulo en XML
 Referencias del artículo
 Enviar articulo por email
Indicadores
-
 Citado por SciELO
 -
 Accesos
Links relacionados
-
 Citado por Google
 -
 Similares en
SciELO
Similares en
SciELO -
 Similares en Google
Compartir

 Permalink
International Microbiology
versión impresa ISSN 1139-6709
INT. MICROBIOL. vol.7 no.1 mar. 2004
| RESEARCH ARTICLE | ||||
|
| ||||
| Distribution of phototrophic populations and primary production in a microbial mat from the Ebro Delta, Spain | |||
| Summary. Microbial mats arising in the sand flats of the Ebro Delta (Tarragona, Spain) were investigated during the summer season, when the community was highly developed. These mats are composed of three pigmented layers of phototrophic organisms, an upper brown layer mainly composed of Lyngbya aestuarii and diatoms, an intermediate green layer of the cyanobacterium Microcoleus chthonoplastes, and an underlying pink layer of a so-far unidentified purple sulfur bacterium. In the photic zone, oxygenic phototrophs constitute about 58% of total photosynthetic biomass, measured as biovolume, and anoxygenic phototrophs represent 42%. Diatoms constitute 11.8% of the oxygenic biomass, M. chthonoplastes 61.2%, and L. aestuarii and coccoid cyanobacteria 20.6 and 6.4%, respectively. In this laminated community, organic matter has an autochthonous origin, and photosynthesis is the most important source of organic carbon. Oxygen production reaches up to 27.2 mmol O2 m–2 h–1, measured at 1000 µE m–2 s–1 light intensity, whereas oxidation of sulfide in the light has been calculated to be 18.6 mmol S m–2 h–1. This amount represents 26% of the total photosynthetic production in terms of photoassimilated carbon, demonstrating the important role of anoxygenic phototrophs as primary producers in the pink layer of Ebro Delta microbial mats. [Int Microbiol 2004; 7(1): 19–25, 2004] Key words: oxygenic photosynthesis · anoxygenic photosynthesis · phototrophic bacteria · microbial mats | |||
| Distribución de poblaciones fotótrofas y producción primaria en un tapete microbiano del delta del Ebro (España) Resumen. Los tapetes microbianos que se establecen en los sedimentos litorales del delta del Ebro (Tarragona, España) fueron investigados durante el verano, cuando la comunidad estaba muy desarrollada. Dichos tapetes se componen de tres capas pigmentadas, con diferentes organismos fotótrofos. La capa superior es de color marrón y está compuesta principalmente por Lyngbya aestuarii y diatomeas. Debajo de ésta, se observa una capa intermedia de color verde, donde predomina la cianobacteria Microcoleus chthonoplastes. Finalmente, por debajo de las dos anteriores se ve una lámina rosa, en la que el organismo fototrófico dominante es una nueva bacteria roja del azufre no identificada hasta este momento. En la zona fótica, los organismos fototróficos oxigénicos representan un 58% de la biomasa fotosintética total, medida ésta como biovolumen; el 48% restante corresponde a los organismos fotótrofos anoxigénicos. En relación a la biomasa oxigénica, las diatomeas constituyen un 11,8% del total, mientras que M. chthonoplastes, L. aestuarii y las cianobacterias cocoides representan un 61,2%, un 20,6% y un 6,4%, respectivamente. En esta comunidad multilaminada, la materia orgánica es de origen autóctono y la fotosíntesis es la principal fuente de carbono orgánico. La producción de oxígeno alcanza los 27,2 mmol O2 m- 2 h- 1 medida a una intensidad de luz de 1000 µE m- 2 s- 1. Mientras que la oxidación de sulfuro a la luz es de 18,6 mmoles S m- 2 h- 1. Esta última cantidad representa un 26% de la producción fotosintética total, expresada como C fotoasimilado, lo cual pone de manifiesto el papel destacado de las bacterias fototrofas anoxigénicas como productores primarios en la capa roja de los ecosistemas estudiados). [Int Microbiol 2004; 7(1):19- 25] Palabras clave: fotosíntesis oxigénica · fotosíntesis anoxigénica · bacterias fotótrofas · tapetes microbianos | Distribuição de populações fototróficas e produção primária em um tapete microbiano do delta do Ebro (Espanha) Resumo. Os tapetes microbianos que se estabeleceram nos sedimentos litorâneos do Delta do Ebro (Tarragona, Espanha) foram investigados durante o verão, quando a comunidade estava altamente desenvolvida. Esses tapetes são compostos por três laminas pigmentadas, caracterizadas pela presença de diferentes organismos fototróficos. A lamina superior tem coloração marrom e está composta principalmente por Lyngbya aestuarii e diatomáceas. Na próxima camada, observa-se uma capa de coloração verde onde predomina a cianobactéria Microcoleus chthonoplastes. Finalmente, na camada inferior encontra-se uma lâmina rosa, na qual o organismo fototrófico dominante é uma nova bactéria púrpura sulfurosa, ainda não identificada. Na zona fótica, os organismos fototróficos oxigênicos representan cêrca de 58% da biomasa fotossintética total, medida em têrmos de biovolume, e os restantes 48% correspondem aos organismos fototróficos anoxigênicos. Com relação à biomasa oxigênica, as diatomáceas constituem cêrca de 11,8% do total, enquanto que M. chthonoplastes, L. aestuarii e as cianobactérias cocoides representam 61,2%, 20,6% e 6,4%. Nesta comunidade multilaminada, a matéria orgânica é de origem autóctone, sendo a fotossíntese a principal fonte de carbono orgânico. A produção de oxigênio alcança 27,2 mmol O2 m- 2 h- 1 medida à 1000 µE m- 2 s- 1. Enquanto que a oxidação de enxôfre na luz é de aproximadamente 18.6 mmoles m- 2 h- 1. Esse último valor representa cêrca de 26% da produção fotossintética total, expressa em têrmos de C fotoassimilado, o que coloca em evidência o papel relevante das bactérias fototróficas anoxigênicas como produtores primários na camada roseada dos ecossistemas estudados. [Int Microbiol 2004; 7(1):19- 25] Palavras chave: fotossíntese oxigênica · fotossíntese anoxigênica · bactérias fototróficas · tapetes microbianos |
Introduction
Phototrophic microorganisms (i.e., diatoms, cyanobacteria, purple and green sulfur bacteria) are widely distributed in laminated microbial mat ecosystems [1,4,19,21]. Their vertical zonation is due to the established steep physicochemical gradients and to their own physiology, which results in the arrangement of multicolored layers typical of this kind of ecosystem. Together with the photoautotrophic organisms, chemoautotrophic and heterotrophic bacteria coexist.
Microbial mats are highly productive ecosystems [9]. Cyanobacteria, developed in the upper layers, are usually the most important primary producers in this kind of environment. Due to their photosynthetic metabolism, cyanobacteria generate oxygen, which can diffuse a few millimeters into the mat, and synthesize organic carbon compounds that are available to the rest of the microbial populations by active excretion or cell lysis [20,27]. In the presence of suitable electron donors, anoxygenic photosynthesis and chemosynthesis play an important metabolic role. Anoxygenic phototrophic bacteria (purple and green sulfur bacteria), found below the oxic layers in a narrow zone that contains sulfide and is reached by light, can fix inorganic carbon as a consequence of their photosynthetic metabolism, using sulfide as an electron donor. Chemolithoautotrophic organisms, usually found between oxygenic and anoxygenic phototrophs, where oxygen and sulfide coexist, are able to fix inorganic carbon independently from the light using different electron donors, such as hydrogen or reduced sulfur compounds, and oxygen as electron acceptor [12].
The study of photosynthetic generation of organic matter in these few-millimeter thick ecosystems has become easier with the aid of microsensors [8,23]. In addition to measuring the vertical distribution of several physicochemical variables, such as oxygen or sulfide, these sensors record the vertical distribution of photosynthetic activity with a high spatial resolution [8,24]. A description of the Ebro Delta microbial mats, including qualitative observations of different mat populations, has already been published [18]. In the present study, we report on the vertical biomass distribution of major phototrophic organisms and the primary production of microbial mats widely distributed in the southern spit of the Ebro Delta.
Materials and methods
Sampling site description and sample collection. The studied microbial mat (site P3) is located in the Alfacs Peninsula, at the southern spit of the Ebro Delta (Spain), in a temporarily inundated sand flat close to the inner coast of the Alfacs bay described earlier [18]. Samples were collected during the summer season, when microbial mats were highly developed, using a 4.5-mm-diameter core sampler. The corer was inserted into the mat, and uniform cylindrical cores were removed. The cores were stoppered at both ends immediately after sampling and stored at 4ºC until further use. Alternatively, samples for pigment determination were frozen with liquid nitrogen in the field. In the laboratory, the different laminations were manually separated and subsampled for bacterial counts and pigment determinations. For electrode analysis, the mat core was submerged in water from the sampling site. During these measurements, the cores were incubated at 30ºC and illuminated by a halogen lamp that provided a light intensity of 1000 µE m- 2 s- 1 measured at the mat surface.
Physical and chemical analyses. Temperature, conductivity, and salinity were measured in the overlying water by means of a Yellow Springs Instrument S-C-T meter model 33. A micropH 2001 Crison pH-meter was used to measure pH. Light intensity was measured with a Delta Ohm HD 8366 lux meter.
Microscopy. Vertical sections of the mat were observed under an Olympus SZ40 dissecting microscope in order to determine the number and characteristics of the different layers. To better understand the distribution of microorganisms within the mat, small pieces of each pigmented lamination were placed on a glass slide in one drop of water and observed by phase-contrast microscopy with an Olympus BH-2 microscope.
Microbial counts. Total counts of photosynthetic organisms were made using the method of García-Pichel et al. [6], which involves repeated coring of studied mats with glass capillary tubes. Phototrophic bacteria were classified morphologically and each type was counted separately from phase-contrast microscopy images. From each layer, a total of 16 replicates were analyzed. From each single microorganism, total area, diameter and length were measured with a digital planimeter. These final values were converted into biovolume units by approximation to the nearest geometrical figure.
Pigment analysis. Chlorophyll a and bacteriochlorophyll a were measured in the different layers using methanol extracts according to the method of Mir et al. [18]. Degradation forms of these photosynthetic pigments were calculated after acidification of methanolic extracts [Martínez-Alonso M (1997) Ph.D. Thesis, Autonomous University of Barcelona, Spain]. Absorption spectra of the extracts were obtained from 320 to 900 nm using a DU-70 Beckman spectrophotometer.
Microprofiles of needle electrodes. Microprofiles of oxygen and sulfide were determined using needle mini-electrodes according to the method of Van Gemerden et al. [29]. Profiles were recorded in the sediment cores during stepwise lowering of the electrodes using a micromanipulator. The outputs from the electrodes were read on a picoamperometer (Keithley 480) and a millivoltmeter (Bioblock 93313), respectively. Oxygen production and sulfide oxidation were calculated from the oxygen and sulfide profiles after dark and light exposition of the cores according to the method of Revsbech et al. [26].
Results
Description of the mat layers and vertical distribution of bacterial populations. Prior to measuring biomass, the chemical characteristics of the mat were determined in the overlying water. In the studied period, the temperature was 30- 33ºC. Salinity, conductivity, and pH ranged from 60 to 70 g l- 1, 85- 115 ms cm- 1, and 8.3- 8.8, respectively. At noon, the light intensity (PAR flux) at the mat surface reached values from 1000 to 1200 µE m- 2 s- 1.
The distribution of dominant phototrophic organisms was studied in the photic zone of the mat. Lyngbya aestuarii and diatoms, together with different coccoid cyanobacteria and some filaments of Microcoleus chthonoplastes, coated the surface of the mat as a 0.72-mm thick layer. M. chthonoplastes formed a dense and compact green layer 0.72- 2.67-mm deep, where coccoid cyanobacteria and L. aestuarii could be seen. Below, a deep pink lamination 1.64-mm thick could be observed. This bottom layer was dominated by a new purple sulfur bacterium with morphological and ultrastructural characteristics that do not coincide with those of previously identified anoxygenic phototrophic bacteria. Below these pigmented layers, there was a black horizon, in which the upper 10 mm were composed of compacted clay and the bottom 28 mm were, in contrast, sandy. Different brown sandy laminations underlay the black layer.
Table 1 shows the vertical biomass distribution, expressed as biovolume, corresponding to major phototrophic organisms that inhabit the microbial mat studied. Diatoms, predominantly belonging to the genera Amphora, Navicula, and Nitzschia, were more abundant in the upper brown layer, where they reached values of 1.27×1010 µm3 cm- 3. Three groups of coccoid cyanobacteria could be distinguished, the Gloeocapsa group, the Cyanothece group, and the Gomphosphaerioideae subfamily. All of them were distributed along the entire photic zone; nevertheless, their concentrations were slightly increased in the green layer, with values of 1.97×109 µm3 cm- 3, 2.47×108 µm3 cm- 3, and 2.49×109µm3 cm- 3, respectively.
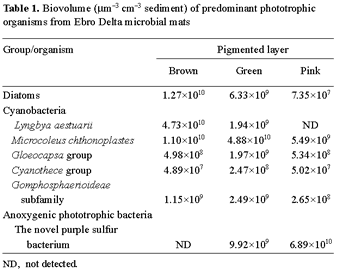
With respect to the vertical biomass distribution of filamentous cyanobacteria, L. aestuarii abounded at the surface of the mat (4.73×1010 µm3 cm- 3) while the majority of M. chthonoplastes (4.88×1010 µm3 cm- 3) was found deeper, in the green layer, with the number decreasing with depth (Table 1). The vertical biomass profile of the dominant purple sulfur bacterium showed that this new organism had a narrow distribution. It was observed at the bottom of the green layer and in the pink lamination, although about 85% of its total biomass was found in the latter, reaching a concentration of 6.89×1010 µm3 cm- 3.
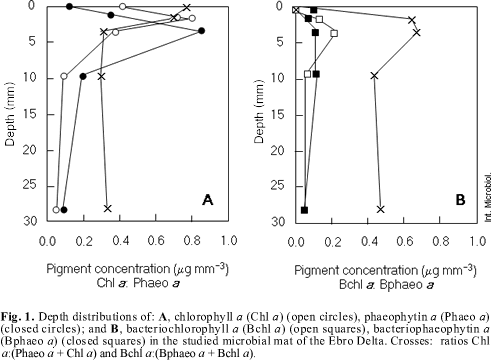
Pigment concentration. Figure 1A shows depth distribution of chlorophyll a, phaeophytin a and the ratios chl a: (chl a + phaeo a). The maximum of chlorophyll a was found in the green layer (0.814 µg mm- 3) rather than in the brown layer (0.391 µg mm- 3) or in the pink layer (0.375 µg mm- 3). In relation to degradation forms, phaeophytin a maximum was located in the pink layer (0.849 µg mm- 3). As shown in Fig. 1B, bacteriochlorophyll a amounted to a maximum of 0.212 µg mm- 3, in the pink layer. The ratio bchl a: (bchl a + bphaeo a) remained constant from 0.7 to 4.3 mm depth. In the surface and below 4 mm depth the ratio decreased.
Photosynthetic activity. Figure 2 shows the profiles of oxygen and sulfide as a function of depth at a light intensity of 1000 µE m- 2 s- 1 after 2 h in the light. The maximum oxygen concentration (1154 µM) was measured at 1.4 mm, in the middle of the green layer. Below this depth, the amount of oxygen decreased, falling to zero at 3.2 mm. The sulfide concentration increased with depth, reaching values of 3 mM at 5 mm in the black layer.

Oxygenic photosynthetic activity was detected from the surface down to 3 mm (Fig. 2). The maximum oxygen production (314.02 µmol dm- 3 min- 1) was detected at 1.6 mm. From 3 mm, just below oxygen-sulfide interface, to 4.2 mm, at a zone where the purple layer occurred, there was a high level of sulfide oxidation mediated by phototrophic processes (Fig. 2). The mean value of sulfide oxidation was 188.8 µmol dm- 3 min- 1.
The effect of light vs. time on oxygenic photosynthetic activity can be observed in Fig. 3. During the first 2 h of illumination, oxygen production greatly increased. The high slope indicates a very efficient photosynthetic process. From 2- 10 h of continuous light, no change in the oxygen production rate was detected. Finally, after 10 h of light, there was a clear decrease in oxygen production.

Discussion
The vertical distribution of colored layers and major phototrophic populations found in the microbial mat samples analyzed in this study are similar to those observed in well developed mats reported earlier [18]. Depth profiles of photosynthetic biomass (see Table 1) correlated with profiles of chlorophyll a and bacteriochlorophyll a, the predominant pigments found in these mats. In the photic zone of the Ebro Delta microbial mats, oxygenic phototrophs constituted about 58% of total photosynthetic biomass, measured as biovolume, whereas anoxygenic phototrophic biomass represented only 42%. Diatoms made up 11.8% of total oxygenic phototrophic biovolume. Among all cyanobacteria evaluated, M. chthonoplastes was the most abundant, reaching 61.2% of total photosynthetic biomass, whereas L. aestuarii and coccoid cyanobacteria represented only 20.6% and 6.4%, respectively.
Oxygen production measured in the laboratory at 1000 µE m- 2 s- 1, after 2 h of light, was about 27.2 mmol O2 m- 2 h- 1. Assuming a C/O2 ratio of 1 [5], it can be considered that, under these conditions, 326.4 mg C m- 2 h- 1 were photoassimilated by oxygenic phototrophic organisms inhabiting the mat. These values are higher than those reported in other microbial mats located in marine environments, such as Mellum Island, and slightly higher than those found in Solar Lake or Spencer Gulf (Table 2). In all of these mats, M. chthonoplastes is the predominant oxygenic phototrophic organism.

The study of evolution of oxygenic photosynthetic activity along a simulated diel cycle was carried out under constant light intensity. Maximum activity occurred after 2 h of light at 1000 µE m- 2 s- 1, whereas oxygenic photosynthesis decreased only after 10 h of light (see Fig. 3). Photosynthetic activity depends on proportion of sunlight that falls on the organism, the efficiency with which that light is harvested, and nutrient accessibility. Several stress factors can contribute to limit the process, such as irradiance excess or carbon dioxide depletion. Nevertheless, the results obtained show that the system functions with high efficiency over a long period of time. These data support observations on the lack of photoinhibition in the field [2,25]. Under natural conditions, however, changes in light intensity during a diel cycle also contribute to prevent photoinhibition.
There are many microbial mats in which anoxygenic photosynthesis does not play a relevant role in primary production [13]. In those cases, oxygen production is high enough to supersaturate pore water and to move the oxygen-sulfide interface down to layers not reached by light. Under these conditions, sulfide will be oxidized mainly by chemotrophic bacteria [12]. In Ebro Delta mats, sulfide oxidation in the light was estimated by the disappearance of sulfide in the illuminated mat. In summer, when the pink layer reached its maximal development, sulfide consumption was calculated to be 188.8 µmol S dm- 3 min- 1. This value is very similar to that found in mats from salterns of Salins-de-Giraud [4]. Considering that the pink layer is 1.64 mm thick and assuming a S/C ratio of 2 [5], carbon assimilation in this layer has been estimated to be 111.5 mg C m- 2 h- 1.
As carbon assimilation from oxygenic photosynthesis, calculated under the same conditions, was about 326 mg C m- 2 h- 1, anoxygenic photosynthesis represents about 26% of total organic carbon production in our samples. Several studies have reported the contribution of anoxygenic phototrophic bacteria to the carbon cycle in such ecosystems. For example, in Guerrero Negro mats, 22- 46% of primary production is due to anoxygenic phototrophic bacteria [10], whereas in Salins-de-Giraud salterns the contribution of these phototrophs is about 85% [4]. Thus, our study, as well as the other examples discussed, addresses the relevant role of anoxygenic phototrophic bacteria as primary producers in the illuminated layer of coastal microbial mats.
There is little information available about the chemosynthetic carbon fixation in microbial mats. Carbon fixation in the dark has not been always taken into account in studies of organic matter generation. In the Ebro Delta microbial mats, carbon fixation in the dark has not been evaluated; however, an indirect calculation can be made. In these communities, sulfide production in the top 2 mm of the black layer was 7.56 µmol cm- 3 day- 1 [17]. Considering that the black layer is 3.8 cm thick, integrated sulfide production will be about 287.3 mmol m- 2 day- 1. Thus, about 78% of sulfide produced by sulfate-reducing bacteria will be consumed by anoxygenic phototrophic bacteria. Moreover, considering that 10% of sulfide produced precipitates with ionic metals [11], and without taking into account the fraction of sulfide reoxidized by means of chemical reaction with oxygen, 35.3 mmol S m- 2 day- 1 could be oxidized chemolitotrophically by colorless sulfur bacteria. Assuming a S/C ratio of 4 [14], carbon assimilation by these organisms can be estimated to be 4.4 mg C m- 2 h- 1; this means that about 1% of carbon fixation is carried out by these organisms in the mat of Ebro Delta.
The values obtained are similar to those found in other mats. For example, in mats from Eastern Passage, which consist mainly of Beggiatoa sp., values for carbon fixation in the dark are 1.6 mg C m- 2 h- 1 [7]. In mats from the Bahamas, where oxygenic photosynthetic organisms are predominant and anoxygenic photosynthesis is negligent, dark fixation was about 2.4- 7.0 mg C m- 2 h- 1 [22]. Nevertheless, in the Ebro Delta mats, the percentage of dark fixation is lower than that in the Bahamas mats, where it constitutes 8- 20% of total organic carbon production, or in the Guerrero Negro mats, where it constitutes 2- 12% [10].
Primary producers inhabiting the studied microbial mat generate organic matter that is further degraded via aerobic or fermentative pathways, providing low-molecular-weight organic compounds. In turn, these compounds can be used as energy sources by sulfate-reducing bacteria, which are widely distributed in this kind of environment and are responsible for producing sulfide for anoxygenic photosynthesis [3,16,22,28]. Thus, photosynthetic metabolism, coupled with catabolic pathways, contributes to the turnover of carbon and sulfur cycles in these marine environments.
Acknowledgements. We thank the Ebro Delta Natural Park Service (Generalitat de Catalunya) and Salines Trinitat for permission to collect samples. We also thank Dr. Jordi Mas for his helpful discussions, and O. Pringault for his valuable technical help with needle mini-electrodes. This work was supported by Spanish grant DGICYT PB97-0193 to IE and EU grant EVK3-CT-1999-00010 to IE and RG.
References
1. Bauld J (1984) Microbial mats in marginal marine environments: Shark Bay, Western Australia and Spencer Gulf, South Australia. In: Cohen Y, Castenholz RW, Halvorson H O (eds) Microbial Mats: Stromatolites. Alan R. Liss, New York, pp 39- 58 [ Links ]
2. Cadée GC, Hegeman J (1974) Primary production of the benthic microflora living on tidal flats in the Dutch Wadden Sea. Neth J Sea Res 8:260- 291 [ Links ]
3. Canfield DE, Des Marais DJ (1993) Biogeochemical cycles of carbon, sulfur and free oxygen in a microbial mat. Geochim Cosmochim Acta 57:3971- 84 [ Links ]
4. Caumette P, Matheron R, Raymond N, Relexans JC (1994) Microbial mats in the hypersaline ponds of Mediterranean salterns (Salins-de-Giraud, France). FEMS Microbiol Ecol 13:273- 286 [ Links ]
5. Danks SM, Evans EH, Whittaker PA (1983) Photosynthetic Systems. Structure, Function and Assembly. Wiley, New York [ Links ]
6. García-Pichel F, Mechling M, Castenholz RW (1994) Diel migrations of microorganisms within a benthic, hypersaline mat community. Appl Environ Microbiol 60:1500- 1511 [ Links ]
7. Grant J, Bathmann UV (1987) Swept away: resuspension of bacterial mats regulates benthic-pelagic exchange of sulfur. Science 236:1472- 1474 [ Links ]
8. Grotzschel S, Abed RM, de Beer D (2002) Metabolic shifts in hypersaline microbial mats upon addition of organic substrates. Environ Microbiol 4:683- 695 [ Links ]
9. Guerrero R, Mas J (1989) Multilayered microbial communities in aquatic ecosystems: growth and loss factors. In: Cohen Y, Rosenberg E (eds) Microbial Mats, Physiological Ecology of Benthic Microbial Communities. ASM, Washington DC, pp 37- 51 [ Links ]
10. Javor BJ, Castenholz RW (1984) Productivity studies of microbial mats, Laguna Guerrero Negro, Mexico. In: Cohen Y, Castenholz RW, Halvorson HO (eds) Microbial Mats: Stromatolites. Alan R. Liss, New York, pp 149- 170 [ Links ]
11. Jørgensen BB (1977) The sulfur cycle of a coastal marine sediment (Limfjorden, Denmark). Limnol Oceanogr 22:814- 832 [ Links ]
12. Jørgensen BB, Des Marais DJ (1986) Competition for sulfide among colorless and purple sulfur bacteria in cyanobacterial mats. FEMS Microbiol Ecol 38:179- 186 [ Links ]
13. Jørgensen BB, Revsbech NP, Cohen Y (1983) Photosynthesis and structure of benthic microbial mats: microelectrode and SEM studies of four cyanobacterial communities. Limnol Oceanogr 28:1075- 1093 [ Links ]
14. Kelly DP (1982) Biochemistry of the chemolithotrophic oxidation of inorganic sulphur. Phil Trans R Soc Lond B 298:499- 528 [ Links ]
15. Lassen C, Ploug H, Jørgensen BB (1992) Microalgal photosynthesis and spectral scalar irradiance in coastal marine sediments of Limfjorden, Denmark. Limnol Oceanogr 37:760- 772 [ Links ]
16. Minz D, Flax JL, Green SJ, Muyzer G, Cohen Y, Wagner M, Rittmann BE, Stahl DA (1999) Diversity of sulfate-reducing bacteria in oxic and anoxic regions of a microbial mat characterized by comparative analysis of dissimilatory sulfite reductase genes. Appl Environ Microbiol 65:4666- 4671 [ Links ]
17. Mir J, Martínez-Alonso M, Caumette P, Guerrero R, Esteve I (2002) Sulfide fluxes in a microbial mat from the Ebro Delta, Spain. Int Microbiol 5:133- 138 [ Links ]
18. Mir J, Martínez-Alonso M, Esteve I, Guerrero R (1991) Vertical stratification and microbial assemblage of a microbial mat in the Ebro Delta (Spain). FEMS Microbiol Ecol 86:59- 68 [ Links ]
19. Nicholson JAM, Stolz JF, Pierson BK (1987) Structure of a microbial mat at Great Sippewissett Marsh, Cape Cod, Massachusetts. FEMS Microbiol Ecol 45:343- 364 [ Links ]
20. Paerl HW, Pinckney JL, Steppe TF (2000) Cyanobacterial-bacterial mat consortia: examining the functional unit of microbial survival and growth in extreme environments. Environ Microbiol 2:11- 26 [ Links ]
21. Pierson BK, Parenteau MN, Griffin BM (1999) Phototrophs in high-iron-concentration microbial mats: physiological ecology of phototrophs in an iron-depositing hot spring. Appl Environ Microbiol 65:5474- 5483 [ Links ]
22. Pinckney J, Paerl HW, Reid RP, Bebout B (1995) Ecophysiology of stromatolitic microbial mats, Stocking Island, Exuma Cays, Bahamas. Microb Ecol 29:19- 37 [ Links ]
23. Revsbech NP (1994) Analysis of microbial mats by use of electrochemical microsensors: Recent advances. In: Stal L, Caumette P (eds) Microbial Mats: Structure, Development and Environmental Significance. NATO ASI Series, Vol. G 35. Springer-Verlag, Heidelberg, pp. 135- 147 [ Links ]
24. Revsbech NP, Jørgensen BB (1983) Photosynthesis of benthic microflora measured with high spatial resolution by the oxygen microprofile method: capabilities and limitations of the method. Limnol Oceanogr 28:749- 756 [ Links ]
25. Revsbech NP, Ward DM (1983) Oxygen microelectrode that is insensitive to medium chemical composition: use in an acid microbial mat dominated by Cyanidium caldarium. Appl Environ Microbiol 45:755- 759 [ Links ]
26. Revsbech NP, Jørgensen BB, Blackburn TH, Cohen Y (1983) Microelectrode studies of the photosynthesis and O2, H2S, and pH profiles of a microbial mat. Limnol Oceanogr 28:1062- 1074 [ Links ]
27. Stal LJ (2000) Cyanobacterial mats and stromatolites. In: Whitton B, Potts M, (eds) The Ecology of Cyanobacteria. Their Diversity in Time and Space. Kluwer Academic Pub., Dordrecht, pp 61- 120 [ Links ]
28. Teske A, Ramsing NB, Habicht K, Fukui M, Küver J, Jørgensen BB, Cohen Y (1998) Sulfate-reducing bacteria and their activities in cyanobacterial mats of Solar lake (Sinai, Egypt). Appl Environ Microbiol 64:2943- 2951 [ Links ]
29. Van Gemerden H, Tughan CS, de Wit R, Herbert R (1989) Laminated microbial ecosistems on sheltered beaches in Scapa Flow, Orkney Islands. FEMS Microbiol Ecol 62:87- 102 [ Links ]
30. Villbrandt M, Stal LJ, Krumbein WE (1990) Interactions between nitrogen fixation and oxygenic photosynthesis in a marine cyanobacterial mat. FEMS Microbiol Ecol 74:59- 72 [ Links ]

