


My SciELO
 Custom services
Services on Demand
Journal
Article
 text in
  English (pdf)
 Article in xml format
 Article references
 Send this article by e-mail
Indicators
-
 Cited by SciELO
 -
 Access statistics
Related links
-
 Cited by Google
 -
 Similars in
SciELO
Similars in
SciELO -
 Similars in Google
Share

 Permalink
Enfermería Global
On-line version ISSN 1695-6141
Enferm. glob. vol.22 n.69 Murcia Jan. 2023 Epub Mar 20, 2023
https://dx.doi.org/10.6018/eglobal.521971
Originals
The Kermack-McKendrick model in the spread of COVID-19 strains: Peru 2020-2021
1Universidad Nacional Experimental Francisco de Miranda, Punto Fijo, Venezuela. josefrankpl@gmail.com
Introduction:
The SIR epidemic model is useful for measuring the rate of spread of COVID-19 strains (B.1.617.2/P.1/C.37/B.1.621), in terms of epidemiological threshold R0 over time.
Objective:
To evaluate a mathematical model of differential type, typical of the behavior of COVID-19 for the Peruvian collective.
Methods:
A differential mathematical model of the behavior of the pandemic was developed for the Peruvian collective, based on the experience in the control of Kermack-McKendrick infections. The number of susceptible S, infected and spreading infection I and recovered R was estimated, using official datasets from the World Health Organization, based on the history between March 7 and September 12, 2020 and; projected for 52 weeks until September 11, 2021.
Results:
The lowest rate of infections will occur from April 3, 2021. Evidencing a prognosis of lower transmissibility for May 29, 2021 with an infected rate (β=0.08) and threshold (R0=0.000), the accuracy of the model was also quantified at 97.795%, with 2.205% of average percentage error, with the temporary average value being R0 <1, so each person who contracts the disease will infect less than one person before dying or recovering, so the outbreak will disappear.
Conclusion:
The curve of infections in Peru will depend directly on mitigation measures to curb the spread of infection and predict sustained transmission through vaccination against covid-19 type strains; with the observance of people of preventive measures.
Keywords: infected; recovered; spread; susceptible; threshold
INTRODUCTION
Dynamic models are useful to useful the behavior of an infection when it manifests itself in a collectivity and investigate under which scenarios it will be mitigated or eradicated 1). At present, COVID-19 is of great concern to science, central, local governments, and all people due to the rapid spread of infection and the considerable number of deaths that occur 2). The virus that causes COVID-19 is primarily transmitted through droplets generated when an infected individual coughs, sneezes, or exhales. These droplets are dense to hang in the air and by gravity effect fall on the surface 3. Confirmed coronavirus cases reached four million in 187 countries, and approximately 295,000 people have lost their lives due to this virus.
The evolution of the infection between the end of January and the beginning of February 2020 marks the beginning of a new model of behavior for a new infectious disease in the world, taking center stage the Emergency Committee for the International Health Regulations of the World Health Organization. The entity issued the SARS-CoV-2 outbreak as a Public Health Emergency of International Concern, PHEIC. 4. By February 6, 24554 confirmed cases had already been reported on the planet, of which 99.2% were in China, and the remaining 0.8% in Asia, Europe and the United States. From that moment the spread of the virus begins globally.
By 2020, the Peruvian population is estimated at 32 million 626 thousand inhabitants. The demographics of the country indicate that there will be 568,000 births and 192,000 deaths, not including COVID-19 infection, in turn a positive net migration of 57,000 inhabitants. Therefore, in 2020 the entire population will grow exponentially by 433 thousand inhabitants 5).
The first cases of COVID-19 in Peru were confirmed on March 10, in the Metropolitan Lima region. For the beginning of the investigation, Peru registers 738020 infected and 30927 dead in its accumulated 6.
Researchers have been watching the spread of the virus, have come together to speed up the most assertive diagnoses, and are working on a number of vaccines to protect against COVID-19 7). In the present study, a Kermack-McKendrick epidemic model or also called SIR modified to project the real number of infected cases is developed; is measured with the epidemiological threshold parameter (R0) 8,9. The research aims to evaluate a mathematical model of a differential type, typical of the behavior of COVID-19 for the Peruvian collective, building on Kermack-McKendrick's infection control expertise.
METHODOLOGY
The research applied theoretical and empirical methodology for the understanding of the WHO COVID-19 statistical data set for Peru, based on documentary and bibliographic analysis 10). Direct observation was used for the construction of the indicators, in conjunction with Kermack-McKendrick modeling.
The SIR model, which connects the number of susceptible S, infected and spreading infection I and recovered people R, was applied. The parameters of this model were estimated using the individual and cumulative number of cases 11). Validating the results with Holt-Winters exponential smoothing and thus measuring the goodness of fit of the model 12. The hypothesis of the research is: The Kermack-McKendrick model explains the speed of spread of COVID-19 strains (B.1.617.2/P.1/C.37/B.1.621) in the context of the Peruvian collective.
Kermack-McKendrick model
The Kermack-McKendrick model is an SIR model (susceptible, infected, recovered) for the number of people infected with COVID-19, applied in the Republic of Peru, based on the historical one between March 7 and September 12, 2020 and projected until September 11, 2021. It was proposed to explain the growth and decrease in the number of infected patients, taking as a representative value the epidemiological threshold R0(13. It is assumed that the population size is fixed, the incubation period of the infectious agent from 5 to 14 days and the duration of infectivity is the same as the duration of the disease 14)."
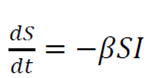
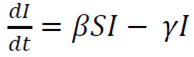
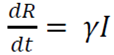
The model consists of a system of three articulated nonlinear ordinary differential equations:
 (1)
(1)
 (2)
(2)
 (3)
(3)
Where
t is time
S is the number of susceptible people
I is the number of infected patients
R is the number of people who have recovered and developed, immunity to infection
β is the infection rate
γ is the recovery rate
The conditions for the interpretation of the model are as follows:
- When R0 <1, each person who contracts the disease will infect less than one person before dying or recovering, so the outbreak will disappear (dI/dt <0).
- When R0> 1, each person who contracts the disease will infect more than one, so the epidemic will spread (dI/dt>0) 15)."
The key value that governs the temporal evolution of these equations is the so-called epidemiological threshold,
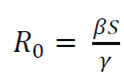 (4)
(4)
Holt-Winters exponential smoothing
Holt-Winters is a robust technique for constructing time series with additive tendency 16). The recursive form of the Holt-Winters exponential smoothing equation is expressed as follows:
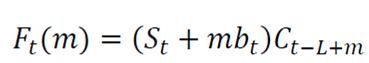 (5)
(5)
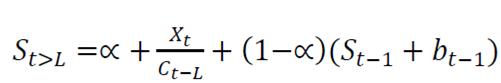 (6)
(6)
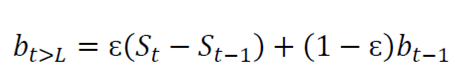 (7)
(7)
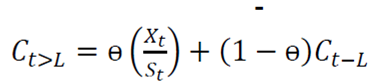 (8)
(8)
Where:
Xt is the value of the time series in time t.
L is the length of the season or duration.
St is an estimate of the smoothing of the level component.
bt is an estimate of the smoothing of the trend component.
Ct is an estimate of the smoothing of the seasonal index component.
α is the level of smoothing coefficient.
ɛ is the trend of the smoothing coefficient.
ɵ is the seasonal smoothing coefficient.
Ft (m) is the forecast value of smoothing in the forward step m for X in time t.
Three simple exponential series not dependent on level, trend and seasonal were assessed. They are interdependent in the sense that the three components must be updated every period. The study was based on the history of infected, deaths and recovered in Peru, with a projection of 52 weeks 17).
RESULTS
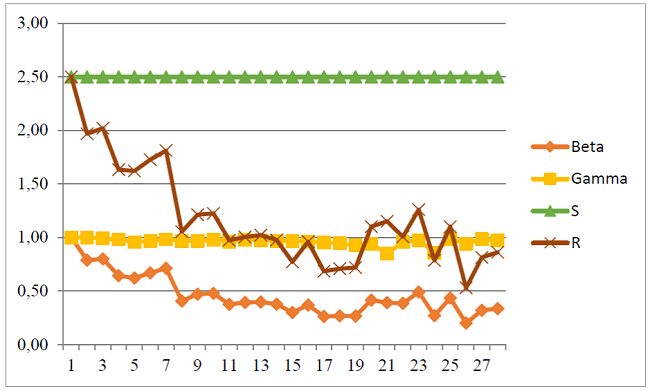
Figure 1 shows the behavioral trend of the rate of infections β, recovery rate γ, number of susceptible people S and the epidemiological threshold R, calculated by the Kermack-McKendrick model; for 28 weeks of COVID-19 pandemic from March 07 to September 12, 2020. Week 1 represents an R0 of 2.50, but that at week 5 stood at 1.62, increasing in week 7 by 1.81 and so on until reaching week 28 with a value of 0.86. This value represents the number of people who are infected by an infected person. Therefore, as R0 <1, each person who contracts the disease will infect less than one person before dying or recovering, so the outbreak will disappear.
Subsequently, with the data obtained from Kermack-McKendrick, the behavior of COVID-19 was projected, with exponential smoothing for 52 weeks; estimating the threshold R0 and predicting the mitigation and eradication of the disease.
SIR projection model
In Table 1, the ASM estimates at 20.427 the average percentage of the forecast error a step forward for the epidemiological threshold R0, on average the prognosis is correct in a percentage difference of 79.573. The MPE value for the series is 2.205 and manifests the average percentage error, that is, between the prediction and the real values. In this sense, the future forecast for the end of 2021 quantifies an accuracy of the model at 97.795%, these are the statistics that make the prediction dependable.
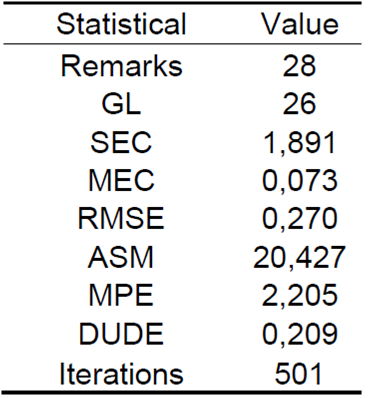
Figure 2 shows the prediction of the infection rate β from the history of the pandemic, from March 7 to September 12, 2020 and projected until September 11, 2021. As seen in the blue dimming points; as there is a trend of decrease in the slope of distribution since August 8, 2020 (β = 0.379), with a second peak two weeks after August 22 (β = 0.354), which varies according to the number of daily infected.
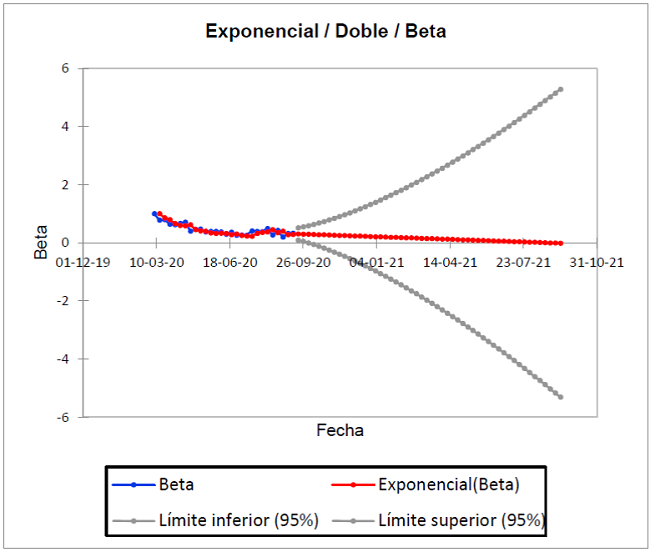
The gray dots show the best and worst scenario. It is important to observe in the ideal Kermack-McKendrick model, which estimates for the best, a decrease in those infected from January 16, 2021 and for the worst, an increase from December 21, 2021. Now, the actual trend is explained in the red trend line, whose forecast based on the historical one is 0 infected by August 28, 2021 (β=0.001). It should be explained that the number of susceptible people is constant 2.5, that is, if the confinement measures are relaxed; there is a greater probability of contagion.
Figure 3 shows the prediction of recovered γ from the history of the pandemic, from March 7 to September 12, 2020 and projected until September 11, 2021. As seen in the blue dimming points; since there is a pronounced increase in the pending distribution on two dates; August 22 (γ=0.987) and September 5 (γ=0.984) of 2020, but which decreases on September 12 (γ=0.972).
The gray dots show the best and worst scenario. It is important to observe in the ideal Kermack-McKendrick model, which estimates for the best, a decrease in those recovered from October 24, 2020 and for the worst, an increase from January 16, 2021. Now, the real trend is explained in the red trend line, whose forecast based on the historical one is 88.50% recovered by September 11, 2021. This means that at least 88.50 people will recover for every one hundred infected.
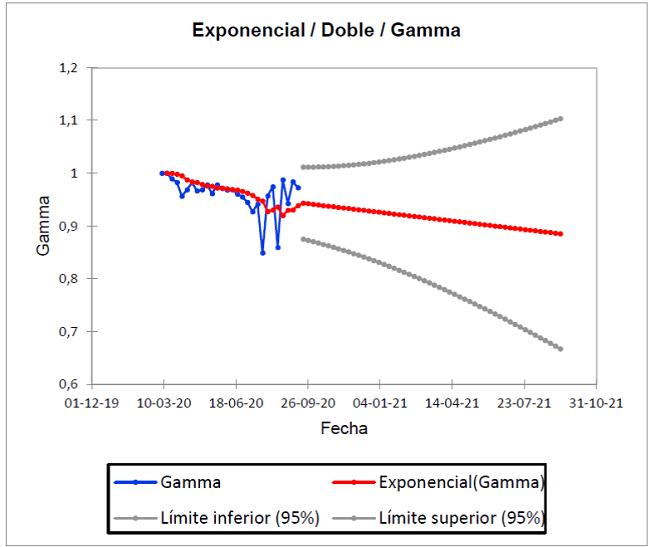
Figure 4 shows the prediction of deaths from the history of the pandemic, from March 7 to September 12, 2020 and projected until September 11, 2021. As seen in the blue dimming points; as there is a pronounced decrease in the slope of distribution since September 5, 2020 (R0 = 0.724), but that decreases since September 5, increasing in the week of September 12 again (R0 = 0.738).
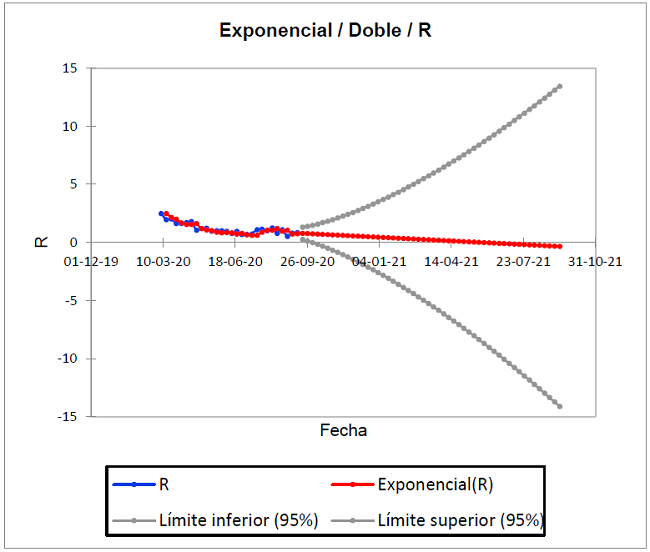
In the ideal Kermack-McKendrick model, the actual trend is explained in the red line, whose forecast based on the historical is (R 0=0.000) for May 29, 2021. When R0 <1, each person who contracts the disease will infect less than one person before dying or recovering, so the outbreak will disappear; if R0> 1, each person who contracts the disease will infect more than one. Based on this, the result of the exponential simulation for May 29 explains that there will be no infected or susceptible, considering the disease eradicated. These results are representative of 501 iterations of the model.
Table 2 shows the predictions of the next 52 weeks of COVID-19 behavior, in relation to the historical data of the Kermack-McKendrick model. The results are statistically significant, since the value of the epidemiological threshold (R0=0.00) for the week of May 29, 2021, represents the eradication of the disease, with a rate of infected (β=0.08). This in turn will decrease completely (β=0.00) by the week of August 28, 2021.
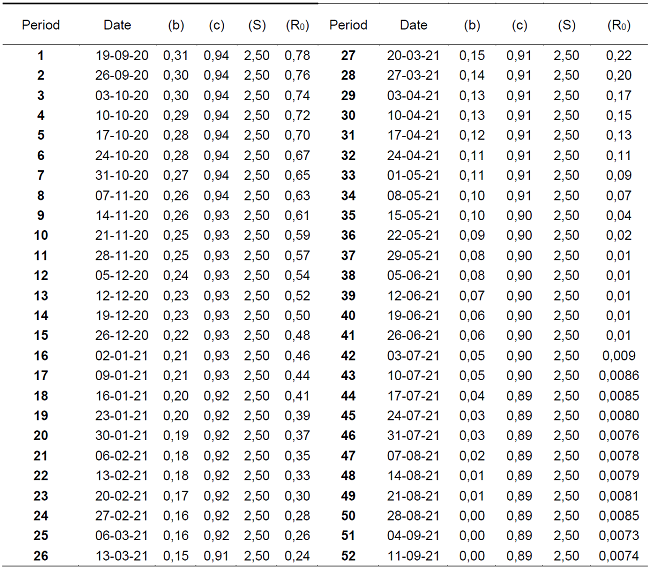
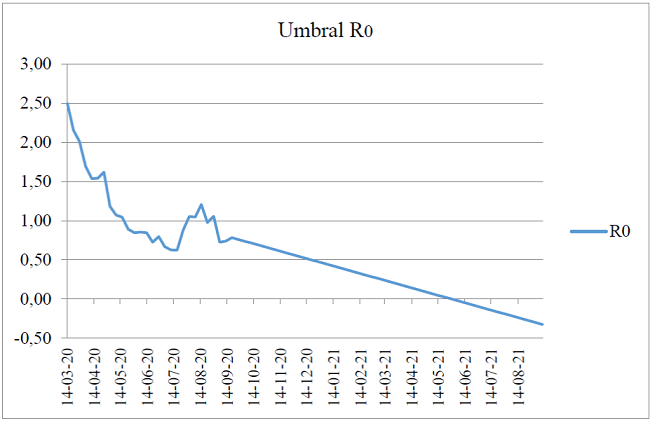
Figure 5 models the COVID-19 contagion curve from March 14, 2020 to September 11, 2021 for the Republic of Peru; with the representativeness of three peaks of growth in the same month, specifically for August 2020, with a decreasing trend for the first days of September. However, it again experiences a peak on the 19th of the same month. This has been the behavior of the pandemic during six continuous months of confinement measures by the central government.
Finally, the forecast of the Holt-Winters simulation explains that if the decrease in the contagion curve is maintained; this will experience its end by May 29, 2021, whose cut-off point with the date axis is seen in the Figure. The estimates are consistent with the epidemiological analysis of the first 28 weeks of the pandemic in Peru 18). In this sense, the research hypothesis is confirmed: The Kermack-McKendrick model explains the speed of spread of COVID-19 in the context of the Peruvian collective.
Based on the results of the study, it is recommended to adopt flexible mitigation measures as of April 10, 2021, where the lower transmissibility of the strains is observed (B.1.617.2/P.1/C.37/B.1.621). The Kermack-McKendrick model since September 12, 2020, maintains the threshold of contagion with a value R0 <1, therefore, each person who contracts the disease will infect less than one person before dying or recovering, so transmissibility will decrease.
DISCUSSION
The authors have developed a dynamic simulation model for the Republic of Peru in the period 2020-2021; this is an analytical simulation based on Kermack-McKendrick's SIR principles, with historical DATA from the COVID-19 Dashboard by the Center for Systems Science and Engineering (CSSE) at Johns Hopkins University (JHU) 19; and projected with Holt-Winters exponential smoothing additive trend. The differential model of the study explained the rates of susceptible, infected and recovered with a level of accuracy of 79.5%, a difference of one percentage point compared to the results of Viña and Pernalete 20), who demonstrated a success of 80.5%. The difference between the two models was in the strains, for this research they were taken a (B.1.617.2/P.1/C.37/B.1.621), while the compared only took to (B.1.617.2/P.1/C.37). That is, the variant B.1.621 (Mu), detected in January 2021 in Colombia, was included. It is reasonable that, by including an additional strain, the percentage of restraint decreased.
The results are in line with those of Kucharski et al. 21),the model applied in Wuhan, China; it recorded exponential growth in cases that emerged in early January 2020, an increasing number of export cases between January 15 and 23, 2020, and the infection rate was measured on ten evacuation flights from Wuhan to seven countries; where 94.8% of the population remained susceptible. as of January 31, 2020. In the case of susceptible in Peru, the dynamics showed 94% until the first half of 2020, with a decrease to 91% until September 2021. These results may be influenced by emergency protocols in the primary care of patients with COVID-19, since the evolution of the infection made it necessary to verify that the patient is negative in coronavirus by Polymerase Chain Reaction (PCR) and, therefore, corroborate that he no longer has the virus.
Consequently, the authors Ramírez et al. 22 described the behaviors of the second and third epidemic outbreaks of COVID-19 for the province of Santiago de Cuba applying the SEIR model. The results of the simulation show evidence in the decrease in active cases, with variation in the reproduction curve to a more negative slope, a discovery that was observed as of September 26, 2021. This change of slope suggests the pre-existence of synergistic factors that counterbalance the growth of the infection, occur at par and predominate on prospective scales.
In this way, in Peru the real trend is explained in the forecast of 88.50% of recovered by September 11, 2021, in agreement with the authors. This means that at least 88.50 people will recover for everyone hundred infected. Both studies allow us to infer that the peak of the infection (crest of the wave) takes on average 12 weeks, with a constant in its reproduction of 26 weeks from the appearance, and a decrease or less transmissibility from week forty.
In a study carried out in Uganda by Mugisha et al. 23),the results showed that this disease will not disappear, they even proposed that the scenario of halving the number of imports will not have an immediate effect, since the epidemic will continue to grow exponentially for several months, the disease will persist in the country beyond the simulation time of 1 year. Even more worrying is the fact that prevalence was higher at the highest levels of the susceptible population. Similar findings occurred in Peru, the SIR model applied for 52 weeks evidenced a trend of infected in decrease from 31% to 15%, under the faithful fulfillment of the rules of social confinement of importation of the virus.
In the study it was confirmed that the strains (B.1.617.2/P.1/C.37/B.1.621), had a lower transmissibility of the infection until November 2021, where their aggressiveness decreased on average to (Ro = 0.24). However, on that date the Ómicron variant (B.1.1.529) begins, specifically on November 24 in South Africa and on December 19, 2021 in Peru (24). The appearance of Ómicron in Peru was recorded on December 19, 2021 in 10 regions as it should be noted that to intelligently use growth rates based on specific R values and make assertive public health decisions, other issues must be addressed, such as the collection of data that are necessary to generate standardized estimates with strict confidence intervals Ridenhour et al. 25.
Based on the random difference of strains mentioned in this research, Hellewell et al.26 recently predicted the efficacy of contact tracing and isolation of COVID-19 cases using patterns other than Ro. In analogy with the authors, the likelihood of control decreases transmissibility with increased isolation, fewer cases proven by contact tracing, and increased transmission before symptoms.
Therefore, the Kermack-McKendrick model explained the speed of spread of COVID-19 strains (B.1.617.2/P.1/C.37/B.1.621) in the context of the Peruvian collective, and accommodates the continuation of this dynamic modeling, but with the inclusion of the B.1.1.529 strain (ómicron). The authors recommend making this estimate for the second half of 2022, when the data would be more accurate for the study.
CONCLUSION
The pattern of behavior of the strains (B.1.617.2/P.1/C.37/B.1.621) COVID-19 for the Republic of Peru, was modeled by means of Kermack-McKendrick differential equations, specifically to measure the epidemiological threshold variable R0, also known as the contagion curve index, which contribute to the epidemiological assessment, that is, to determine the number of people infected by contact with a single infected person before their death or recovery. Modeling began on September 12, 2020; the forecast of the 52 weeks of the pandemic evidenced an eradication forecast for May 29, 2021 with an almost zero infection rate (β=0.08), considering transmission by contact as one of the main routes of COVID-19.
In this sense, the forecast for mid-2021 quantifies an accuracy of the model at 97.795%, these are the statistics that make the prediction dependable; with an average value R0 <1, therefore, each person who contracts the disease will infect less than one person before dying or recovering, so the outbreak will disappear. As a result, it is confirmed that the Kermack-McKendrick model explains the speed of spread of COVID-19 in the context of the Peruvian collective. The contagion curve for Peru will depend directly on the mitigation measures that aim to slow the spread of infection and anticipate sustained transmission until we have a vaccine to suppress COVID-19; provided that preventive measures are implemented by the population.
In general, the best prognosis of the Kermack-McKendrick model explained that the lowest rate of infections will occur from April 3, 2021, where the contagion curve will begin to show a steep decline slope, until disappearing completely in mid-May 2021.
The model is adjusted to the context of propagation of the strains (B.1.617.2/P.1/C.37/B.1.621). However, the start of omicron in November 2021, with a transmissibility pattern different from that assessed in this study, is a matter of study in the medium term, with the premise of knowing the population dynamics of the SARS-CoV-2 virus.
REFERENCIAS
1. Díaz-Pinzón J. E. Uso de modelo predictivo para la dinámica de transmisión del COVID-19 en Colombia. Revista Repertorio De Medicina Y Cirugía. 2020; 34-44. Disponible en: https://doi.org/10.31260/RepertMedCir.01217372.1056 [ Links ]
2. Correa-Cuadros, J., & Muñoz-Rodríguez, M. SARS-COV.2/COVID-19 en Colombia: tendencias, predicciones y tensiones sobre el sistema sanitario. Revista de Salud Pública. 2020;22(2): e386614. Disponible en: https://dx.doi.org/10.15446/rsap.v22n2.86614 [ Links ]
3. World Health Organization. Visible body: WHO Coronavirus Disease (COVID-19) Dashboard. Ginebra, SUI.: WHO Health Emergency Dashboard. 2020. Disponible en: https://covid19.who.int/ [ Links ]
4. Caparó, F., & Del Carmen S., J. Coronavirus y las amenazas a la salud mundial. Horizonte MéDico (Lima). 2020;20(1): 4-5. Disponible en: https://doi.org/10.24265/horizmed.2020.v20n1.01 [ Links ]
5. Enoki-Miñano, E, & Ruiz-Barrueto, M. Danger of major outbreaks of COVID-19 in the Peruvian prison population. Revista Española de Sanidad Penitenciaria. 2020;22(2): 91-92. Disponible en: https://dx.doi.org/10.18176/resp.00016 [ Links ]
6. Maguiña-Vargas, C. Reflexiones sobre el COVID-19, el Colegio Médico del Perú y la Salud Pública. Acta Médica Peruana. 2020;37(1): 8-10. Disponible en: https://dx.doi.org/10.35663/amp.2020.371.929 [ Links ]
7. Lozano-Vargas, A. Impacto de la epidemia del Coronavirus (COVID-19) en la salud mental del personal de salud y en la población general de China. Revista de Neuro-Psiquiatría. 2020;83(1): 51-56. Disponible en: https://dx.doi.org/10.20453/rnp.v83i1.3687 [ Links ]
8. Paiva H.M., Afonso R.J.M., de Oliveira I.L., Garcia G.F. A data-driven model to describe and forecast the dynamics of COVID-19 transmission. PLoS ONE. 2020;15(7): e0236386. Disponible en: https://doi.org/10.1371/journal.pone.0236386 [ Links ]
9. Zhao, S., Chen, H. Modeling the epidemic dynamics and control of COVID-19 outbreak in China. Quant Biol. 2020;8: 11-19. Disponible en: https://doi.org/10.1007/s40484-020-0199-0 [ Links ]
10. Trujillo Sainz, J. Metodología para la organización de los Recursos Educativos Abiertos en la carrera de Educación Laboral-Informática. Mendive. Revista de Educación. 2020;18(1): 102-115. Disponible en: http://mendive.upr.edu.cu/index.php/MendiveUPR/article/view/1672 [ Links ]
11. Manrique-Abril, F., Agudelo-Calderon, C., González-Chordá, V., Gutiérrez-Lesmes, O., Téllez-Piñerez, C., & Herrera-Amaya, G. Modelo SIR de la pandemia de COVID-19 en Colombia. Revista de Salud Pública. 2020;22(2): e185977. Disponible en: https://dx.doi.org/10.15446/rsap.v22.85977 [ Links ]
12. Abdulmajeed, K., Adeleke, M., & Popoola, L. Onlineforecasting of COVID-19 cases in Nigeria using limited data. Journal Data in Brief. 2020;20(1). Disponible en: https://doi.org/10.1016/j.dib.2020 [ Links ]
13. Pinasco, J. P. Las Simulaciones: Otras herramientas para entender una epidemia. Revista De Educación Matemática. 2020;35(2): 35-50. Disponible en: https://revistas.unc.edu.ar/index.php/REM/article/view/29728 [ Links ]
14. Kaxiras, E., Neofotistos, G., & Angelaki, E. The first 100 days: Modeling the evolution of the COVID-19 pandemic. Chaos, Solitons and Fractals. 2020;138. Disponible en: https://doi.org/10.1016/j.chaos.2020.110114 [ Links ]
15. Arango-Londoño, D., Ortega-Lenis, D., Muñoz, E., Cuartas, D., Caicedo, D., Mena, J., Torres, M., & Méndez, F. Predicciones de un modelo SEIR para casos de COVID-19 en Cali, Colombia. Revista de Salud Pública. 2020;22(2): 1-6. Disponible en: https://doi.org/10.15446/rsap.v22n2.86432 [ Links ]
16. Díaz-Narváez, V., San-Martín-Roldán, D., Calzadilla-Núñez, A., San-Martín-Roldán, P., Parody-Muñoz, A., & Robledo-Veloso, G. Which curve provides the best explanation of the growth in confirmed COVID-19 cases in Chile?. Revista Latino-Americana de Enfermagem. 2020;28: e3346. Disponible en: https://doi.org/10.1590/1518-8345.4493.3346 [ Links ]
17. González-Jaramillo, V., González-Jaramillo, N., Gómez-Restrepo, C., Franco, O., Palacio-Acosta, C., & Gómez-López, A. Proyecciones del impacto de la pandemia COVID-19 en la población colombiana, según medidas de mitigación. Datos preliminares de modelos epidemiológicos para el periodo del 18 de marzo al 18 de abril de 2020. Revista de Salud Pública. 2020;22(2): 1-6. Disponible en: https://doi.org/10.15446/rsap.v22n2.85789 [ Links ]
18. Du, Z., Wang, L., Cauchemez, S., Xu, X., Wang, X., Cowling, B. Riesgo de transporte de la enfermedad por coronavirus desde Wuhan a otras ciudades de China. Enfermedades infecciosas emergentes. 2020;26(5): 1049-1052. Disponible en: https://dx.doi.org/10.3201/eid2605.200146 [ Links ]
19. COVID-19 Dashboard by the Center for Systems Science and Engineering (CSSE) at Johns Hopkins University (JHU). Coronavirus resource center. 2021. Disponible en: https://coronavirus.jhu.edu/map.html [ Links ]
20. Viña, C., & Pernalete, J. Estimación del factor de propagación R0 del COVID-19 mediante el modelo Kermack-McKendrick. Sociología y Tecnociencia. 2022;12(1): 252-272. Disponible en: https://revistas.uva.es/index.php/sociotecno/article/view/4661/4557 [ Links ]
21. Kucharski, A. J., Russell, T. W., Diamond, C., Liu, Y., Edmunds, J., Funk, S., Eggo, R. M., & Centre for Mathematical Modelling of Infectious Diseases COVID-19 working group. Early dynamics of transmission and control of COVID-19: a mathematical modelling study. The Lancet. Infectious diseases. 2020;20(5): 553-558. Disponible en: https://doi.org/10.1016/S1473-3099(20)30144-4 [ Links ]
22. Ramírez-Torres, E., Selva-Castañeda, A., Bergues-Cabrales, L., Bory-Prevez, H., Valdés-García, L., Sedal-Yanes, D., Alcantara-Oliveros, Y., Sánchez-Domínguez, S., Rodríguez-Valdés, A., & Morandeira-Padrón, H. Comportamientos temporales de los casos activos y acumulados durante el segundo y tercer rebrotes epidémico de la COVID-19 para la provincia Santiago de Cuba. Anales de la Academia de Ciencias de Cuba. 2022;12(1): e1083. Disponible en: http://www.revistaccuba.cu/index.php/revacc/article/view/1083/1343 [ Links ]
23. Mugisha, J., Ssebuliba J, Nakakawa, J., Kikawa, C., Ssematimba, A. Mathematical modeling of COVID-19 transmission dynamics in Uganda: Implications of complacency and early easing of lockdown. PLoS ONE. 2021;16(2): e0247456. Disponible en: https://doi.org/10.1371/journal.pone.0247456 [ Links ]
24. Organización Mundial de la Salud. Clasificación de la variante ómicron (B.1.1.529) del SARS-CoV-2 como variante preocupante. [Comunicado de prensa]. (24 de noviembre 2021). Disponible en: https://www.who.int/es/news/item/26-11-2021-classification-of-omicron-(b.1.1.529)-sars-cov-2-variant-of-concern [ Links ]
25. Ridenhour, B., Kowalik, J. M., & Shay, D. K. Unraveling R0: considerations for public health applications. American journal of public health. 2014;104(2): e32-e41. Disponible en: https://doi.org/10.2105/AJPH.2013.301704 [ Links ]
26. Hellewell, J., Abbott, S., Gimma, A., Bosse, NI, Jarvis, CI, Russell, TW, Munday, JD, Kucharski, AJ, Edmunds, WJ, Centro para el Modelado Matemático de Enfermedades Infecciosas COVID-19 Grupo de trabajo, Funk, S. y Eggo, RM. Factibilidad de control de brotes de COVID-19 por aislamiento de casos y contactos. La lanceta. Salud global. 2020;8(4): e488-e496. Disponible en: https://doi.org/10.1016/S2214-109X(20)30074-7 [ Links ]
Received: April 23, 2022; Accepted: July 20, 2022
 Este es un artículo publicado en acceso abierto bajo una licencia Creative Commons
