


Mi SciELO
 Servicios personalizados
Servicios Personalizados
Revista
Articulo
 Inglés (pdf)
 Articulo en XML
 Referencias del artículo
 Enviar articulo por email
Indicadores
-
 Citado por SciELO
 -
 Accesos
Links relacionados
-
 Citado por Google
 -
 Similares en
SciELO
Similares en
SciELO -
 Similares en Google
Compartir

 Permalink
Pharmacy Practice (Granada)
versión On-line ISSN 1886-3655versión impresa ISSN 1885-642X
Pharmacy Pract (Granada) vol.9 no.4 Redondela oct./dic. 2011
PHARMINE REPORT
The 2011 PHARMINE report on pharmacy and pharmacy education in the European Union
Informe PHARMINE 2001 sobre la farmacia y la formación en farmacia en la Unión Europea
Atkinson J.1, Rombaut B.2
1. Executive Director, Pharmacolor Consultants Nancy. Villers, (France).
2. President, European Association of Faculties of Pharmacy. Department of Pharmaceutical Biotechnology and Molecular Biology, Faculty of Medicine and Pharmacy, Vrije Universiteit Brussels. Brussels, (Belgium).
ABSTRACT
The PHARMINE consortium consists of 50 universities from European Union member states or other European countries that are members of the European Association of Faculties of Pharmacy (EAFP). EU partner associations representing community (PGEU), hospital (EAHP) and industrial pharmacy (EIPG), together with the European Pharmacy Students' Association (EPSA) are also part of the consortium.
The consortium surveyed pharmacies and pharmacists in different settings: community, hospital, industry and other sectors. The consortium also looked at how European Union higher education institutions and courses are organised.
The PHARMINE survey of pharmacy and pharmacy education in Europe produced country profiles with extensive information for EU member states and several other European countries. These data are available at: http://www.pharmine.org/losse_paginas/Country_Profiles/.
This 2011 PHARMINE report presents the project and data, and some preliminary analysis on the basic question of how pharmacy education is adapted to pharmacy practice in the EU.
Key words: Education, Pharmacy. Pharmaceutical Services. European Union. Europe.
RESUMEN
El consorcio PHARMINE se compone de 50 universidades de estados miembros de la Unión Europea que son miembros de la Asociación Europea de Facultades de Farmacias (EAFP). También hacen parte del consorcio asociaciones representando a las farmacias comunitarias (PGEU), hospitalarias (EAHP), e industrias (EIPG), así como la Asociación Europea de Estudiantes de Farmacia (EPSA).
El Consorcio encuestó a farmacias y farmacéuticos en diferentes ámbitos: comunidad, hospital, industria y otros sectores. El consorcio también revisó como se organizan las instituciones de educación superior y los cursos en la Unión Europea.
El cuestionario PHARMINE de farmacia y educación farmacéutica en Europa produjo perfiles de países con información exhaustiva de los estados miembros de la UE y otros países europeos. Estos datos están disponibles en http://www.pharmine.org/losse_paginas/Country_Profiles/.
Este Informe PHARMINE 2011 presenta el proyecto y los datos, y algunos análisis preliminares sobre la cuestión básica de cómo se adapta la educación farmacéutica a la práctica de la farmacia en la UE.
Palabras clave: Educación en Farmacia. Servicios farmacéuticos. Unión Europea. Europa.
Introduction
In 1994 the EAFP, under the direction of P. Bourlioux, University Paris XI, France, brought out a document surveying the state of pharmacy education in the EU of that time (document available at: http://enzu.pharmine.org/media/filebook/files/Bourlioux_full_report.pdf). In 2006 the EAFP decided to repeat this study and enlarge it to European pharmacy practice. To this end the PHARMINE consortium was created amongst EAFP members.
The PHARMINE consortium, created in 2008, consists of 50 universities from EU member states or other European countries that are embers of the European Association of Faculties of Pharmacy (EAFP). EU partner associations representing community (PGEU), hospital (EAHP) and industrial pharmacy (EIPG), together with the European Pharmacy Students' Association (EPSA) are also part of the consortium.
The consortium surveyed pharmacies and pharmacists in different settings: community, hospital, industry and other sectors. The consortium also looked at how EU higher education institutions, courses and traineeship were organised. An empirical - based on statistical analysis of data - rather than an intuitive approach was used to avoid anecdotal conceptualisation. The fundamental question asked was: is pharmacy education adapted to needs?
This is the 2011 report for the EU. Further reports will be edited in the future as the data for EU member states are completed, data from other European countries are obtained, situations in individual countries change, etc.
Methods
The survey ran between the spring of 2009 and the summer of 2011. An electronic version was sent out to at least 2 faculties per country (excepting countries with only 1 faculty e.g. Estonia). We planned for a balanced design and obtained data from at least 1 faculty per country; in some cases we did not obtain data from 2 faculties.
In some cases, data were expressed per population (in millions, M). The population of the different member states used in the analysis was that as of 1st January 2009 given in the European Commission Eurostat demography report for 2011 http://epp.eurostat.ec.europa.eu/portal/page/portal/population/documents/Tab/report.pdf.
Statistical analysis.
Data (n=25) were obtained from the 27 EU member states excepting Cyprus and Luxembourg that do not have full pharmacy degree courses. When data were obtained from 2 faculties in the same country, the data from the larger faculty was used.
Results are expressed as medians with 10 and 90% percentiles. The Kolmogorov-Smirnov (KS) test for deviations of distribution from normality was significant with positive skewness - a bunching of values below the mean with a long tail above: one-tailed percentage points for skewness =0.711 (n=25 and a=0.05). Skewness was due to the uneven distribution of population in the EU. Twenty % of the population of the EU live in 17 smaller countries: Austria, Belgium, Bulgaria, Czech Republic, Denmark, Estonia, Finland, Greece, Hungary, Ireland, Latvia, Lithuania, Malta, Portugal, Slovakia, Slovenia and Sweden, and 80% in 8 larger countries: France, Germany, Italy, The Netherlands, Poland, Romania, Spain and United Kingdom. Kurtosis (an excess of values near the mean and far from it with a corresponding depletion of the flanks of the normal distribution curve) was rarely significant (percentage point for distribution =3.99, for n=50 and a=0.05).
In order to compare data for an individual country with an EU "average", several possibilities were envisaged. Comparing the data for a given country with the EU mean was judged invalid as distributions were often not normal (see previous paragraph). Comparisons with medians were also invalid as medians were equal to zero in some cases. It was decided to use an EU linear regression estimation. This was calculated as follows: estimations of numbers of pharmacies, etc. as the dependent variable were calculated from the linear regression equation with population as the independent variable with the condition that when X=0, Y=0. The reported number for the country was then expressed as a ratio of the estimated number. Taking community pharmacies in France as an example: with X=population and Y=community pharmacies, forcing the linear regression through Y=0 when X=0, gives a slope of 298 ±18 (test of slope?0: P<0.0001; n=25 countries). Thus the EU linear regression estimation of the number of pharmacies in France =64.7 million x 298 =19,280. The reported number of pharmacies is 23,133, thus giving a ratio compared to the estimate of 23,133/19,280 =1.20 (see table 6). France therefore has 1.2 times more pharmacies than to be expected from the EU linear regression estimation or EU "average".
Statview® (http://statview.com/), GraphPad® (www.graphpad.com) and nQuery® (www.statistical-solutions-software.com) programs were used.
Complete data for each country can be obtained on the PHARMINE website at: http://www.pharmine.org/losse_paginas/Country_Profiles/ . These profiles were written by the various members of the PHARMINE consortium (see below). Data were checked by JA with that available on the internet, where possible.
Results
EU population and number of pharmacists
The population of the 25 EU member states under consideration is 501 million. A total of 419,353 pharmacists work in these 25 countries, with 81% in community pharmacy, 5% in hospital pharmacy, 7% in industrial pharmacy and 10% in other occupations (tables 1 and 2). Tasks carried out in each of the 4 sectors, as reported, are given in table 3. The median values for population, number of pharmacists and population per pharmacist are 10 million, 6,278 and 1,593 (tables 1, 2, 4 and 5).
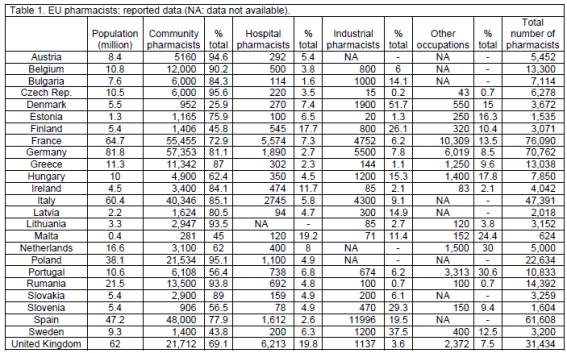


When the data (population versus pharmacists) are plotted separating into larger (n=8) and smaller (n=17) EU member states with a cut-off after The Netherlands (16.6 M), results are similar with slopes of 758 ± 202 and 728 ± 155 (t-test for difference between slopes: P>0.05) for larger and smaller countries; medians are 1545 (percentiles 879, 3,282) and 1628 (percentiles 977 and 6,097), respectively.
Thus in the above and almost all of the following cases there are no significant differences in results from larger and smaller EU countries (data not shown).
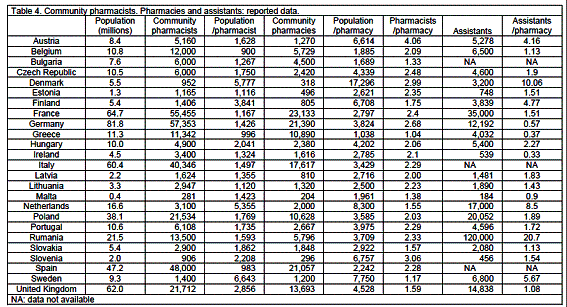
Community pharmacies, pharmacists and assistants
Reported numbers of community pharmacists expressed as a ratio of the EU linear regression estimation, gives a median value (0.92, percentiles 0.25 and 1.49) not significantly different from 1 (P>0.05) (tables 6, 7). Belgium (1.64) and Sweden (0.22) are outside the limits. Thus Belgium has more and Sweden less community pharmacists than the EU linear regression estimation.

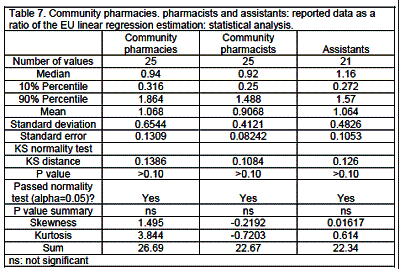
The median number of pharmacies is 2380. Ratios compared to the EU linear regression estimation (tables 6, 7) showed 4 countries outside the percentile limits (0.32, 1.86): Greece (3.23), Bulgaria (1.99), Denmark (0.19) and Slovenia (0.18). Thus Greece has more than 3-fold, Bulgaria twice, and Denmark and Sweden one-fifth, the number of pharmacies. There are 3585 persons per pharmacy.
There are 2.10 (percentile limits 1.27, 3.02) pharmacists per pharmacy in Europe. Most countries show values grouped within a narrow range from 1.0 (Greece) to 2.4 (France). Three northern/central European countries have larger values: Denmark: 3.0, Slovenia: 3.1, and Austria: 4.1.
There are 4,598 assistants per country (percentiles 481, 30,516). Ratios compared to the EU linear regression estimation (table 6, 7) show 4 countries outside percentile limits: The Netherlands (2.21), Sweden (1.58), Ireland (0.26) and Slovenia (0.18). The median number of assistants per pharmacy is 1.63 (percentiles 0.43, 9.59, table 5) with a minimum of 0.3 (Ireland) and a maximum of 10.1 (Denmark) (table 4).
The education of assistants is carried out at a university faculty in three cases (Finland, Romania and Sweden); in all other cases education is given in a technical college or high school.
Hospital pharmacies and pharmacists
There are 115 hospital pharmacies per country (percentiles: 18, 662, n=23) and 375 hospital pharmacists (97, 4,159, n=24; table 2). There are 92,174 persons per hospital pharmacy and 28,669 per hospital pharmacist (tables 8, 9).
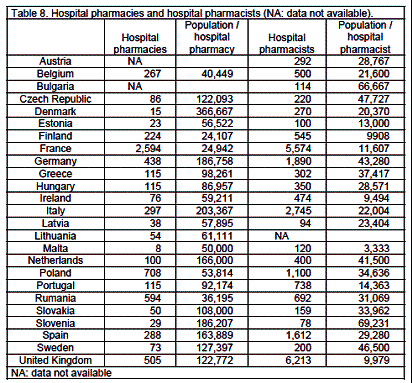
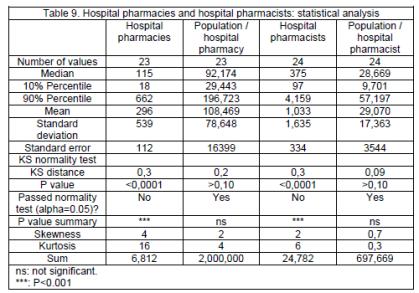
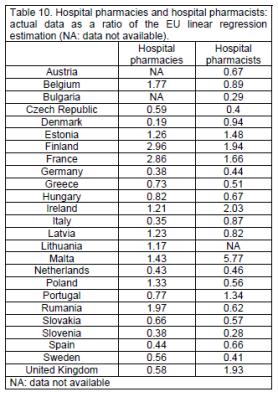
Ratios compared to the EU linear regression estimation show 4 countries outside percentiles limits (0.36, 2.50) for hospital pharmacies: Denmark (0.19), Italy (0.35), Finland (2.96) and France (2.86), and 4 for hospital pharmacists: Slovenia (0.28), Bulgaria (0.29), Ireland (2.03) and Malta (5.77), (tables 10, 11).

Industrial pharmacists
The median number of industrial pharmacists is 737 (percentiles 35, 5,276) with 13,831 (percentiles of 7,188 and 53,338) persons per industrial pharmacist (table 2).
Other activities and occupations
The median number of pharmacists in other occupations is 400 (percentiles 75, 6,877) (table 2).
Higher education institutions (HEIs)
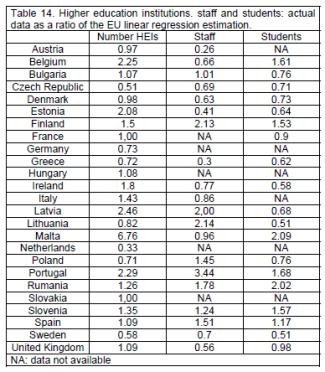
There are 195 public HEIs in the EU with 144 (74%) in the 8 larger countries (tables 12, 13). There are 12 private HEIs: 1 each in Ireland and Romania, 4 in Portugal and 6 in Spain. Ratios compared to the EU linear regression estimation show 3 countries outside percentile limits (0.55, 2.36): Czech Republic (0.51), The Netherlands (0.33) and Malta (6.76) (tables 14, 15). It should be noted that the actual numbers of HEIs in these 3 countries are low.
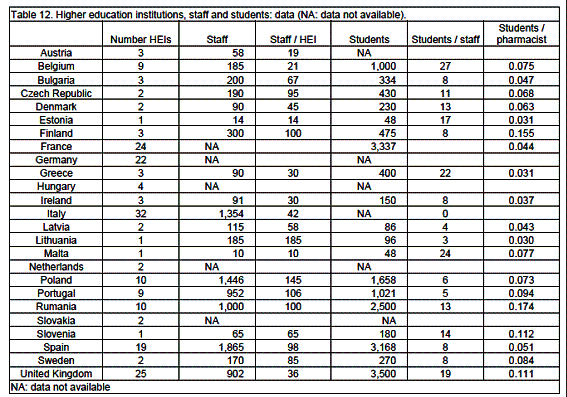


In 12 countries (Czech Republic, Denmark, Finland, France, Hungary, Italy, Latvia, Poland, Slovakia, Slovenia, Spain and Sweden) HEIs are independent faculties. In 5 countries (Austria, Germany, The Netherlands, Portugal and United Kingdom) HEIs are part of a science department. In 7 countries (Belgium, Bulgaria, Estonia, Ireland, Lithuania, Malta and Romania) HEIs are part of a medical department. In Greece Athens has an independent faculty, Thessaloniki and Patras have faculties within the school of Health Sciences.
Staff
An EU country has 185 staff teaching pharmacy (percentiles: 18.4, 1,437) with 62 staff per HEI (percentiles: 14.5, 141) (table 13). Ratios compared to the EU linear regression estimation show 2 countries outside percentile limits (0.31, 2.10): Austria (0.26) and Portugal (3.44) (table 14).
Students
An EU country has 400 pharmacy students (percentiles: 48, 3,337) with 8 students per staff member (percentiles: 3.0, 24) (table 13). Ratios compared to the EU linear regression estimation show no countries outside percentile limits (tables 14, 15). There are 0.068 students per working pharmacist (percentiles: 0.031, 0.174) (table 13).
Courses
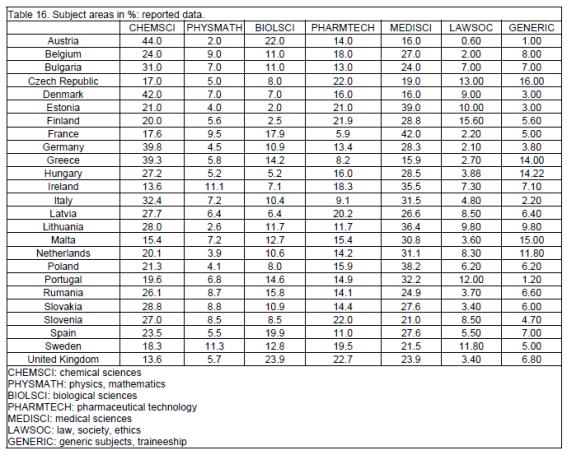
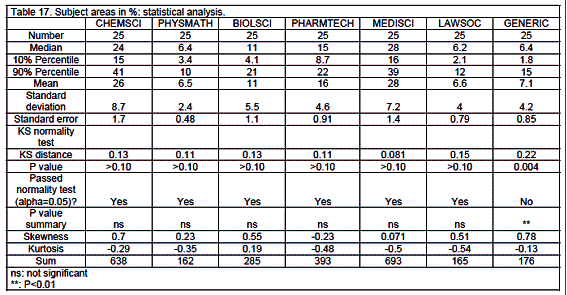
In opposition to the data above, data relating to percentage of the 7 subject areas in the course were almost all of normal distribution (tables 16, 17). Medical sciences (MEDSCI) represent the main subject area (28%) followed by chemical sciences (CHEMSCI: 24%), pharmaceutical technology (PHARMTECH: 15%), biological sciences (BIOLSCI: 11%), physics/mathematics (PHYSMATH: 6.4%), generic subjects (GENERIC: 6.4%) and law/society/ethics (LAWSOC: 6.2%).
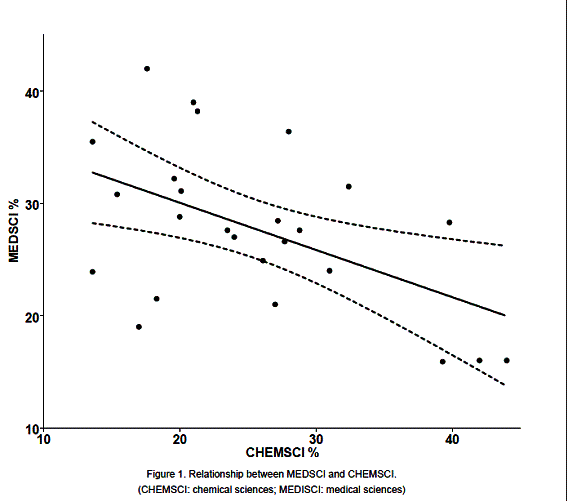
When subject area percentages were tested for correlations amongst them, the only significant correlation (negative) emerging was that between medical and chemical sciences (figure 1). Some countries had a more "medical" course: MEDSCI % / CHEMSCI % = 2.38 for France, 1.85 for Estonia and 1.79 for Poland. Others had more "chemical" courses: MEDSCI % / CHEMSCI % = 0.71 for Germany, 0.40 for Greece, 0.38 for Denmark, 0.36 for Austria.
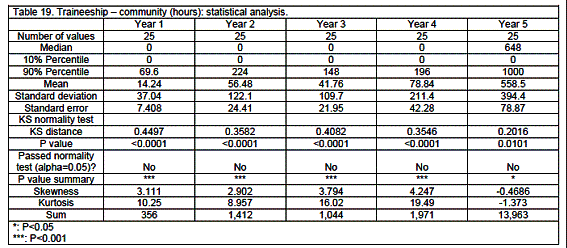
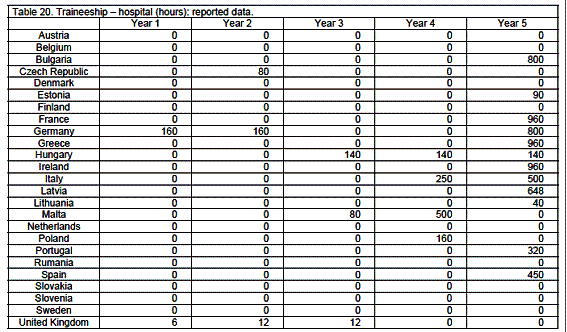
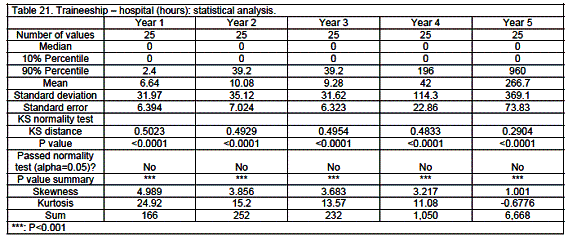
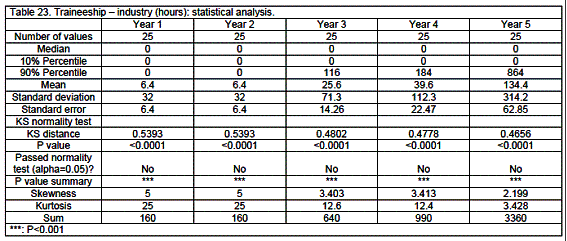
Traineeship
Traineeship was mainly in community pharmacy (58%) with 26% in hospital and 16% in industrial settings (details see tables 18 through 23 and figure 2). Traineeship was mainly in the fifth year (74%) but some countries such as Finland, France, Germany, Hungary and Malta started significant traineeship early - in the first or second year.
Analysis revealed medians that were often equal to zero given the large number of zeros in a given category.


Discussion
A total of 419,353 pharmacists work in the 25 EU countries surveyed. This gives a mean value of 16,774 pharmacists per country with a median of 6,278. The mean and median are very different as the distribution of the data is highly skewed. This is due to the fact that the population of the EU (n=25) - 501 million - is roughly distributed into larger and smaller countries. Twenty % of the population of the EU lives in 17 smaller countries: Austria, Belgium, Bulgaria, Czech Republic, Denmark, Estonia, Finland, Greece, Hungary, Ireland, Latvia, Lithuania, Malta, Portugal, Slovakia, Slovenia and Sweden, and 80% lives in 8 larger countries: France, Germany, Italy, The Netherlands, Poland, Romania, Spain and United Kingdom. As a consequence of this, many of the analyses are presented using medians. Furthermore, data were also analysed by separating countries into two groups - larger and smaller countries - but no significant differences were observed between the two groups.
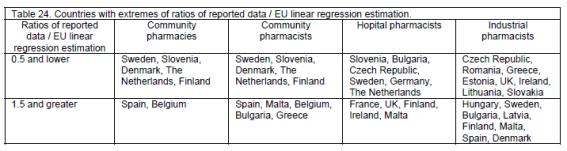
Community pharmacies and community, hospital and industrial pharmacists are unevenly distributed in the EU (table 24), some countries having ratios of reported number / EU linear regression estimation of >0.5 (i.e. less than half the number to be expected from the population of the country), and some with ratios of >1.5 (i.e. 1.5x or more the number expected).
Most (70%) of pharmacists work as community pharmacists with the tasks reported in table 3. In order to evaluate whether pharmacy education and training is adapted to needs, correlations were calculated between the numbers of community pharmacists and the number of HEIs and pharmacy students. These were highly significant in both cases: r²=0.77 (P<0.0001) and 0.75 (P<0.0001), respectively. Thus in terms of numbers of future pharmacists, EU HEIs appear to be connected to the needs.
Pharmacists working in hospitals and industry have clearly identified roles and competences (table 3). In order to evaluate whether pharmacy education and training is adapted to such needs, correlations were calculated between the ratios of hospital and industrial pharmacists (reported number / EU linear regression estimation) and the ratio CHEMSCI+PHARMTECH / MEDSCI. It was argued that countries with higher numbers of hospital pharmacists would have courses more oriented towards medical sciences: MEDSCI (human anatomy and physiology, medical terminology, pharmacology, pharmacognosy, pharmacotherapy / therapeutics, toxicology, pathology, histology, microbiology, nutrition, non-pharmacological treatment, haematology, immunology, parasitology, hygiene, emergency therapy, clinical chemistry / bio-analysis (of body fluids), radiochemistry, dispensing process, drug prescription, prescription analysis (detection of adverse effects and drug interactions), generic drugs, planning, running and interpretation of the data of clinical trials, medical devices, orthopaedics, OTC medicines, complementary therapy, at-home support and care, skin illness and treatment, homeopathy, phytotherapy, drugs in veterinary medicine, pharmaceutical care, pharmaceutical therapy of illness and disease). Likewise those with higher numbers of industrial pharmacists would have courses more oriented toward chemical sciences: CHEMSCI (general, organic & inorganic chemistry, analytical chemistry, pharmaceutical chemistry / pharmacopeia analysis, medicinal physic-chemistry / SAR / drug design) and pharmaceutical technology: PHARMTECH (galenic formulation / pharmaceutics, drug disposition and metabolism (ADME) / pharmacokinetics, novel drug delivery systems, drug design, pharmaceutical R&D, drug production, quality assurance in production, drug / new chemical entity registration and regulation, common technical document (quality (pharmaceutical), safety (safety pharmacology and toxicology), efficacy (preclinical and clinical studies)), ophthalmic preparations, medical gases, cosmetics, management strategy in industry, economics of the pharmaceutical industry and R&D). In neither case were correlations significant: hospital pharmacists r²=0.15, P=0.069, industrial pharmacists r²=0.12, P=0.115. At the extremes, however, courses were oriented. Thus Ireland with a ratio for hospital pharmacists of 2.03 (twice as many hospital pharmacists as to be expected from the EU linear regression estimation) had a CHEMSCI+PHARMTECH / MEDSCI ratio of 0.38. Denmark with a ratio for industrial pharmacists of 4.47 (4.5 times as many industrial pharmacists as to be expected from the EU linear regression estimation) had a CHEMSCI+PHARMTECH / MEDSCI ratio of 3.63.
A couple of provisos have to be added, however. Firstly, whilst community pharmacists are registered by their national chamber and thus their numbers are accurately known, this is often not the case for hospital or industrial pharmacists and thus their numbers may be less accurate. Secondly, whilst the content of the degree course for community pharmacists is fixed by the annex of the EU directive 2005/36 (see above), this is not the case for hospital and industrial pharmacists. A large variety in the course proposed is observed. In France future hospital pharmacists have extensive pre-graduate training in hospital pharmacy and also undergo a 4-year hospital internship. In other countries there is little specific pre- or post-graduate training for either hospital or industrial pharmacists. The latter are simply defined by their place of work and their roles and responsibilities (table 3).
The PHARMINE survey revealed that there is a median of 4598 assistants per country and 1.63 assistants / community pharmacist. Three countries were unable to reply to questions on assistants as the status of such persons is not clearly established in these countries. In most EU countries the main task of assistants is to take care of medicine storage, logistics, invoicing and management of pharmacy IT systems and other such tasks. Their training, which is performed at a high school or college, includes basic modules in chemistry and in physics, healthcare, hygiene, management, economics, bookkeeping, etc.
The education of assistants is carried out at university in three cases (Finland, Romania and Sweden). Taking the case of Finland (http://www.pharmine.org/losse_paginas/Country_Profiles/Finland/) following the Bologna declaration (http://enzu.pharmine.org/media/filebook/files/Bologna%20declaration.pdf), pharmacy education is divided into two parts. All the students follow the same curriculum the first three years and graduate with a bachelor degree. Approximately one third of the students continue additional two years to graduate with the master degree, devoted mainly to chemical and medical sciences, generic subjects and pharmaceutical technology, and medical sciences. Those graduating with a bachelor degree have tasks similar to those of pharmacists, but these do not include pharmacy ownership, management or in-depth scientific issues. The main focus is in customer service and patient counselling. In summary, in Finland, both B.Sc. and M.Sc. graduates are involved in dispensation and counselling. Ownership of a pharmacy and/or a position of responsible pharmacist are restricted to M.Sc. graduates.
Traineeship is mainly in a community / hospital setting (84%) and mainly in the fifth and final year, although several countries introduce traineeship earlier - some in the first year of the degree. In most countries the length of the course is 5 years. There is thus integration of traineeship into the degree course. In some countries (Austria, UK) the course is shorter. Following graduation pharmacists undergo a pre-registration training period that is validated by the national chamber or agency.
In conclusion, the PHARMINE survey of pharmacy and pharmacy education in Europe produced country profiles with extensive information for each country in the EU and several other European countries. These data are available at: http://www.pharmine.org/losse_paginas/Country_Profiles/. This 2011 PHARMINE report represents a presentation of the project and the data and some preliminary analysis on the basic question of how pharmacy education is adapted to pharmacy practice in the EU.
This is the 2011 report for the EU. Further reports will be edited in the future as the data is completed, data from other European countries are obtained, situations in individual countries change, etc. Further reports will also deal with other subjects such as the impact of the Bologna declaration and of the EC directives on organisation of university studies, and quality assurance in European pharmacy education.
Acknoledgements
With the support of the Lifelong Learning Programme of the European Union: 142078-LLP-1-2008-BE-ERASMUS-ECDSP and the European Association of Faculties of Pharmacy (EAFP), Belgium.
The authors thank the following members of the PHARMINE ("PHARMacy Education IN Europe") consortium:
C. NOE, University of Vienna, AUSTRIA.
B. ROMBAUT, H. HALEWIJCK and B. THYS, Vrije Universiteit Brussel, Faculty of Medicine and Pharmacy, Dept. Pharmaceutical Biotechnology and Molecular Biology, BELGIUM.
V. PETKOVA and S. NIKOLOV, University of Sofia, Faculty of Pharmacy; V. BELCHEVA, Sanofi-Aventis, BULGARIA.
M. POLASEK, Faculty of Pharmacy, Charles University, CZECH REPUBLIC.
U. MADSEN and B. FJALLAND, Faculty of Pharmaceutical Sciences, University of Copenhagen; M. BRANDL, Faculty of Science, University of Southern Denmark; M. RINGKJØBING-ELEMA, EIPG / The Association of Danish Industrial Pharmacists, DENMARK.
P. VESKI and D. VOLMER, Department of Pharmacy, University of Tartu, ESTONIA.
J. HIRVONEN and A. JUPPO, University of Helsinki, Faculty of Pharmacy, FINLAND.
C. CAPDEVILLE-ATKINSON, Nancy University, FRANCE; A. MARCINCAL, Faculté de Pharmacie, Université de Lille 2; V. LACAMOIRE and I. BARON, Conseil National de l'Ordre des Pharmaciens, FRANCE.
R. SÜSS and R. SCHUBERT, University of Freiburg, GERMANY.
P. MACHERAS, E. MIKROS and D. M. REKKAS, School of Pharmacy, University of Athens; K. POULAS, School of Pharmacy, University of Patras, GREECE.
G. SOOS and P. DORO, Faculty of Pharmacy, University of Szeged, HUNGARY.
T. KRISTMUNDSDOTTIR and A. B. ALMARSDOTTIR, Faculty of Pharmaceutical Sciences, University of Iceland, ICELAND.
J. STRAWBRIDGE and P. GALLAGHER, Royal College of Surgeons in Ireland, Dublin; L. HORGAN, Pharmaceutical Society of Ireland, PSI - The Pharmacy Regulator, IRELAND.
C. ROSSI, and P. BLASI Faculty of Pharmacy, University of Perugia, ITALY.
R. MUCENIECE, Faculty of Medicine of University of Latvia; B. MAURINA, Faculty of Pharmacy; I. SAPROVSKA, Latvian Branch, European Industrial Pharmacists' Group (EIPG), LATVIA.
V. BRIEDIS and M. SAPRAGONIENE, Lithuanian University of Health Sciences, LITHUANIA.
L. M. AZZOPARDI and A. S. INGLOTT, University of Malta, Department of Pharmacy, MALTA.
T. SCHALEKAMP, Utrecht University, Faculty of Science, Department of Pharmaceutical Sciences; H. J. HAISMA, University of Groningen, School of Life Sciences, Pharmacy and Pharmaceutical Sciences, THE NETHERLANDS.
K. M. ULSHAGEN, P. H. TUSVIK, L. TRELNES, Farmasøytisk Institutt, NORWAY.
S. POLAK and R. JACHOWICZ, Faculty of Pharmacy with Division of Medicinal Analysis, Jagiellonian University Medical College, POLAND.
J. A. G. MORAIS and A.M. CAVACO, Faculdade de Farmácia Universidade de Lisboa, PORTUGAL.
C. MIRCIOIU and C. RAIS, Faculty of Pharmacy, University of Medicine and Pharmacy "Carol Davila", ROMANIA.
J. KYSELOVIC and M. REMKO, Faculty of Pharmacy, Comenius University, Odbojarov 10, Bratislava, 83232, SLOVAKIA.
B. BOZIC and S. GOBEC, University of Ljubljana, Faculty of Pharmacy, SLOVENIA.
B. DEL CASTILLO-GARCIA, Facultad de Farmacia, Universidad Complutense de Madrid; L. RECALDE and A. SANCHEZ POZO, Facultad de Farmacia, Universidad de Granada, SPAIN.
R. HANSSON and E. BJÖRK, Faculty of Pharmacy, Uppsala University; G. TOBIN, Sahlgrenska Academy, SWEDEN.
F. HINCAL and L. O. DEMIREZER, Hacettepe University Faculty of Pharmacy, Department of Pharmaceutical Toxicology, TURKEY.
K. A WILSON, Aston Pharmacy School, Aston Triangle; G.B.LOCKWOOD, University of Manchester, School of Pharmacy & Pharmaceutical Sciences., UNITED KINGDOM.
J. CHAVE, General Secretary, PGEU, Pharmaceutical Group of the European Union.
J. NICHOLSON, General Secretary; EIPG, European Industrial Pharmacists Group.
R. FRONTINI, President; EAHP, European Association of Hospital Pharmacists.
The President, EPSA, European Pharmaceutical Students' Association.
Received: 20-Sep-2011
Accepted: 07-Nov-2011

