


 Serviços customizados
 Inglês (pdf)
 Artigo em XML
 Referências do artigo
 Enviar este artigo por email
 Citado por SciELO
  Citado por Google
  Similares em
SciELO
Similares em
SciELO  Similares em Google
 Permalink
INTRODUCTION
The Ministry of Health Malaysia initiated a large nationwide natural policy implementation experiment by launching a fully government funded and supported pharmacy value added services (PVAS) program under the authority of the Pharmaceutical Services Division. In other countries, these services are usually called ‘extended’ services and are usually operated through private community pharmacies.1,2,3,4 The heavily burdened public facilities fulfill prescriptions that was increasing steadily from 32 million in 2007 to 43.4 million in 2011 for a nation with a population of approximately 30 million inhabitants. This increasing trend of workload is a tremendous strain on time and resources that is pushing the limits of public pharmaceutical services as well as causing great distress to patients.5 PVAS is a matter of national health policy was expected to play an important role in improving health outcomes through better compliance and patient monitoring by making public facilities more accessible to patients.5
In Ministry of Health Malaysia effort to mitigate the long waiting time and smoothen the dispensing process, creative innovations such as PVAS were created and put to tests in numerous pilot projects in Ministry hospitals. PVAS in Malaysia includes any other pharmacy service that adds value to the traditional counter dispensing services. These may include drive through and integrated dispensing services.5 However, despite the tremendous patient load and high investment of infrastructure and manpower, the chief problem is that PVAS adoption remains very low which raises pertinent policy questions regarding the successful implementation of public health policies. To understand PVAS more clearly, we must first understand the determinants of PVAS adoption intention among patients. Ultimately, the patient’s choice to adopt PVAs en masse will determine the success of this new healthcare policy for new pharmaceutical services implementation. This article aims to understand the basic building blocks of successful adoption from the perspective of the service recipients themselves rather than from a top-down approach to policy planning and implementation.
The first objective of this study is to explore the determinants of intention to adopt PVAS using the Theory of Planned Behavior (TPB) as our theoretical model. We extend the TPB to include knowledge and expectations as possible predictors and mediators. There is a rich literature that describes the role of knowledge6,7,8 and expectations9,10,11,12 as behavioral mediators. The second objective is to study the role of knowledge and expectations in mediating effects TPB constructs on intentions. This will allow us to gain a deeper insight for future policy making and implementation of PVAS. The study was registered with National Medical Research Register and was approved by Medical Research & Ethics Committee, Ministry of Health Malaysia (NMRR-14-483-20556).
METHODS
This employs a two phase mixed methodology approach based on the TPB as the theoretical model. Intentions to perform behaviours can be predicted from attitudes, subjective norms, and perceived behavioural control.13 We posit that patient knowledge and expectations about PVAS may also be significant predictors of intention and may also indirectly influence TPB constructs in affecting intentions.
Phase 1: Qualitative Exploration
The first phase is a qualitative stage that explores the salient beliefs of patients in building intention to use PVAS by using semi-structured face-to-face interviews. The TPB model serves as the framework for thematic analysis. Appendix 1 illustrates the complete qualitative process and the types of questions asked within each TPB domain.
Emerging themes from the interview were used to generate a series of hypotheses which will be tested using a questionnaire instrument. The conclusions from Phase 1 will assist the formation and formulation of research questions.14 The qualitative study completed by Tan et al.15 showed clearly that five main themes emerged as significant predictors of intention which were attitudes, subjective norms, perceived behavioural control, knowledge and expectations in agreement with the TPB. This provides a strong impetus to proceed to Phase 2 of the study.
Phase 2: Quantitative Strategy
In Phase 2 we develop and validate the questionnaire instrument we call the “Pharmacy Value Added Services Questionnaire” or PVASQ. Phase 2 involves three main stages; the pre-testing, the pilot testing and the final administration of PVASQ (Appendix 2).
Face and content validity were performed by experts at the Department of Social & Administrative Pharmacy, Universiti Sains Malaysia. Malaysian nationals aging 18 years and above, able to read English or Malay languages and have experience collecting their partial medicine supplies from the five health facilities in Seremban, in the state of Negeri Sembilan were suitable to participate. Illiterate participants were excluded.
PVASQ was developed using salient beliefs/themes generated from earlier interviews. PVASQ was constructed with reference to the proposed and advocated TPB research tool based on TACT principles (target, action, context and time principles) of the target behavior.16 PVASQ contains 36 questions and is divided into five themes or four domains: perspectives that include subjective norms, perceived behavioral control, and attitudes; knowledge; expectations; and demographics (Appendix 3). It contains both dichotomous response options and 7-options unipolar Likert response scales.
PVASQ developed in English based on the salient themes generated in Phase 1 was pretested on 15 participants and piloted in a test-retest reliability (intra-rater reliability test) study on 25 participants. The final study was based on 410 participants. All participants were recruited from five centres. For field data collection, 460 questionnaires were distributed from mid November 2014 to the end of December 2014 after accounting for 20% non-response rate, +/-5% of “true” population prevalence with a 95% level of confidence. A total of 410 useable questionnaires with no missing values were used for data entry and in the statistical analysis. Respondents’ profiles can be found in Appendix 4.
The PVASQ has 29 items (variables) to test the TPB model operationally by using the rule-of-thumb ratio of 10:1 between items to respondents.17,18 Thus, the minimum sample size required for sound factor analysis is 290 subjects which is near what Comrey and Lee19 suggested as a good sample size. This study has a sample size of 410 which exceeds the cited requirement in the literature.
Data entry and analysis was performed using IBM SPSS version 22. Negatively worded responses were recoded. Composite measures or scores were computed for all six main constructs; intention, attitude, subjective norms, perceived behavioural control, knowledge and expectations. Internal consistency of construct reliability was assessed using Cronbach’s alpha. We set alpha at 0.70 as the cut-off point.20 The chance correlated agreement reliability (N=25) at two time points was calculated using Cohen’s unweighted kappa statistic for nominal scales and dichotomous knowledge items while the Intraclass Correlation Coefficient (ICC) was applied for interval scales; TPB constructs, knowledge and expectations scores.21 The ICC model used is the One-way random effects model, single measure. Acceptable κ is set at >0.40 for moderate to almost perfect agreement and the ICC set at >0.50 for moderate to good reliability.22
For confirmatory factor analysis, we restrict the extracted factors to four based on the three TPB constructs and the fourth construct of expectations.23,24 This “A Priori Criterion” is suitable for theory testing or hypothesis testing based on a theoretical model.25 Items in the intention scale were not included in factor analysis because intention is a dependent variable in TPB model. The knowledge scale is unsuitable for factor analysis because binary variables cannot be expressed within factor models.26 The ICC by test-retest is sufficient to indicate construct validity for the knowledge scale. We use principal axis factoring with Varimax rotation. The detailed in-depth description and completion of this stage can be found in Tan et al.27
Multiple Regression Analysis
Bootstrapping allows us to derive standard errors which are robust to heteroscedasticity and therefore allow ordinary least squares estimates to remain valid to interpretation.28 Bootstrapping the sample constructs new confidence intervals known as percentile confidence intervals, bias-corrected (BC) and bias-corrected and accelerated (BCa) intervals from the new robust standard errors.29,30 We utilize 5000 resamples as recommended.31 We then estimate the following regression models on the composite scores of each respondent i for each questionnaire item based on our theoretical model of the Theory of Planned Behaviour. The base specifications for ordinary least squares estimation are given by;

where: ɛ_i~NID(0,σ) and Z_i is the vector of control variables (demographics). beta stands for unstandardized regression coefficient for each variables while beta_0 is the intercept.
Mediation analysis: the role of knowledge and expectations
Mediation poses the question of how an independent variable (X) affects a dependent variable (Y) through one or more intervening variables called ‘mediators (M)’. Earlier work by Tan and colleagues’ qualitative study suggests that knowledge and expectations also play a larger role than just predictors of intention but somehow indirectly affect the patient’s perspectives through the TPB domains.15 Thus, it is reasonable to posit that knowledge and expectations act as multiple mediators of each TPB construct of attitudes, subjective norms and perceived behavioural control. From Figure 1A, the total effect of X on Y is the c path for a relationship with no mediators. Figure 1B shows that the c’ path captures the direct effect of X on Y in the presence of a mediator M. Path a is the effect of X on M and path b is the effect of M on Y after controlling out for the effect of X. Thus, the product ab (the product-of-coefficients) is the specific indirect effect of X on Y through M. Total effect of X on Y is: c = c’ + ab. For two mediators, the total indirect effect is: f_c= a_1 b_1+ a_2 b_2.
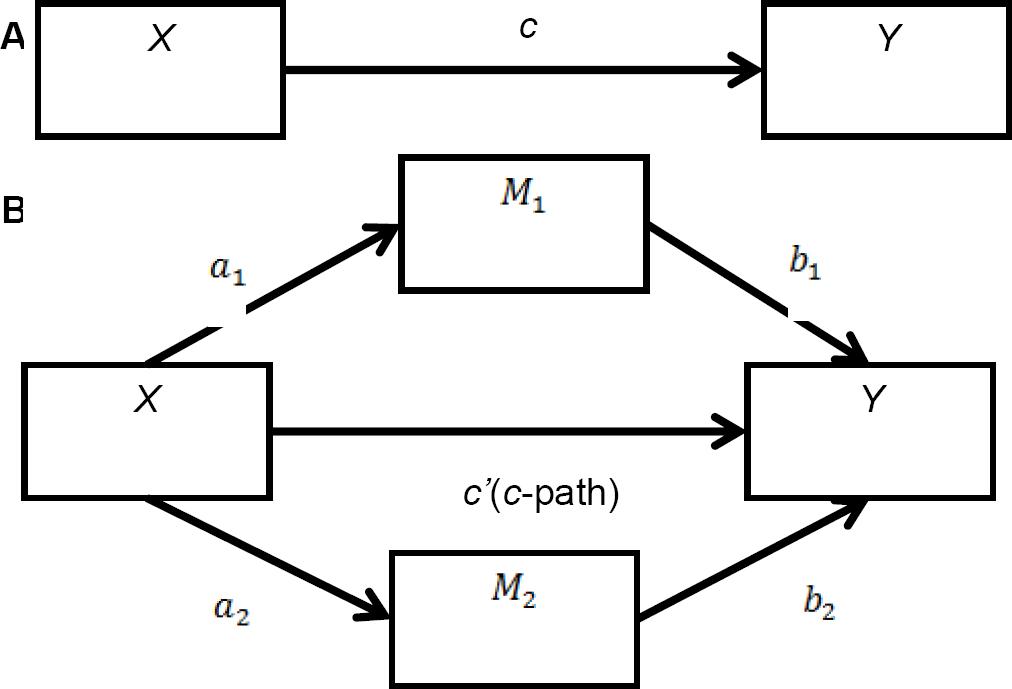
Figure 1 Direct Effects and Mediation Effects (1A) Direct effect of X on Y; (1B) Indirect effect of X on Y through M
The usual test for mediation is the Sobel test which is the product-of-coefficients approach requires variable normality.32,33 Again, bootstrapping allows us to relax this normality assumption and still benefit from this approach.34,35 We can also contrast the effects of each mediator to determine whether knowledge or expectations exerts the stronger effect on intention, we estimate the contrast as: f_c= a_1 b_1- a_2 b_2. We again utilize percentile confidence intervals, BC and BCa intervals. We utilize the SPSS indirect effects macro provided by Preacher and Hayes.31 We can conclude the existence of mediation if zero is not contained within these 95% CIs.
RESULTS
Reliability
PVASQ test-retest reliability (N=25) has been earlier established by Tan and colleagues27 by using Cronbach’s alpha and Cohen’s kappa. The authors clearly show that Cronbach’s alpha for the pooled 29 items in both test and retest were alpha=0.912 and alpha =0.908 respectively. All TPB constructs plus knowledge and expectations scores have alpha values more than 0.70 in both Test and Retest. The kappa coefficients in the knowledge scale ranges from 0.503-0.905, indicating a moderate to almost perfect strength of agreement between test and retest for each individual item. The ICC was reported to be >0.80 for all TPB constructs plus knowledge and expectations scores. Thus, test-retest (N=25) reliability is established. ICC results are sufficient to establish validity of the dicotomous knowledge scale with ICC=0.872 (N=25, p < 0.005). Reliability for the final field study (N=410) is established with alpha= 0.938 for all pooled 29 items.
Confirmatory Factor Analysis
The Kaiser-Meyer-Olkin measure of sampling adequacy (N=410) is 0.940 which is “excellent” and Bartlett’s Test of Sphericity (N = 410) is significant (p<0.05).36,37 We conclude that there are correlations in the data set which is appropriate for factor analysis. Hence, CFA is likely to yield distinctive and reliable latent factors and is highly suitable for the analysis of this dataset.
Four factors were extracted with a cumulative explained variance of 71%. Varimax rotation of items showed strong loading (>0.60) of seven items in one factor (Expectations) and significant loading levels (>0.40) on the second factor (attitudes), third factor (perceived behavioural control) and fourth factor (subjective norms). Almost all 19 items were regrouped distinctively into the expected four factors except one item which loaded from the attitudes factor into the perceived behavioural control factor. The item “P8: Home delivery reduces transportation cost” has low extracted communalities (0.271) and loaded inaccurately into the PBC factor instead of the ATT factor. Therefore, P8 is removed from the final regression analysis. All other items have extracted communalities above 0.30 and 15 items out of 19 items have extracted communalities >0.60, therefore these items were retained for regression. See Appendix 5 for CFA results.
Bivariate analysis
Descriptive statistics and Pearson correlation coefficients (Appendix 6) were generated with Bootstrapping employed on 1000 bootstrap samples. BCa confidence intervals were used to calculate the new 95% confidence interval due to skewness of the dataset.38 BCa refers to bias and skewness correction of the data distribution. All correlation coefficients between any two composite scores are positively correlated, moderate to strong and statistically significant at 1% (2-tailed). Based on Dancey and Reidy’s categorization, only knowledge has weak correlations with all other composite measures.39
Multiple regression: the determinants of intention
The Kolmogorov-Smirnov test of normality indicates that all TPB, knowledge and expectation score variables are not approximately normally distributed at p<0.01. Thus, bootstrapping based on 5000 resamples with BCa confidence intervals was utilized.31 Table 1 shows three regression models controlling for different variables at each time.
Table 1 Estimates of Theory of Planned Behavior bootstrapped multiple regressions (N = 410)
| Regressor | Model | ||
|---|---|---|---|
| 1 | 2 | 3 | |
| Intercept |
0.545 0.009 (0.521) [-0.482, 1.578] |
-0.886 -0.140 (0.672) [-2.281, 0.365] |
-0.227 -0.007 (0.885) [-2.018, 1.497] |
| Attitudes (score) |
-0.052 0.004 (0.053) [-0.157, 0.060] |
-0.070 0.030 (0.053) [-0.177, 0.045] |
-0.071 0.005 (0.053) [-0.182, 0.48] |
| Subjective Norms (score) |
0.287 -0.001 (0.072)*** [0.155, 0.424] |
0.281 -0.002 (0.071)*** [0.151, 0.414] |
0.282 -0.004 (0.069)*** [0.156, 0.407] |
| Perceived Behavioral Control (score) |
0.564 -0.003 (0.042)*** [0.484, 0.636] |
0.543 -0.004 (0.046)*** [0.457, 0.624] |
0.546 -0.004 (0.044)*** [0.463, 0.622] |
| Knowledge (score) |
0.181 0 (0.065)*** [0.053, 0.312] |
0.165 0.001 (0.069)** [0.033, 0.305] |
|
| Expectation (score) |
0.033 0.001 (0.02)* [-0.005, 0.075] |
0.040 0.001 (0.020)** [0.002, 0.081] |
|
| Gender |
0.085 -0.007 (0.202) [-0.306, 0.451] |
||
| Age |
-0.089 0.000 (0.093) [-0.282, 0.098] |
||
| Ethnicity |
-0.347 0.005 (0.116)*** [-0.585, -0.102] |
||
| Current use of VAS |
0.003 0.001 (0.223) [-0.452, 0.430] |
||
| Frequency of medicines collections in the past 6 months |
0.010 -0.001 (0.130) [-0.234, 0.258] |
||
| Educational status |
-0.049 0.005 (0.154) [-0.376, 0.260] |
||
| Occupational sector |
-0.067 0.000 (0.065) [-0.197, 0.064] |
||
| Monthly income |
-0.101 0.000 (0.162) [-0.388, 0.216] |
||
| Current number of medicines prescribed |
0.152 -0.002 (0.133) [-0.097, 0.406] |
||
| Adjusted R-square | 0.737 | 0.743 | 0.747 |
| R-square | 0.739 | 0.739 | 0.739 |
| Standard error of Estimate | 1.884 | 1.862 | 1.847 |
Note: Bootstrap results are based on 5000 samples.***, **, and * denote significance at 1%, 5% and 10% levels (2-tailed). Figures in boldface denote the unstandardized coefficients (beta). Figures in italics denote the estimated bias. Figures in parentheses (·) denote robust standard errors and [·] denote BCa 95% confidence intervals. Model 1, 2 and 3 excluded item P8 in summation of the Attitude composite score. Regression method: Enter, Hierarchical.
We refer to Model 3 in Table 1 for the full estimation of equation (1) with all control variables. The t-statistic is calculated using the unstandardized coefficient (beta) divided by the robust standard error. Model 3 accounts for 75% of the variance in intentions. The degree of freedom for the t-test in regression is N-k-1 where N is the number of observations and k is the number of predictor variables.
First, it was found that subjective norms is positively and significantly related to Intentions (beta=0.28, t(395)=4.09, p=0.001). Results also indicated that perceived behavioural control is positively and significantly associated with Intentions (beta =0.55, t(395)=2.13, p<0.001). Knowledge is also found to be positively and significantly related to Intentions (beta=0.17, t(395)=2.39, p=0.018). Results show that Expectations is positively and significantly associated with Intentions (beta=0.04, t(395)=2.00, p=0.049). Of all the demographic variables, ethnicity is the only control variable that is negatively but significantly associated with Intentions (beta=-0.35, t (395)=-2.99, p=0.004). However, it was found that Attitudes is negatively and not statistically significant in association with Intentions (beta=-0.07, t(395)=-1.34, p=0.190).
Mediation: the indirect effects of knowledge and expectations
Table 2 shows that both the a-path and b-path were highly significant for both knowledge and expectations. Thus, mediation analyses were tested using the bootstrapping method with bias-corrected confidence estimates.34,35 In the present study, the BCa 95% confidence interval of the indirect effects was obtained with 5000 bootstrap resamples.
Table 2 Estimates of a and b paths for effects of independent variables on mediators and mediators on dependent variable
| Mediators, M | Model | ||
|---|---|---|---|
|
| |||
| 1 (Y = INT, X = ATT) | 2 (Y = INT, X = SN) | 3 (Y = INT, X = PC) | |
| X toM (a-paths) | |||
|
| |||
| Knowledge score | 0.0583 | 0.0579 | 0.0548 |
| (0.0173) | (0.0201) | (0.0167) | |
| 0.0008 | 0.0043 | 0.0011 | |
|
| |||
| Expectations score | 0.7783 | 0.8396 | 0.7968 |
| (0.0599) | (0.0715) | (0.0562) | |
| 0.0000 | 0.0000 | 0.0000 | |
|
| |||
| M to Y (b-paths) | |||
|
| |||
| Knowledge score | 0.2587 | 0.2395 | 0.1851 |
| (0.0940) | (0.0800) | (0.0660) | |
| 0.0062 | 0.0029 | 0.0053 | |
|
| |||
| Expectations score | 0.1818 | 0.1306 | 0.0441 |
| (0.0271) | (0.0225) | (0.0196) | |
| 0.0000 | 0.0000 | 0.0250 | |
Note: Figures in boldface denotes the unstandardized coefficients (beta). Figures in parentheses (·) denote standard errors, and italics denote p-values.
Results of the mediation analysis confirmed the mediating role of knowledge and expectations in the relation between attitudes, subjective norms, perceived behavioural control and intentions at 5% significance as shown in Table 3 with confidence intervals not containing zero. In all point estimates, expectations are shown to be the much stronger mediator. This is shown by negative figures for the point estimates of the contrast between knowledge and expectations. All contrasts are also significant at the 5% level.
Table 3 Mediation Effects of Knowledge and Expectations
| (3a) Mediation of the effect of attitudes on intention through knowledge and expectations | |||||||||
|---|---|---|---|---|---|---|---|---|---|
| Point Estimate | Product of Coefficients | Bootstrapping | |||||||
| Percentile 95% CI | BC 95% CI | BCa 95% CI | |||||||
| SE | Z | Lower | Upper | Lower | Upper | Lower | Upper | ||
| Mediators: | Indirect Effects | ||||||||
| Knowledge | 0.0151 | 0.0071 | 2.1378 | 0.0023 | 0.0325 | 0.0032 | 0.0353 | 0.0033 | 0.0356 |
| Expectations | 0.1415 | 0.0237 | 5.9738 | 0.0906 | 0.1989 | 0.0924 | 0.2014 | 0.0902 | 0.1987 |
| Total | 0.1566 | 0.0246 | 6.369 | 0.1083 | 0.2123 | 0.1104 | 0.2159 | 0.1092 | 0.2138 |
| Contrasts | |||||||||
| Knowledge vs. Expectations | -0.1264 | 0.0249 | -5.0881 | -0.1897 | -0.0701 | -0.1910 | -0.0712 | -0.1874 | -0.0682 |
| (3b) Mediation of the effect of subjective norms on intention through knowledge and expectations | |||||||||
| Point Estimate | Product of Coefficients | Bootstrapping | |||||||
| Percentile 95% CI | BC 95% CI | BCa 95% CI | |||||||
| SE | Z | Lower | Upper | Lower | Upper | Lower | Upper | ||
| Mediators: | Indirect Effects | ||||||||
| Knowledge | 0.0139 | 0.0067 | 2.0785 | 0.0021 | 0.0316 | 0.0029 | 0.0334 | 0.0029 | 0.0334 |
| Expectations | 0.1096 | 0.0210 | 5.2110 | 0.0682 | 0.1564 | 0.0689 | 0.1568 | 0.0675 | 0.1556 |
| Total | 0.1235 | 0.0219 | 5.6289 | 0.0829 | 0.1708 | 0.0833 | 0.1712 | 0.0820 | 0.1699 |
| Contrasts | |||||||||
| Knowledge vs. Expectations | -0.0957 | 0.0222 | -4.3130 | -0.1464 | -0.0481 | -0.1460 | -0.0477 | -0.1433 | -0.459 |
| (3c) Mediation of the effect of perceived behavioral control on intention through knowledge and expectations | |||||||||
| Point Estimate | Product of Coefficients | Bootstrapping | |||||||
| Percentile 95% CI | BC 95% CI | BCa 95% CI | |||||||
| SE | Z | Lower | Upper | Lower | Upper | Lower | Upper | ||
| Mediators: | Indirect Effects | ||||||||
| Knowledge | 0.0102 | 0.0047 | 2.1396 | 0.0014 | 0.0227 | 0.0020 | 0.0247 | 0.0020 | 0.0250 |
| Expectations | 0.0351 | 0.0157 | 2.2296 | 0.0034 | 0.0692 | 0.0043 | 0.0706 | 0.0041 | 0.0701 |
| Total | 0.0453 | 0.0163 | 2.7749 | 0.0108 | 0.0814 | 0.0120 | 0.0820 | 0.0114 | 0.0818 |
| Contrasts | |||||||||
| Knowledge vs. Expectations | -0.0250 | 0.0166 | -1.5051 | -0.0598 | 0.0083 | -0.0612 | 0.0069 | -0.0604 | 0.0076 |
Point estimate refers to the estimated regression product-of-coefficients for the ab-path. It captures the indirect effect of the independent variable X on the dependent variable Y through mediators and. SE refers to the standard error of the mediation model and Z refer is the asymptotic critical ratio given as the ratio between total indirect effects to the square root of the variance of the total indirect effects; $$$
DISCUSSION
The strongest predictor of intentions is perceived behavioural control followed by subjective norms. Surprisingly, attitudes were not statistically significant. However, it is clinically significant as the regression shows that a 1% increase in positive attitudes predicts a 7.1% increase in intentions. This may be due to unavoidable response bias to give socially desirable responses on attitude questions surveyed on government servants (41% of the respondents work at government agencies). Acquiescence bias might also have occurred due to deference or respect for a government research investigator, hence mostly scoring positively high on the attitude scale.40 It noteworthy that in this survey, 70% of the respondents were Malay participants. It had been reported that Malay respondents showed a significant higher acquiescence response style and positive extreme responses.41 These factors may explain the significance of ethnicity as a predictor of intentions.
The findings on the role of mediators are robust. This suggests that policy makers should focus on managing patient knowledge and expectations first before enhancing attitudes, subjective norms, and perceived behavioural control simply because knowledge and expectations act on all TPB to enhance intentions indirectly. While the TPB is the most commonly used model for evaluating intentions, other authors have proposed newer models that evaluate the observed behaviour of adoption such as the COM-B model of behavioural change.42 The limitations of this study are that while ideally the actual behaviour should be studied but this was not achievable in the context of this article. Such an exercise would require the monitoring resources and time frame that beyond the objectives of the study. Thus, intentions served as predictor of actual behaviour with the TPB as a sound theoretical base.
CONCLUSIONS
The results conclusively show that the key predictors of intention to adopt PVAS are subjective norms, perceived behavioural control, knowledge and expectations. Furthermore, knowledge and expectations mediate the effect of attitudes, subjective norms, and perceived behavioural control on intention to adopt PVAS.
It is suggested that to increase the intention to use PVAS, patients must be given the opportunities and ease in using PVAS. The pharmacy facilities can enhance perceived behavioral control facilitating the ease of use and pharmacy staff should assist patients to reduce obstacles for using PVAS. The role of subjective norms suggested that one way to enhance PVAS adoption rate may be through normative support for collectivist cultures like Malaysia.43
The role of knowledge and expectations as mediators can also be exploited. Therefore, increasing the understanding and awareness of patients about PVAS can enhance the effects of attitudes, subjective norms, perceived behavioural control to increase the adoption rate of PVAS in Malaysia. To increase the knowledge and understanding of patients, pharmacists and staff at the counter can proactively educate and promote the various PVAS to assist patient’s choice. Electronic medical reminders and creative advertisement can serve to increase awareness in patients.
Patients with high expectations tend to have higher intention to use PVAS. The findings that expectations are both predictor and mediator informs policy makers that in order to increase the adoption rate of PVAS, the pharmacy facilities should strive to maximize their effort to meet the expectations of the patients. Efficient services, adequate medicine supplies, politeness and friendliness of staffs, more PVAS promotion and drug education, simpler registration procedures and comfortable drive through services might increase the adoption rate of PVAS in Malaysia.

