


 Servicios personalizados
 Inglés (pdf)
 Articulo en XML
 Referencias del artículo
 Enviar articulo por email
 Citado por SciELO
  Citado por Google
  Similares en
SciELO
Similares en
SciELO  Similares en Google
 Permalink
INTRODUCTION
Perioperative fluid therapy is considered a fundamental part of any surgical procedure, and recently it has gained great attention because it is notably impacting post-operative outcomes.1 The primary goals of postoperative intravenous (IV) fluid administration are to maintain or restore fluid and electrolyte balance, to correct the acid base imbalance and to maintain sufficient oxygen supply to organs.2-4
Despite the significance of the fluid therapy, there is no consensus about what kind of fluids should be prescribed or how much to be administered. This makes optimization of the fluid therapy a complex and challenging issue.5,6 For this reason, many cases have been reported to have a suboptimum management of fluid therapy, causing many complications, such as fluid and electrolyte disturbances, edemas and organ dysfunctions.3 Given such complications of improper fluid therapy, several studies have shed light on this problem.
The UK National Confidential Enquiry into Perioperative Deaths (NCEPOD) report has emphasized that giving too much or too little amount of fluids could cause serious postoperative morbidity and mortality. It was estimated that 20% of the participating patients in this report had either poor documentation of fluid balance or unrecognized and untreated fluid imbalance.7 Furthermore, Walsh (2005) and Ferenczi et al., (2007) showed that patients’ body weight, serum electrolyte, ongoing fluid loss and the fluid prescribed were not checked. Additionally, they found that 17% of patients showed significant fluid associated morbidity due to fluid overload.6,8,9 Lobo (2006) also found that mortality increased by 30% in the patients who gained more than 10% of body weight and by 100% in patients who gained more than 20% of body weight.10 Moreover, Walsh et al. (2008) showed that more than half of studied cases (54%) have experienced at least one fluid-associated complication.6,11 A report in 2011, launched by NCEPOD showed that risk of death is amplified for patients within thirty days after surgery if they are prescribed inappropriate amount of IV fluid preoperatively.6,12 Based on the evidence given above, inappropriate fluid therapy carries a significant risk during the peri-operative period.
In 2013, the National Institute for Health and Care Excellence (NICE) launched a new guideline for prescribing of IV fluid therapy to minimize fluid associated morbidity and mortality.13 Several studies showed pharmacist involvement and intervention through auditing, education and training were effective to improve the medication prescribing practice and achieve better clinical outcomes.6,14 Additionally, a review study in 2015 concluded that pharmacist intervention could improve IV fluid prescribing and enhance patient safety.6 In the Middle East, there were limited data about this topic and post-operative fluid associated complications were overlooked. This study was designed to evaluate the current prescribing practice of IV fluid therapy in an Iraqi public hospital and to explore the pharmacist role in improving the prescribing practice of fluid therapy using the NICE guideline.
METHODS
The prospective interventional study was conducted at the general surgery ward of AL-Hilla Teaching Hospital, Babel governorate, Iraq between November 2017 and July 2018. Patients who were admitted for elective surgeries in AL-Hilla teaching hospital and received IV fluid therapy for at least 48 hours were enrolled in this study.
The inclusion criteria were patients who were admitted to elective surgery in the general surgical ward of the hospital, received post-operative fluid therapy and did not have any pre-surgical fluid or electrolyte disturbances.
The patients were interviewed after obtaining their consent to collect their demographic information (age, gender, weight, height, date of admission, length of stay in the hospital, presence of disease), medical history, diagnosis and type of surgery. Then the patients were assessed to be included or excluded according to the study’s inclusion criteria.
This study included three phases: Pre-intervention (control group), intervention and post-intervention. In the pre-intervention phase which lasted for two months, we reviewed patient records (control group) who received postoperative fluid therapy. The researcher pharmacist measured blood electrolyte levels and serum creatinine level of each participant in addition to recording their weight and received fluids. The pharmacist intervention phase lasted for a month and included pharmacist (researcher)-led training and educational sessions for the hospital surgeons about the NICE guideline of fluid therapy. After the pharmacist-led intervention, we recruited other patients (post-intervention phase) who received postoperative fluid therapy. In summary, the pre-intervention (observation) phase lasted for two months; Intervention phase lasted for a month, while post-intervention phase lasted for two months.
The pharmacist-led intervention included seminars and posters to increase surgeon awareness about fluid prescribing according to the NICE, 2013. The pharmacist recommendations were according to the NICE guideline to maintain the amount of fluid prescribed post-operatively within 25-30 ml/kg/day of water in day 1 and day 2.
Subsequently, the participating patients were sorted into three groups according to the volume of fluid administered: Those who were administered fluid within the guideline recommended dose (25-30 ml/kg/day or 1 ml/kg/hr), those who received greater than the recommended dose and those who received less fluid than the recommended dose.
Patient weight was measured using a standard electronic scale. The weight was taken two times: At zero time (before surgery) and postoperatively (after administrating intravenous fluid). The pre-operative measures were conducted on the day before surgery (12-24 hours) when patients came to do required pre-operative lab tests (Hb and virology tests). On the other hand, the post-operative measures were conducted a couple of hours before discharging patient home which usually occurred 48-72 after surgery. In general, patients kept receiving post-operative IV fluids until they eat solid food and/or have a bowel movement which is usually extended to the last day of their hospital stay. In other words, post-operative measures were conducted a few hours after completing last fluid bottle. The measurement of serum electrolytes was conducted by the researcher using a fully automated electrolyte analyzer.
This study was approved by the Ethics and Scientific Committee of Kufa University Faculty of Pharmacy and the Ethical and Scientific Committee at Babel Health Directorate.
Statistical analyses
The SPSS version 23 (IBM, Chicago, IL) was used for data analyses. The descriptive data including frequencies, ranges, means, and percentages were measured. A p-value of less than 0.05 was considered statistically significant. A paired T-test was conducted to compare variables of each group before and after fluid therapy (within the same group). To compare variables in pre-interventional group with those of the post-intervention group, a Chi-square test was performed for categorical variables and an independent t-Test was used for continuous variables. Bivariate analysis using Pearson correlation coefficient was also used to measure the correlation between body weight and received fluid.
RESULTS
During the pre-interventional phase, only 84 out of 108 patients met the inclusion criteria and were included in the analyses. In the post-interventional phase, only 112 out of 138 patients met the eligibility criteria and were included in the analyses. Due to pre-surgical electrolyte abnormalities, 21 patients (9 with hyponatremia, 11 with hypernatremia and one with hyperkalemia) were excluded in the pre-interventional phase and 16 patients (4 with hyponatremia, 10 with hypernatremia and 2 with hyperkalemia) were excluded in the post-interventional phase. The baseline characteristics of patients and types of elective surgeries are shown in Table 1. Our study results showed during both phases pulse rate (PR) and BP significantly reduced post-operatively compared to pre-operatively.
Table 1. The baseline demographic data and characters of patients
| Variable | Pre Intv. group N=84 | Post Intv. group N=112 | p-value between groups |
|---|---|---|---|
| Age | 36.78 (SD 1.65) | 36.57 (SD 1.28) | 0.922 |
| Gender | 0.480 | ||
| Male | 26 (31.0%) | 40 (35.7%) | |
| Female | 58 (69.0%) | 72 (64.3%) | |
| Weight | 65.78 (SD 1.53) | 71.77 (SD 1.43) | 0.005* |
| Height | 163.05 (SD 0.90) | 164.13 (SD 0.59) | 0.296 |
| Type of surgery | 0.470 | ||
| Appendectomy | 24 (28.6%) | 20 (17.9%) | |
| Laparoscopic cholecystitis | 25 (29.8%) | 34 (30.4%) | |
| Hernia | 11 (13.1%) | 14 (12.5%) | |
| Thyroidectomy | 6 (7.1%) | 17 (15.2%) | |
| Intestinal and colonic surgery | 8 (9.5%) | 12 (10.7%) | |
| GUT surgery | 7 (8.3%) | 9 (8.0%) | |
| Others | 3 (3.6%) | 6 (5.4%) | |
| Systolic BP | 124.47 (SEM 1.72) | 128.82 (SEM 1.52) | 0.061 |
| Diastolic BP | 77.23 (SEM 0.93) | 77.56 (SEM 0.89) | 0.081 |
| Pulse Rate | 90.69 (SEM 1.43) | 87.13 (SEM 1.06) | 0.043* |
SEM= standard error mean.
*Significant difference (p-value <0.05). Chi-square test was used for categorical variables, while independent t-Test was used for continuous variables.
GUT= genitourinary tract
The amount of the postoperative fluid given to the pre-intervention group was significantly higher than the amount given to the post-intervention group (Table 2). More importantly, there was lack of correlation between the amount of fluid prescribed and the patients’ body weight in the pre-intervention phase (Figure 1). However, in the post- intervention phase, there was positive correlation between body weight and the amount of fluid prescribed postoperatively (Figure 2).
Table 2. Comparison of proportions of the patients given fluid amount according to the guideline. N (%)
| Parameter | Below the range | Within the range | Above the range | P-value |
|---|---|---|---|---|
| Fluid therapy (Day1) | 0.0001 * | |||
| Pre-intervention | 8 (9.5%) | 24 (28.6%) | 52 (61.9%) | |
| Post-intervention | 22 (19.6%) | 76 (67.9%) | 14 (12.5%) | |
| Fluid therapy (Day 2) | 0.0001* | |||
| Pre-intervention | 9 (10.7%) | 28 (33.3%) | 47 (56.0%) | |
| Post-intervention | 23 (20.5%) | 75 (67.0%) | 14 (12.5%) |
*significant according to chi-square test.
The recommended range of routine maintenance is 25-30 ml/kg.
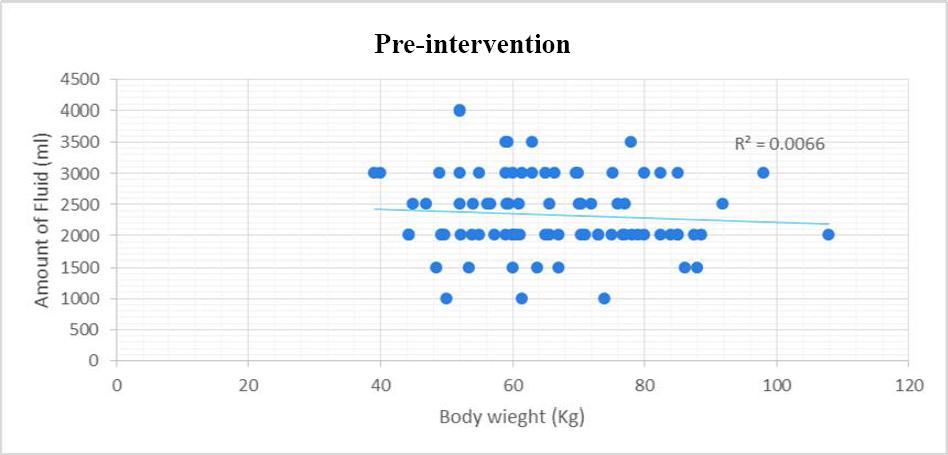
Figure 1. Correlation between body weight and amount of fluid prescribed in the pre intervention phase

On top of that, the current practice (pre-intervention) of fluid therapy showed that 61.9% and 56% of the patients during the first and second day respectively were given higher doses of the postoperative fluid than those recommended by the guideline. These prescribed fluids primarily relied on clinical judgment of the clinicians. Approximately third of patients had been prescribed fluid doses according to the guideline (25-30ml/kg). Additionally, 9.5% of patients in first day and 10.7% of patients in second day were given fluid doses below the guideline range (Table 2).
Interestingly, after the pharmacist-led intervention, the percent of patients who were prescribed postoperative fluid according to the guideline dramatically increased to 67.9% and 67% in the first and second day respectively. On the other hand, the proportion of patients who received fluid doses above the guideline range dramatically decreased to 12.5% in both postoperative days. However, the proportion of patients who received postoperative fluid less than the guideline recommended dose significantly increased to 19.6% in first day and to 20.5% in the second post-operative day (Table 2).
The current practice of fluid therapy during the pre-intervention phase caused significant (p<0.05) increases in patient body weight (average of 0.48 kilograms) after 2 days of fluid therapy compared to the baseline (before operation). On the other hand, in the post-intervention phase, there was no significant change in patient body weight compared to the baseline (Table 3).
Table 3. Effect of fluid therapy on body weight in pre and post-intervention groups
| Body Weight (Kg) | Pre-intv. group (N=84) Mean (Standard error) | Post-intv. group (N=112) Mean (Standard error) |
|---|---|---|
| Before IV. therapy | 65.77 (1.54) | 71.68 (1.41) |
| After IV. therapy | 66.24 (1.54) | 71.46 (1.44) |
| Change in weight | 0.48 (0.072) | -0.22 (0.2) |
| P-value within groups | 0.0001 | 0.120 |
Data expressed in mean ± standard error mean and analyzed using paired T-test
In the pre-intervention phase, the surgeon prescribing practice of fluid therapy resulted in a large percentage of serum electrolyte abnormalities, including 19% of the patients experiencing hypernatremia and 6% of them having hyponatremia. In contrast, in the post-intervention phase, the incidence of electrolyte abnormalities significantly (p-value < 0.05) decreased to 7.1% for hypernatremia and 1.8% for hyponatremia (Table 4).
Table 4. Number of patients with electrolyte abnormalities before and after intervention
| parameter | Normal | Below normal (hypo.) | Above normal (hyper.) |
|---|---|---|---|
| Sodium | |||
| Pre-intervention | 63 (75%) | 5 (6.0%) | 16 (19%) |
| Post- intervention | 102 (91.1%) | 2 (1.8%) | 8 (7.1%) |
| p-value | 0.009* | 0.009* | 0.004* |
| Potassium | |||
| Pre-intervention | 78 (92.9%) | 6 (7.1%) | 0 (0%) |
| Post- intervention | 110 (98.2%) | 1 (0.9%) | 1 (0.9%) |
| p-value | 0.046* | 0.033* | 0.184 |
Data were analyzed using chi-square test. Unites are frequency (N) and percent (%).
Electrolyte abnormalities (disturbances) include hypernatremia, hyponatremia, hyperkalemia and hypokalemia. Hypernatremia occurs when serum sodium ≥ 155 mmol/ l; Hyponatremia occurs when serum sodium is < 130 mmol/l. Hyperkalemia occurs when serum potassium is ≥ 5.5 mmol/l; Hypokalemia occurs when potassium level is < 3 mmol/l.
Regarding serum potassium, the pre-intervention prescribing practice caused several cases of hypokalemia (in 7.1% of the patients). In contrast, in the post-intervention group, only 0.9 % of the patients experienced hypokalemia which was significantly (p<0.05) lower than the pre-intervention phase (Table 4).
According to paired sample T-test, there was a significant (P-value < 0.05) increase in post-operative serum creatinine levels compared to pre-operative levels during the pre-intervention phase. In contrast, pharmacist-led intervention caused a significant decrease in post-operative serum creatine levels compared to pre-operative levels during the post-intervention phase (Table 5).
Table 5. Paired Samples t-Test to compare pre and post-operative serum creatinine during both pre-& post-intervention phases
| N | Mean | SD | Difference mean | P-value | |
|---|---|---|---|---|---|
| Pre-intervention phase | 0.000* | ||||
| Pre-operative blood Cr | 105 | 0.587 | 0.181 | 0.037 | |
| Post-operative blood Cr | 105 | 0.625 | 0.255 | ||
| Post-intervention phase | 0.000* | ||||
| Pre-operative blood Cr | 112 | 0.671 | 0.177 | -0.02 | |
| Post-operative blood Cr | 112 | 0.65 | 0.166 |
*Significant difference < 0.05 according to paired t-test. Cr=creatinine. SD= Standard deviation
SD= Standard deviation
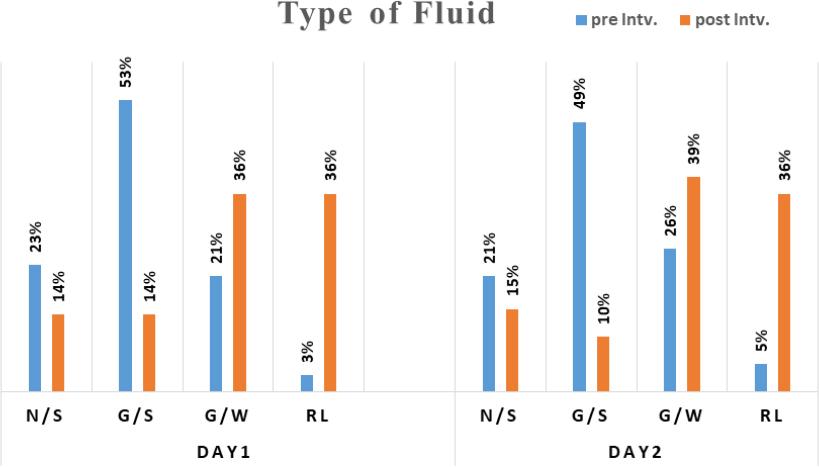
The fluid prescribing practice of pre-intervention phase revealed that the most commonly used post-operative IV fluids in the first and second day were saline containing fluids. Glucose saline (0.18% G/S) was prescribed in 53% of cases, while normal saline (0.9% N/S) was prescribed in 23% of cases. In contrast, Ringer lactate was rarely written in prescriptions with 3% in the first day and 5% in the second day. However, in the post-intervention phase, ringer lactate and glucose water were the most prescribed fluids, while the prescribing of saline containing fluids (N/S and G/S) decreased significantly (p<0.05) (by 10-15%) (Figure 3).
DISCUSSION
This study has not only focused on assessing the current prescribing practice, but has also showed how pharmacist educational intervention can enhance the prescribing and minimize post-operative fluid-associated complications.
The results of the pre-intervention phase showed the pattern of postoperative fluid prescribing was not consistent with the NICE guideline. The majority of patients were given higher doses of fluids compared to the amount recommended in the guideline. Furthermore, during the pre-intervention phase, there was no correlation between the prescribed amount of fluids and patients’ body weight. This inappropriate prescribing pattern of the postoperative fluids has been reported in a previous study.6 For instance, the data from a prospective audit in the UK showed that most patients receive an excess amount of the fluids and only few receive an insufficient amount of the fluids. Additionally, it found the volume of prescribed fluids is not correlated with preoperative body-weight.11 Likewise, a multi-center observational audit found significant variability in the fluid prescribing pattern and that body weight was not considered in the fluid prescribing.4
More importantly, we found that the patients gained on average about 0.5 Kg of weight after two days of fluid therapy. A previous study in the UK reported a similar pattern of results when patients’ weight notably increased due to perioperative extra-fluid volume.15 Similarly, a blinded randomized trial found that body weight increased in patients receiving liberal fluid therapy.16 Increases in the body weight due to excess amounts? of fluid directly associated with increased risk of morbidity and mortality.16,17 Previous studies reported that mortality increased by 30% to 100% in the patients who gained more than 10% or 20% of their body weight respectively.16,17
On top of that, the disturbances in the electrolyte levels were other complications during the pre-intervention phase due to improper prescribing of fluid electrolytes, namely sodium and potassium. The lack of potassium administration into postoperative fluids was noticed in almost all the participating cases. Accordingly, the patients’ serum potassium level remarkably decreased after two days of fluid therapy compared to the baseline level. Consequently, about 7.1% of the patients developed hypokalemia mainly because of lack of prescribing potassium. Although the mean of serum sodium level did not change significantly after two days of fluid therapy, electrolyte abnormalities were reported in some patients. Nineteen percent of the participants experienced high serum sodium and 6% of them developed hyponatremia. These results were comparable with previous study findings which showed inappropriate fluid and electrolyte prescribing practices particularly ordering excess of fluids and sodium but subtherapeutic doses of potassium (8). Similarly, a previous prospective audit of the perioperative fluid management of 106 patients found more than half of the patients developed fluid and electrolyte related complications including 27 hypokalaemia, 17 hyponatraemia, 4 hypernatremia, 3 hyperkalaemia, 13 new dysrhythmia and 19 cases of fluid overload.11
It is worthy to mention that prescribing a higher volume of fluid, excess of sodium and suboptimal potassium doses in each postoperative day are associated with morbidity and mortality and prolong hospital stay time.4,18 In the current study, two-thirds of the prescribed fluids were saline-containing solutions, and this might explain why the majority of patients received excess sodium and 19% of patients developed hypernatremia. Similarly, a previous study demonstrated that about one-quarter of surgeons prescribed more than four pints of 0.9% saline per day.19 The traditional use of 0.9% saline in the majority of postoperative patients has been also reported by a study including two-year prospective audits.20 This trend of high prescribing rate of 0.9% saline is associated with acid-base imbalance and electrolyte disturbances.21 These disturbances could adversely affect patient’s organ function and post-operative outcomes.10
The main reason behind these findings of inappropriate prescribing practices of fluid therapy is that firstly senior physicians may not pay as much attention to fluids as they do to other medicines. Physicians may think fluids do not cause as serious adverse effects as medications do. Secondly, the senior physicians delegate fluid prescribing to junior physicians. Korean and British studies confirmed that several errors in management of fluid and electrolyte therapy are due to inadequate knowledge and training of junior teams.22 23-24 Principally, appropriate fluid prescribing necessitates complete understanding the physiology of fluid and electrolyte hemostasis as well as the composition and properties of each type of intravenous fluid. Therefore, there is urgent need for education and training of medical staff about these fundamentals and requirements for prescribing fluid therapy.6,24
The present study assessed the impact of pharmacist intervention on fluid prescribing practices by improving the knowledge and understanding of principles of fluid therapy and the guideline. Thus, the researcher pharmacist presented lectures to physicians about the prescribing guideline of fluid therapy, and electrolyte physiology as well as properties and composition of fluid types. On top of that, we also provided detailed explanation about the NICE guideline of postoperative IV fluid therapy. Several studies presented the importance of clinical pharmacists as key members of the medical multidisciplinary team that could improve prescribing practices of IV fluid therapy by providing training and educational programs to other healthcare practitioners as well as reviewing fluid prescriptions.6,14
After the intervention program, we found significant improvement in prescribing patterns of fluid therapy as reflected by amount of fluid prescribed according to the recommended range of the guideline. We noted about 67% of patients received fluid doses according to the guideline (Table 2), which was remarkably higher than the percent reported in pre-intervention group (28.6-33.3%). Interestingly, the amount of fluid prescribed was significantly lower in the post-intervention group compared to the pre-intervention group (Table 2). This may be because physicians were overcautious about overloading patients following the intervention. Besides that, the prescribed volume of fluids showed a strong correlation with patients’ body weight (Figure 2). This finding reflected the effectiveness of the pharmacist-led intervention program through convincing the prescribers to consider patient body weight in prescribing fluid therapy. Additionally, in the post-interventional group, body weight notably did not change after fluid therapy compared to pre-operative weight. This might attribute to prescribed IV fluids based on body weight according to the NICE guideline.
More importantly, the incidence of electrolyte abnormalities was significantly lower after intervention compared to those in the pre-intervention group as reflected by lower percent of hypernatremia, hyponatremia and hypokalemia (Table 4). Reduction in electrolyte disturbance means minimizing potential serious adverse effects including heart and brain problems. This reduction in the incidence of electrolyte abnormalities is mainly attributed to the improvement in prescribing practice of fluids and electrolytes. In addition to reduction in electrolyte disturbances and weight gain, the intervention helped to lower post-operative serum creatinine level. However, the reduction in creatine level may be not clinically significant. All these positive influences of the intervention may improve patient clinical outcomes after minimizing fluid-induced adverse effects.
Additionally, pharmacist-led intervention led to reductions? in use of 0.9% saline solution. This reduction in use of 0.9% saline and favoring use of balance crystalloid solutions (ringer lactate and glucose water 5%) in surgical wards? is also noted after an educational program in teaching hospitals in the UK.20 A previous pilot study involved replacing 0.9% saline with balanced crystalloid through educational programs for nurses and junior doctors in order to achieve appropriate fluid prescription.25 Balanced fluids including Hartmann’s solution are considered more physiological and safer solutions. Hence, they are preferred for perioperative fluid.26,27 On top of that, the use of ringer lactate over saline is recommended by British guidelines? (26). Interestingly, the reduction in prescribed volume of fluids and shifting from saline-containing fluids to balanced solutions for postoperative patients is associated with better outcomes reflected by less fluid overload and edema, quicker bowel movement and less hospital stay time.20 Furthermore, recent randomized trials showed that the use of balanced crystalloid resulted in fewer mortality cases compared to saline in critically ill patients.28,29 Importantly, following the intervention, we demonstrated a trend of increasing the use of D5W alongside with ringer solutions which provided the largest amount of free water which might explain the considerable reduction in the incidence of hypernatremia in post-intervention group. In summary, the pharmacist-led intervention enhanced fluid prescribing practice which minimized the increase in body weight, electrolyte disturbances, and fluid overload.
The analyses of vital signs were not included in the study results because PR and BP may be affected (reduced) by anesthesia medications and may not reflect patient fluid volume. The study strength was the researcher had no obligatory impact on physician decision, but the collaboration was totally optional.
This study had a number of limitations. The study included a relatively small number of patients and was conducted in one hospital. However, it is a typical example of Iraqi general public hospitals. Number of participants before and after the pharmacist-led intervention was not equal. Although we measured vital signs (PR and BP), we did not include the analyses of vital signs in the study results. Finally, the study was neither randomized nor blinded.
CONCLUSIONS
The current practice of postoperative fluid prescribing in the Iraqi hospitals showed variability and suboptimal practice which resulted in fluid-associated complications such as fluid overload and increase incidence of iatrogenic-induced electrolyte abnormalities. The pharmacist-led intervention to implement the NICE guideline of fluid therapy was effective in improving prescribing practice by increasing consistency with the guideline in amount of fluid prescribed and decreasing the incidence of fluid associated complications including fluid overload, increased creatinine levels and electrolyte disturbances. It is essential that healthcare authorities implement a universal fluid prescribing guideline in Iraqi hospitals to minimize variability in prescribing practices and reduce fluid associated complications.

