


 Serviços customizados
 Inglês (pdf)
 Artigo em XML
 Referências do artigo
 Enviar este artigo por email
 Citado por SciELO
  Citado por Google
  Similares em
SciELO
Similares em
SciELO  Similares em Google
 Permalink
INTRODUCTION
Strengthening the workforce emerges as a topic of growing global interest to ensure the sustainability of public health programs and policies. 1 Main challenges and trends affecting workforce planning include the country's economic status, empowerment, gender balance, and especially the distribution of the workforce. 2 , 3
In many countries, pharmacists are considered to be the most accessible healthcare professionals. As the third most skilled, and in many cases the first point of contact within the healthcare system, pharmacists are an essential component of the healthcare workforce. 4 , 5 They are fundamental to achieve the goal of equitable access and rational drug use, a key objective of universal health coverage. 6 Pharmacists are playing an increasing role in primary healthcare centers (PHC), fulfilling a growing range of roles and responsibilities, especially for improving access and the appropriate use of medicines. 7 - 10
In Brazil, among the more than 210,000 registered pharmacists (around 10/10,000 inhabitants), more than 30,000 pharmacists work in PHC and are employed by the SUS. This number grew by 75% from 2008 to 2013. 11 , 12 Pharmacists in Brazil play a key role in the organization of the healthcare system because, unlike most countries, medicines dispensed by the public system are mostly financed, purchased, distributed, and dispensed by public health facilities. In many of the Brazilian municipalities, the management of the supply chain and of the pharmaceutical services is performed by pharmacists. In 33% of PHC, pharmacists work in dispensing and clinical services in interprofessional teams, although all health centers provide medicines to patients. 11 - 13 Some studies have questioned what is the ideal pharmacist workforce in PHC, pointing out that there is no magic number for the proportion of pharmacists. 10 A report from the International Pharmaceutical Federation (FIP) provided data on the pharmaceutical workforce in a number of countries. 4 , 14 , 15 However, data on the workforce capacity and distribution of pharmacists in public health services are lacking for many countries including Brazil. This lack of reliable data makes it difficult to adequately plan and develop the healthcare workforce needed for the adequately delivery of medicines and pharmaceutical services. 6
PHC is an important approach to achieve the Sustainable Development Goals for universal access to health through affordable, comprehensive, and appropriate healthcare. 16 Research indicates that PHC-consolidated countries and regions would have lower costs and better health outcomes. 8 , 17
Since its creation in 1990, the SUS has made consistent progress towards delivering universal and comprehensive health care to the Brazilian population, helping to reduce inequalities in health-care access and the achievement of better outcomes. The implementation of the SUS marked a shift in the model of health care through the rapid expansion of comprehensive PHC and the development of health networks for mental health services, hospitals, emergency care, and specialized outpatient services. 18 The right of access to medicines is ensured by ubiquitous public health care centers. 19 Purchase and distribution of medicines in public health centers represent about 16% of the expenditure of the health system. 20
The objective of the study was to analyze the pharmaceutical workforce in PHC in Brazil based on the conditioning factors, access to medicines and information on the use of medicines, and the distribution of pharmacists in public health facilities.
METHODS
Description of study population
In Brazil, PHC is organized and provided by the municipalities. Therefore, most of the workforce at this level is hired by municipal governments, with an estimate of over 44,000 PHC in 5,570 municipalities in the country, most of which dispense medicines free of charge. 21
Municipalities must plan, purchase and distribute essential medicines but funding is shared with federal and state government. Each municipality must have the infrastructure to govern the National Pharmaceutical Policy at this level, including access to medicines. 22 The population of this study is formed by pharmacists hired to work in municipal public health services.
National Survey on Access, Use and Promotion of Rational Use of Medicines (PNAUM)
PNAUM was established by the Ordinance of the Brazilian Ministry of Health no. 2077 on 17 September 2012 and performed in 2014-2015. 23 PNAUM aimed to characterize the organization of pharmaceutical services in the PHC of SUS, focusing on the access and promotion of the rational use of medicines, as well as to identify and discuss factors that affect the consolidation of pharmaceutical policy in the PHC in the municipalities. This was the first nationwide research focused on access and use of medicines in Brazil. 23, 24 PNAUM researched the management processes at municipal level, the PHC infrastructure, processes of the pharmaceutical services, the patients access to medicines and pharmaceutical services, availability of medicines, physicians’ opinions and legal aspects of the services provision. 24 It was conducted by a pool of Brazilian public funded universities.
The study populations were stratified by geographic region: North, Northeast, South, Southeast, and Midwest, and these strata constituted the study fields. Three samples were randomly selected including municipalities (managers), healthcare facilities (local managers, pharmacists, physician and technicians), and patients in each region. Data were collected from the observation of 1,175 pharmacies located into PHC, 507 face-to-face and telephone interviews with managers of pharmaceutical services of the municipal level, and face-to-face interviews with 285 pharmacists and 854 technicians in charge of medicines dispensing; 1,558 physician and 1,800 patients of the PHC included in the sample. The data collection used pre-coded questionnaires (collected on tablet computers) composed of closed-ended questions, developed by the research team and piloted in a different sample of municipalities. The data were collected by trained researchers, specifically hired for this project. 24 , 25
A full description of the research methodology is available in Álvares et al. and the report published by the Ministry of Health. 24 , 25 The PNAUM project were approved by the National Research Ethics Committee (Opinion 398.131/2013). 25
To represent the density of the pharmaceutical workforce in PHC, the measurement described in the FIP global pharmaceutical workforce reports was adopted as a parameter, where density was expressed as the number of pharmacists per 10,000 inhabitants. 26 This simple approach was the most commonly used metric for description and planning. 27
The absolute number of pharmacists working in public healthcare services by municipalities, the distribution of pharmacists by gender and function performed (coordinating and assisting functions), education, type of employment, and the number of healthcare units in the sample municipalities were collected.
In addition, access to medicines was obtained according to information from patients interviewed by PNAUM, using the following variable: In these last three months, how often did you get the medicines you were looking for at SUS public pharmacies?. 24
Based on the patient's responses, access was categorized as full access, partial access, or impaired access. Full access was attributed to responses from patients who claimed to obtain all necessary medications in the last three months. Partial or impaired access was answered by patients who were not able to obtain the medicines they sought at any time, sometimes, or rarely, in the last three months.
Patients were also asked if they had received information or guidance on the use of medicines at the PHC: When you pick up medicines at SUS public pharmacies, do the employees who deliver the medicines provide information or guidance on how to use them?. 24 There is no standardized format for providing information and guidance for the use of medicines in health centers. For this reason, any form of information provision was considered as information provided. Two categories were defined: received information, and little or no information (if the patient answered that receive information only sometimes or never receive).
Access to the requested medicines and receiving information and guidance on their use were the variables available in the PNAUM database and which were considered in this study as positive results for patient care. In addition to the PNAUM variables, secondary data on the socioeconomic indicators of each municipality were included: Gross Domestic Product (GDP), per capita income, population size (small municipalities were those with a population <20,000 inhabitants [70.4% of the Brazilian municipalities]; medium size-population, between >20,000 and <50,000 inhabitants [24.5% of the Brazilian municipalities]; and large size-population, >100 thousand inhabitants [5.1% of the Brazilian municipalities]); and the absolute number of public PHC units in each municipality of the sample classified by establishment type. 28 These data were collected in the online database available at the Department of Informatics portal of the Ministry of Health, accessed by the website www2.datasus.gov.br .
The Municipal Human Development Index (MHDI) was also included. The MHDI aggregates three important dimensions of human development represented by health, education, and income, which were grouped by the geometric mean, resulting in a number ranging from 0 to 1. The closer the number was to 1, the greater the human development of a healthcare unit: federal, municipal, metropolitan region or human development unit, i.e. a HDI of <0.550 is considered low human development; medium human development was between 0.550-0.699; high human development, between 0.700-0.799; and very high human development, >0.800. 29
The data related to the MHDI were collected in the online database available at the United Nations Development Program portal, accessed at www.atlasbrasil.org.br .
Statistical analysis
The analyses of the data collected by PNAUM were performed using SPSS (IBM Corp, Armonk, USA) version 25, using the CSPLAN command set, where commands and sample weights were applied to adjust the cluster design, as described in Álvares et al . 25
Descriptive statistical methods were weighted to adjust the demographic distribution of the PNAUM sample to the distribution of the Brazilian population, along with bivariate tests. 25 Pearson's chi-square test was performed to determine the relationship between the number of available pharmacists, the employment ratio, the weekly workload, PHC pharmaceutical practices, and each region of the country. Poisson regressions were performed using STATA software version 13 (Stata Corp LP, College Station, Texas, USA) using the proprietary svy command set for complex sample analysis. The variable was dichotomized in municipalities with <1 pharmacist per 10,000 inhabitants and municipalities with 1 or more pharmacist per 10,000 inhabitants. This made it possible to better understand the relationship between the variables studied. The adopted significance level was 5%.
RESULTS
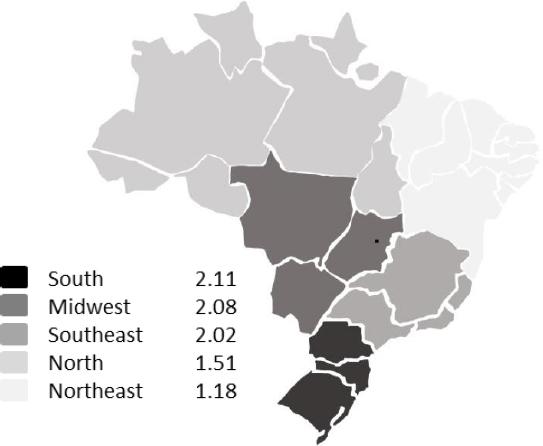
The global average of pharmacists for every 10,000 inhabitants in public services offered at PHC in Brazil was 1.76 (95%CI 1.61: 1.90). The difference between the regions, South, 2.11 (95%CI 1.82: 2.41) and Northeast, 1.19 (95%CI 0.94: 1.44) was almost 1 pharmacist per 10,000 population. There was a higher prevalence of municipalities with ≥1 pharmacist per 10,000 inhabitants ( Figure 1 ).
No differences were observed between the prevalence of pharmacists by sex, age group, or weekly workload in municipalities with a pharmacists rate per 10,000 Inhabitants (PRI) of 1 or over when compared to those in municipalities with a PRI of <1. Table 1 presents data regarding the characterization of the pharmaceutical workforce in Brazil considering PRI.
Table 1. Sample characterization and comparison between municipalities with less and more than 1 pharmacist per 10,000 inhabitants
| Pharmacists /10000 inhabitants | Poisson regressions Univariate | ||||
|---|---|---|---|---|---|
| Less than 1 % [CI95%] | 1 or more % [CI95%] | p-value | RP [CI 95%] | p-value | |
| Sex | |||||
| Female | 38.6 [32,7-44,9] | 61.4 [55.1-67.3] | 0.925 | 1.01 [0.85 -1.20] | 0.925 |
| Male | 39.1 [31,2-47,7] | 60.9 [52.3-68.8] | 1 | ||
| Age Range | |||||
| Up to 30 years | 37.0 [29,5-45,3] | 6.0 [54.7-70.5] | 0.614 | 1.82 [0.39 -8.45] | 0.443 |
| 31 to 49 years | 38.2 [31,6-45,3] | 61.8 [54.7-68.4] | 1.79 [0.39 -8.28] | 0.458 | |
| 50 to 59 years | 45.9 [28,2-64,8] | 54.1 [35.2-71.8] | 1.56 [0.33 -7.51] | 0.576 | |
| 60 or more | 65.4 [15,4-95,1] | 34.,6 [4.9-84.6] | 1 | ||
| Employment | |||||
| Server Competed | 33.6 [27,4-40,3] | 66.4 [59.7-72.6] | 0.002 | 1.48 [1.13 -1.94] | 0.004 |
| Commissioned | 55.9 [44,9-66,4] | 44.1 [33.6-55.1] | 1 | ||
| Other | 35.0 [25,4-46,1] | 65.0 [53.9-74.6] | 2.10 [1.61 -2.74] | <0.001 | |
| Weekly workload | |||||
| Up to 30 hours | 42.6 [34,4-51,2] | 57.4 [48.8-65.6] | 0.216 | 1.11 [0.93 -1.33] | 0.244 |
| more than 30 hours | 36.3 [30,5-42,5] | 63.7 [57.5-69.5] | 1 | ||
Two roles played by pharmacist in PHC were highlighted: the management activities of the pharmaceutical services, the supply chain and the dispensing of medicines. In 95.7% (95%CI 91.5: 97.9) of the municipalities, the management of pharmaceutical services in the healthcare department was the responsibility of a pharmacist. Only 43.8% (95%CI 36.2: 51.7) of PHC units had a pharmacist during all hours of operation. When this percentage was stratified by the region of the country, the Northeast and North, had the lower proportions of full-time pharmacists on their work team. The ecological design of the sample using Poisson regressions demonstrated significant differences between the analyzed variables related to PRI, as shown in Table 2 .
Table 2. Ecological design - Comparison between groups of pharmacists and the variables studied
| Pharmacists /10000 inhabitants | Poisson Regression Univariate | ||||
|---|---|---|---|---|---|
| Less than 1 % [CI95%] | 1 or more % [CI95%] | p-value | RP [CI95%] | p-value | |
| Population Size | |||||
| Up to 25,000 inhabitants | 24.6 [20.0 -29.9] | 75.4 [70.1 -80] | <0.001 | 3.77 [1.49-9.55] | 0.005 |
| 25,000 to 100,000 inhabitants | 83.1 [72.6 -90.1] | 16.9 [9.9 -27.4] | 0.85 [0.29-2.45] | 0.759 | |
| Over 100,000 inhabitants | 80.0 [55.8 -92.7] | 20.0 [7.3 -44.2] | 1 | ||
| Group to which the municipality belongs (sample) | |||||
| Capitals | 83.3 [62.3 -93.8] | 16.7 [6.2 -37.7] | <0.001 | ||
| 0.5% higher in the region | 100.0 [100.0 -100.0] | 0 [0 - 0] | |||
| Smaller municipalities | 5.3 [2.2 -12.6] | 94.7 [87.4 -97.8] | |||
| MHDI | |||||
| 0-0.699 | 42.8 [36.6 -49.3] | 57.2 [50.7 -63.4] | 0.031 | 1 | |
| 0.7-0.800 | 31.8 [24.9 -39.7] | 68.2 [60.3 -75.1] | 1.19 [1.02-1.39] | <0.001 | |
| Region | |||||
| North | 51.3 [41 -61.4] | 48.7 [38.6 -59] | <0.001 | 1.18 [0.84-1.66] | 0.333 |
| Midwest | 31.2 [22.7 -41.0] | 68.8 [59.0 -77.3] | 1.67 [1.24-2.24] | 0.001 | |
| South | 26.8 [18.9 -36.5] | 73.2 [63.5 -81.1] | 1.76 [1.33-2.37] | <0.001 | |
| Southeast | 27.5 [19.7 -36.9] | 72.5 [63.1 -80.3] | 1.76 [1.32-2.34] | <0.001 | |
| Northeast | 58.7 [47.7 -69.0] | 41.3 [31 -52.3] | 1 | ||
| HC tax | |||||
| up to 3.23 | 54.3 [42.5 -65.7] | 45.7 [34.3 -57.5] | 0.001 | 1 | |
| 3.24 -4.29 | 43.2 [33.7 -53.4] | 56.8 [46.6 -66.3] | 1.24 [0.91 -1.71] | 0.178 | |
| 4.30 -6.30 | 40.8 [31.6 -50.6] | 59.2 [49.4 -68.4] | 1.30 [0.95 -1.77] | 0.098 | |
| over 6.30 | 24.2 [16.8 -33.6] | 75.8 [66.4 -83.2] | 1.66 [1.25 -2.21] | 0.001 | |
| Per capita income (quartile) | |||||
| up to USD4200 | 47.4 [38.1 -56.9] | 52.6 [43.1 -61.9] | 0.086 | 1 | |
| USD4200 -USD7530 | 34.1 [24.8 -44.7] | 65.9 [55.3 -75.2] | 1.25 [0.99 -1.59] | 0.063 | |
| USD7530 -USD12597 | 33.4 [24.6 -43.6] | 66.6 [56.4 -75.4] | 1.27 [1.00 -1.60] | 0.047 | |
| over USD12597 | 34.4 [25.2 -45] | 65.6 [55 -74.8] | 1.25 [0.98 -1.58] | 0.067 | |
| GDP (quartile) | |||||
| up to USD35300 | 16.5 [10.1 -25.9] | 83.5 [74.1 -89.9] | <0.001 | 3.21 [2.13 -4.85] | <0.001 |
| USD35300 -USD79700 | 27.9 [20 -37.5] | 72.1 [62.5 -80] | 2.77 [1.83 -4.22] | <0.001 | |
| USD79700 -USD199000 | 50.7 [41.2 -60.1] | 49.3 [39.9 -58.8] | 1.90 [1.21 -2.98] | 0.005 | |
| over USD199,000 | 74.0 [62.5 -83] | 26 [17.0 -37.5] | 1.0 | ||
GDP=Gross Domestic Product; HC=healthcare unit; MHDI=Municipal Human Development Index.
It was observed that 75.4% of the municipalities with a population size up to 25,000 inhabitants and 94.7% of the smaller municipalities with up to two PHC had a PRI of >1, while in 80% of municipalities with population over 100,000 inhabitants (83.3% of the capital city, and in 100% of the largest municipalities in each region) the PRI was <1.
When relating PRI to socioeconomic indicators, significant differences were highlighted in the municipalities with GDP up to USD 35,300, of which 83.5% had a PRI of 1 or over. In contrast, 74% of municipalities with GDP over USD 199,000 had a PRI of <1.
Regarding per capita income, there were no significant variations between municipalities and PRI. When grouping the MHDI into two categories (namely, lower and higher), significant differences were observed between the studied groups. In 68.2% of the municipalities within the highest MHDI, the PRI is 1 or over.
Regarding the receipt of information or guidance on medicines use, in 78.9% (p<0.001) of municipalities with a PRI of 1 or over, patients claimed to always receive information. On the other hand, users in 54.4% of the municipalities claimed to receive little or no information, PRI was <1. In the analysis of access to medicines, no statistically significant differences were observed, although it was found that 79.1% of municipalities with a PRI of 1 or over had full access to medicines. Among patients who indicated partial or impaired access, the percentage of municipalities with a PRI of 1 or over decreased to 58.2% ( Table 3 ).
Table 3. Primary healthcare workforce indicators
| Pharmacists /10000 inhabitants | |||
|---|---|---|---|
| Less than 1; % [CI95%] | 1 or more; % [CI95%] | p-value | |
| Access to medicines | 0.091 | ||
| Full access | 20.9 [7.8 -45.3] | 79.1 [54.7 -92.2] | |
| Partial / Impaired access | 41.8 [33.8 -50.2] | 58.2 [49.8 -66.2] | |
| Receiving information | <0.001 | ||
| Received information | 21.1 [13.2 -31.9] | 78.9 [68.1 -86.8] | |
| Little or no information | 54.4 [43.6 -64.9] | 45.6 [35.1 -56.4] | |
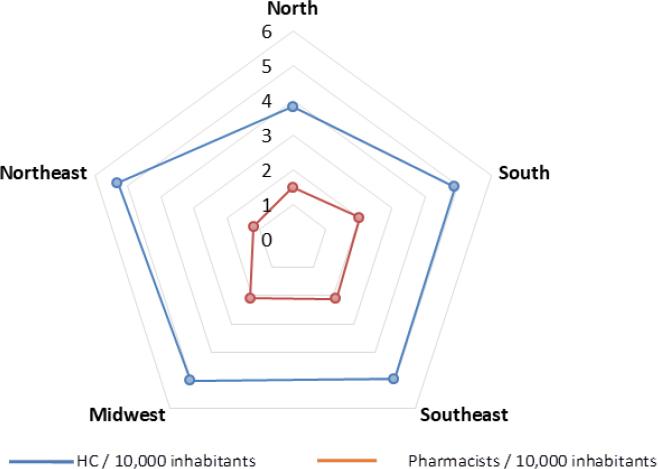
The density of the pharmaceutical workforce in PHC in Brazil through the association between the healthcare unit rate per 10,000 populations and the PRI is shown in Figure 2 . In all regions, the healthcare unit rate was predominantly higher than the PRI, the Northeast was 1.18 (95%CI 0.94: 1.43) and North was 1.51 (95%CI 1.18: 1.84).
DISCUSSION
The results show that the most of the Brazilian municipalities have a rate of 1 or higher pharmacist per 10,000 inhabitants working in public system PHC. However, they also show an uneven distribution of the pharmaceutical workforce in public PHC in Brazil. The Brazilian public health system helped to achieve a narrowing of health inequalities with improvements in coverage and access to healthcare across the country, but large variations remain between municipalities regarding the infrastructure, human resources, management capacity, and access to effective healthcare services. 12 , 18 The differences in pharmaceutical workforce can be observed, in this study, between the different geographical regions, the different population sizes, and the different socioeconomic conditions of the municipalities.
Unlike the pattern of concentration of pharmacists and other healthcare professionals in private services, in public PHC the highest density of pharmacists is found in small municipalities. It is evident that the larger municipalities also have a lower rate of healthcare units and serve larger populations, while the small municipalities have more healthcare units serving smaller populations and higher concentration of pharmacists. This scenario results in a higher rate of pharmacists in small municipalities, that have an also a higher rate of healthcare units per population. Therefore, in Brazil, the population living in smaller municipalities is more likely to have better access to pharmacists in PHC services than those living in larger cities. Small municipalities represent 45% of all Brazilian municipalities, where 208,494,900 inhabitants live. 28 So these results have great relevance for the planning and evaluation of pharmaceutical services in the country.
In addition to being smaller in population, municipalities with a higher prevalence of a PRI of 1 or over, also have a higher MHDI. It is noteworthy that 3,110 (72%) municipalities with up to 25,000 inhabitants are in the range between medium to very high human development. Moreover, it is evident that the municipalities with a PRI of 1 or over have a lower GDP. In larger municipalities, GDP rises due to the big business concentrated in large cities, since GDP in Brazil is calculated through the share with which each municipality contributes. In the municipalities with a PRI 1 or over, GDP was lower and the MHDI showed better results. This results support the understanding that the MHDI indicates the development resulted from social policies and is not limited to economic growth. 29 In this scenario, the investment in hiring of pharmacists makes up the framework for the development of local public policies in these municipalities.
The density of the pharmacy workforce per capita varies considerably across countries and regions and generally correlates with population size and country-level economic indicators. The economic situation of a country is directly related to the per capita health expenditure and pharmaceutical density. 4 The results here show that, in PHC public funded services, PRI is related to investments in social policies and economic development and not necessarily pure economic index.
The study also revealed an important difference in the density of pharmacists between the geographic regions, with the municipalities with lower PRI being concentrated in the North and Northeast regions of the country. These regions have historically been the ones with the greatest social and economic problems, which are reflected in the worst health indicators and greatest weaknesses in the organization of their public services. In them are concentrated the municipalities with the lowest MHDI. But these are also the regions that received attention from public policies in the last decade and, for this reason, showed significant growth in PHC and health professionals. 12
Between 2008 and 2013, the population of the country grew at a rate of 6%; healthcare units grew 12%; and the number of accredited professionals registered in PHC grew 24%. This data reveals a significant expansion of the PHC capacity, an increase in the number of jobs, and the possibility of developing interprofessional collaboration. Nurses and physician grew 42% and 17% in the same period, while other accredited professionals presented much higher growth, with rates above 70%, as in the case of pharmacists, physiotherapists, nutritionists, physical education professionals, and occupational therapists. 12 In this scenario, pharmacists have been engaged in collaborative activities in the PHC: 39.8% claim they participate in PHC team meetings, and more than 30% claim they are engaged in prevention of diseases and health promotion activities. 30 Although only 29% claim that they perform clinical services, their effective participation in primary health care services has the potential to generate positive health results, as has been shown in several studies. 31
The high prevalence of total access to medicines in Brazil was demonstrated by PNAUM in a previous publication. Access rates were 94.3%, 5.2%, and 0.5% for total, partial and null access, respectively. 32 This positive outcome is understood to be as a result of incentives to public health policies, investments and financial resources, standardization, and procurement of medicines in recent years. 19 The results of this study also show that full access to medicines is more often reported among PHC patients in municipalities with a PRI of 1 or over. Total access occurred in 79.1% of municipalities with 1 or more pharmacists per 10,000 inhabitants. Among patients who indicated partial and impaired access, the percentage of municipalities with a PRI of 1 or over decreased to 58.2%. Although not representing a statistically significant difference, the higher proportion may raise hypotheses for further investigation. In addition, the indicator on information about the use of the medicines received by the patients revealed that in 78.9% of municipalities with a PRI of 1 or over, patients always received information compared to 45.6% of municipalities with a PRI of 1 or over receiving little or no information.
Globally, countries with the lowest number of pharmacists per capita are likely to have less access to medicines, as well as the provision of pharmaceutical services and advice. 4 In agreement, it is argued that the increase in PRI or the higher density of pharmacists in PHC becomes an important factor related to improving people access to medicines and information about their treatment. The results also suggest that the employment of pharmacists in PHC in Brazil is a well-established trend in municipal health management policy. In most municipalities with PRI 1 or over, pharmacists are hired by public tender and have stability in their function. Considering that the number of pharmacists hired to work in public PHC in Brazil grew by 75% in 5 years. 11 , 12 It can be inferred that the good performance of SUS in providing access to essential medicines in the last decade and the increase in the density of pharmacists in PHC are conditions that go together. 32 The greater number of pharmacists employed in a municipality may also represent evidence of greater investment by the municipality in its local pharmaceutical policy.
CONCLUSIONS
The study shows that there are positive results related to a higher rate of pharmacists in the SUS. In municipalities with a PRI 1 or over, public PHC patients are more likely to receive information about the medicines they receive, with a possible trend of greater access to medicines among these municipalities. The PHC's pharmaceutical workforce scenario in Brazil is characterized by a higher concentration of pharmacists in small municipalities with higher MHDI, mainly in the South and Southeast regions of the country. It is essential that the healthcare system invest in the continuous growth of the pharmaceutical workforce to meet the demands of this level of health care and achieve better health outcomes.

