


 Servicios personalizados
 Inglés (pdf)
 Articulo en XML
 Referencias del artículo
 Enviar articulo por email
 Citado por SciELO
  Citado por Google
  Similares en
SciELO
Similares en
SciELO  Similares en Google
 Permalink
INTRODUCTION
In the past decades, the field of pharmacy practice experienced several transformations – pharmacists have gone from mainly performing medication dispensing activities to offering individualized specialized care as part of healthcare teams. These innovations in pharmacy practice services and the pharmacy professionals who provide those services are now recognized as a key resource of the healthcare system for the promotion of safe and rational use of drugs. 1 Such service innovations usually include complex multidimensional interventions provided through educational, attitudinal, or behavioral actions. 2 , 3
The culture of evidence-based care promotion, quality-linked incentives, and patient-centered actions, which are associated with the natural financial constraints on the healthcare budget, resulted in a growing interest by policy-makers in expanding pharmacists' roles in primary and secondary care. 4 In fact, multiple studies have demonstrated the positive clinical outcomes associated with pharmacist-provided care in a wide array of diseases, including diabetes, hyperlipidemia, HIV/AIDS, cardiovascular, respiratory, and mental diseases. 5 - 14 Nevertheless, the extensive body of evidence showing the effectiveness of pharmacist-led services failed to include economic analyses that further support a more broadly adoption and implementation of these services. 2 , 3
Pharmacoeconomics is the branch of health economics that focuses on weighing the costs and benefits of a particular intervention in comparison with an analogous alternative. This type of analysis is critical given the goal of maximizing value for patients, healthcare payers and society in light of increasingly scarce resources. 15 , 16 In general, new healthcare interventions (drugs, medical devices, or services) are costlier than the existing ones. Nevertheless, these usually provide added benefits (or 'increased value') over the standard of care. Thus, decisions-makers (e.g., healthcare professionals, politicians, and other stakeholders) have to consider whether or not the new intervention is both affordable and an efficient use of limited resources. Full pharmacoeconomic evaluations also inform reimbursement or coverage decisions, which can ultimately result in price negotiations. 16 , 17
A recent review suggested that many of the studies aiming at performing an 'economic evaluation of pharmacy services' suffer from severe methodological limitations. The authors contend that those studies are neither full economic analysis, nor do they comply with the accepted standards for conducts and report economic analysis. 4 The common limitations in determining the cost-effectiveness of pharmacist interventions include: 1) not performing an incremental analysis (i.e., no comparator) or fail to evaluate both costs and outcomes; 2) incorrectly assessing the costs of the pharmacy service itself or failing to consider other costs in the analysis in addition to the pharmacy benefit. 18 Additionally, the many tasks involved in a pharmacy service can make it difficult to attribute a price tag on each component of the intervention. Lastly, it is possible that some outcomes measures (e.g., utilities) might not fully capture the value of complex interventions or be sensitive to the benefit generated by the pharmacy service intervention. 4 , 17 , 19
In this context, it is important for the pharmacy practice field to produce economic evaluations of innovative pharmacy services utilizing the appropriate methodological input. 4 , 17 , 19 A full economic evaluation is not a single research method; it is a framework for structuring specific decision problems. 15 Thus, researchers should be noticeably clear about the intervention's aim, targets, context, process, patient group and comparator, costs, outcomes, and decision model used. This is especially important because the evidence that is generated should be sufficiently reliable to be inform decision-making, service planning, and to truly reflect the opportunity for expanding the role of pharmacists in healthcare. 6 , 17
Therefore, our aim is to provide an overview of the main components of pharmacoeconomic evaluations that can and should be used for the assessment of pharmacy practice services, including those provided or led by the pharmacist, and discuss some recommendations for future studies.
Pharmacoeconomic evaluations: key components
The main inputs and definitions that should be considered in pharmacoeconomic evaluation are depicted in Table 1 .
Table 1. Summarized definitions of the main elements of economic evaluations
| Brief definition | |
|---|---|
| Economic evaluation | A comparative analysis of at least two health interventions used to assess both the costs and consequences of the different technologies in a given population, providing a decision framework. The two main components of this analysis are 'costs' and 'outcomes' |
| Target population | The group of patients or subgroups who will benefit from the health intervention |
| Comparators | Interventions being compared in the economic evaluation (e.g., drugs, vaccines, medical procedures, services) |
| Setting | The context in which the intervention will occur. |
| Perspective | The different viewpoints from which health benefits and costs can be assessed (e.g., patient, provider, payer, society in general) |
| Time horizon | The duration over which costs and outcomes (i.e., benefits/consequences) are calculated in a economic analysis |
| Opportunity cost | Represents the forgone benefit that would have been derived by an option not chosen |
| Costs | Refers to the monetary component of the economic analysis. It can be divided into direct, indirect medical and non-medical costs, and intangible costs |
| Outcomes | Also called 'benefits' or 'consequences', the outcomes are the expected healthcare or humanistic results from an intervention |
| Willingness to pay (WTP) | The process in which individuals are asked the maximum they are willing to pay, in monetary terms, to achieve a given benefit of a intervention/service. |
| Discounting | Method used to account for individuals time preference. Most individuals have a positive rate of time preference whereby benefits are preferred sooner rather than later, and costs incurred later rather than sooner |
| Modeling | Decision analyses from economic evaluations can be operationalized through modeling processes such as decision trees or simulation models |
| Sensitivity analysis | A means of representing uncertainty in the results of economic evaluations. The four main types of sensitivity analyses are: one-way simple sensitivity analysis, multiway sensitivity analysis, threshold sensitivity analysis, probabilistic sensitivity analysis |
The Professional Society for Health Economics and Outcomes Research (ISPOR) is responsible for creating guidelines for the conduction and reporting of pharmacoeconomic studies. The elements encompassed in Table 1 are a brief summary of the Consolidated Health Economic Evaluation Reporting Standards (CHEERS) statement. However, it is important to further highlight two of these concepts that should be considered by pharmacy practice researchers when performing an economic evaluation:
1) The concept of opportunity cost refers to the loss of potential benefits from other options when one option is chosen. This concept is based upon the idea that the scarcity of resources leads players to expend capital on one healthcare activity by sacrificing services elsewhere. Thus, understanding the potential missed opportunities foregone by choosing one technology over another allows for better decision-making. 20
2) Willingness to pay (WTP) refers to an extra-welfarist perspective of decision-making: the ideal health intervention is the one that yields better value up to a certain threshold, assuming all patients (target population) will benefit equally from that intervention. The use of a WTP threshold allows decision-makers to decide sat what point is it worth to pay for more value. 21 , 22
The first step in any cost analysis is the identification of the various costs (i.e., monetary outcomes), that are usually classified in direct, indirect medical or non-medical costs, and intangible costs. Direct costs refer to those paid directly to healthcare service (i.e., associated with patients' treatment). They can be classified into medical or non-medical direct costs, depending on whether they refer to actual medical procedures or other ancillary associated costs (direct non-medical). Because of the flexibility in how medical care is provided, costs can also be classified as fixed or variable, according to the changes in the volume of services provided (Table 2 ). Indirect costs refer to those experienced by patients', family or society, as the loss of earnings or productivity resulting from patients' illness. Intangible costs are attributed to the amount of suffering that occurs due to illness or healthcare intervention. These are usually difficult to ascertain and quantify in monetary terms. However, researchers conducting studies from a societal perspective increasingly included these data in their assessments. Depending on whether the costing method follows a macro- or micro-costing approach, cost can be measured as:
Table 2. Examples of costs for economic evaluations
| Direct costs | Healthcare resources and related services (medical costs) |
| Staffing (e.g., physicians, nurses) | |
| Consumables (e.g., drugs, treatments) | |
| Consultations, exams, procedures | |
| Hospital and intensive care admissions | |
| Home healthcare | |
| Overheads (e.g., administration, laundry) | |
| Capital (e.g., equipments, installations) | |
| Ambulance services (e.g., emergency) | |
| Voluntary workers | |
| Costs to patients/families (non-medical costs) | |
| Extra expenses from treatments | |
| Travel costs to and from clinic/hospital | |
| Temporary residence | |
| Social service | |
| Indirect costs | Costs to patients/families or society |
| Work incapacity (e.g., loss of productivity) | |
| Loss of earnings | |
| Loss of leisure time | |
| Premature death from disease | |
| Intangible costs | Costs to patients/families or society |
| Psychological suffering (e.g., worry/distress) | |
| Pain |
The second component of any economic analysis is the outcome to be measured, that is defined as the expected benefits from an intervention. 'Benefit' measurement aims to be equally comprehensive by incorporating all of the impacts upon the patients' life that result as a consequence of the use of the health intervention. The defined benefits are seen as the value derived from choosing option A over B. They can measure in: (i) Natural units (e.g., years of life gained, events prevented [strokes prevented, surgeries avoided, peptic ulcers healed, etc.]); (ii) Utility units which aim to encompass as much as possible the notion of 'value' (e.g. quality of a state of health (and not just its quantity) or the satisfaction derived from moving from one state of health to another as a consequence of the application of an intervention). Such utility estimates are frequently informed by some measurement of 'quality of life' in different disease states.
One of the most common summaries of quality and quantity of life is the Quality Adjusted Life Year (QALY) measure. QALYs are calculated by estimating the years of life remaining for a patient following a particular treatment or intervention and weighting each year with a quality-of-life score (on a 0 to 1 scale where 0 refers to 'dead' and 1 to 'perfect health'). It is often measured in terms of the person's ability to carry out the activities of daily life, and freedom from pain and mental disturbance. Other used measure is the disability adjusted life year (DALY) that reflects an overall disease burden, expressed as the number of years lost due to ill-health, disability or early death.
However, it is important to remember that utility measures on the subject of quality of life attempt to incorporate into the analysis the physical, social and emotional aspects of the patient's well-being, which may not be directly measurable in clinical terms. 16 , 23 These utility measures are based on patient preferences, i.e. they ascertain the relative preferences of a group of patients in a specific context. For example, a QALY improvement from 0.3 to 0.4 does not necessarily translate in a specific clinical improvement in the quality of life, but rather in an overall (physical, social, or emotional) improvement that makes the patient prefer the 0.4 over the 0.3 QALY outcomes. In this sense, several methods have been proposed to measure quality of life based upon widely different techniques and value systems (e.g., time trade off or standard gambles, imputed data from literature, expert opinion). 24
Once costs and outcomes have been ascertained, the two health alternative interventions can be compared to each other. The majority of cost-effectiveness studies follow an extra-welfarist approach, in which it is assumed that the benefits of a given intervention are comparable and specific to all patients in that target population. Thus, the ability to decide which intervention is in fact accepted as more cost-effective is based on the comparison of the incremental cost-effectiveness ratio to an accepted WTP threshold. 25 , 26 Using WTP to estimate the benefits of healthcare allows individuals to value both health outcomes, non-health outcomes and process attributes. 25 , 26 The thresholds are generally considered to be helpful with respect to sustainability and optimization of healthcare systems. However, there are ethical concerns and political sensitivity that hinder explicit acceptance of a concrete threshold. Additionally, thresholds are derived within a framework of theoretical assumptions that may difficult their application in real world settings. WTP thresholds can be estimated using different techniques. One method is to define WTP by the society's WTP for health gains such as one additional year of survival or one additional QALY. By contrast, the World Health Organization (WHO) uses the Gross Domestic Product Per Capita (GDPPC) to suggest cost-effectiveness thresholds for over 14 geographical regions. Incremental cost-effectiveness ratios (ICERs) up to the GDPPC are considered as 'very cost-effective', values within the range of 1 x GDPPC and 3 x GDPPC are considered as 'cost effective' and the remainder are considered 'not cost effective' (>3 x GDPPC). Other approach refers to exhausting a fixed budget, where cost-effectiveness ratios for health interventions are ranked from lowest to highest costs per QALY. 27
Many countries establish different WTP thresholds for health gains. In Australia, the Health Technology Assessment (HTA) body (Pharmaceutical Benefits Advisory Committee) stated in 1999 an implied threshold for a positive recommendation of 46,400 Australian dollars (i.e., 1.35 times the GDPPC per QALY gained). However, no currently fixed threshold exists and other aspects of the evidence such as confidence in the clinical data are just as important to the committee as estimated cost-effectiveness ratios. Since at least 2000, the United Kingdom's (UK) National Institute for Health and Care Excellence (NICE) has used an explicit cost-effectiveness threshold of between 20,000 and 30,000 GBP (i.e., 1.18 and 1.76 times the GDPPC, respectively), but only 0.70 and 1.04 times the corresponding product for 2015, respectively - per QALY gained. Additionally, technologies that appear less cost-effective may still be recommended if they are for end-of-life care or for diseases associated with short life expectancies. When cancer drugs are consistently found to have cost-effectiveness ratios of more than GBP 30,000 per QALY gained, an alternative funding mechanism can be discussed among the players. That is to say, WTP is not always the same. It may vary according to the different diseases or clinical conditions (e.g., different QALYs for cancer vs. non-cancer patients) and due to political and socioeconomic factors in each country. This warrants on the importance of creating acceptability curves for each scenario and whether or not QALY in itself is a sensible measure of the health gain that is being measured. 22 , 27 , 28
Considering the complexity of the interventions such as pharmacist services, their assessment seemingly proves to be even more challenging due to surrounding uncertainty on the clinical utility they can provide and their effect on patient outcomes. In this case, the use of unique measures such as QALY may not be sufficient to reflect the real value of the intervention. Besides, different value measures may lead to using different WTP thresholds as already mentioned. In this scenario, the use of Value Assessment Frameworks (VAF), a set of tools and thresholds beyond cost-effectiveness analysis, can also help determine whether a health intervention can be approved, covered, or used in a given setting. These assessments are able to provide value to comprehensively map the current issues of steady economic evaluations and identify structural uncertainties to be taken into account. They typically use predefined key principles (i.e., substantive criteria including the cost-effectiveness analysis), which are believed to reflect the most important range and diversity of stakeholders' values. 29
The economic evaluations have another important component, called 'perspective', that represents the point of view adopted when deciding which types of costs and health benefits are to be included in the analysis. Typical viewpoints are those of the patient, health insurance companies and employer (e.g., payers), hospital/clinic or healthcare professionals (e.g. providers), healthcare systems or society. 15 , 30 The most comprehensive perspective is societal as it includes the perspectives of all stakeholders in healthcare, aiming at reflecting a full range of social opportunity costs associated with different interventions. In particular, this includes productivity losses arising from patients' inability to work, and changes in these losses associated with a new technology. The UK NICE recommends that any pharmacoeconomic analyses submitted to the regulators should include a societal perspective – called the 'reference case'. 16 However, given the likely cost-saving nature pharmacy practice interventions can potentially be assessed from a payer or provider perspective. 31 , 32
The time horizon used for an economic evaluation is the duration over which both costs and outcomes are estimated. The choice of time horizon is an important decision for economic modelling and depends on the nature of the disease and intervention under consideration and the objectives of the analysis. For instance, longer time horizons are recommended for chronic conditions associated with on-going medical management, rather than a cure. A shorter time horizon may be appropriate for some acute conditions, for which long-term consequences are less important. In countries with universal health care systems that rely on HTA agencies for decision of coverage or reimbursement usually follow lifetime horizon, although it may be useful in sensitivity analysis to test out intermediate time-horizons (e.g., 5 to 10 years), for which there may be more robust data. Additionally, it is important to consider that the use of long-term time horizon is likely to involve extrapolating the cohort (i.e., group of patients) experience into the future and making assumptions about the continued efficacy of interventions and costs of care, as well as discounting of future inputs. 33 , 34
The discounting is a method that accounts for individuals time preference, considering that costs and outcomes can occur at different times when using a technology. Most individuals have a positive rate of time preference whereby benefits are preferred sooner, and costs incurred later. In economic evaluations, the discount rates of costs and outcomes is performed if the costs and effectiveness outcomes are considered beyond 12-month time periods. The present value of money, as well as better health, is higher than future costs and outcomes. 35 The discount rate varies according to the HTA body or country in which the evaluation is being conducted. For instance, the NICE currently recommends a discount rate of 3.5% for both costs and outcomes.
Modeling can be broadly defined as the reproduction of events and possible consequences due to alternative policy options at the cohort or individual levels using mathematical/statistical framework. The use of decision models to assess the costs and benefits of the compared strategies are paramount in economic evaluations that are part of decision-making processes for incorporation and financing of technologies of healthcare systems. These decision analyses can be operationalized through decision trees or simulation models. 36 - 38 Additionally, to address uncertainty involved in estimations of costs, outcomes, and other variables used in a decision analysis, sensitivity analysis should be performed. This type of analysis may find that including variables such as indirect costs in the model or using a reasonable higher discount rate, changes the cost-effectiveness of one intervention compared to another. The four main types of sensitivity analyses are: one-way simple sensitivity analysis, multiway sensitivity analysis, threshold sensitivity analysis, probabilistic sensitivity analysis. 38 , 39
Considering the above-mentioned concepts, the economic analyses can be classified according to the nature of the outcomes they evaluate ( Table 3 ).
Table 3. Pharmacoeconomic analysis according to costs and outcomes
| Type of analysis | Valuation of costs * | Valuation of health outcomes | Calculation |
|---|---|---|---|
| Cost of illness analysis (COI) | $ | None | At disease level |
| Budget-impact analysis (BIA) | $ | None or various ** | Compare interventions |
| Cost-minimization analysis (CMA) | $ | Assume same | Compare interventions |
| Cost-consequence analysis (CCA) | $ | Natural units | Compare interventions |
| Cost-effectiveness analysis (CEA) | $ | Natural units | Cost-benefit ratio |
| Cost-utility analysis (CUA) | $ | Utility units | Cost-benefit ratio |
| Cost-benefit analysis (CBA) | $ | $ | Ratio or net costs and benefits |
*Any currency.
**It can determine the impact of a technology on a designated nonfixed budget or it can maximize some health outcome within a designated fixed budget.
Adapted from the US National Information Center on Health Services Research and Health Care Technology (NICHSR) www.nlm.nhi.gov/nichsr/hta101/ta10107.html
Cost-of-illness analysis (COI): aims to determine the economic impact (burden) of a disease or condition on a given population or region/country including the associated treatments costs. This analysis can be useful to prioritize between diseases. However, it is not sufficient to ground efficient healthcare allocation for coverage and reimbursement decisions of a particular intervention (e.g. a high-cost burden does not mean that treatments are available to reduce this burden). 40 , 41 In this case, budget-impact analysis (BIA) is preferable, as affordability is also important for short-run economic purposes.
Budget-impact analysis (BIA): estimates the impact of implementing or adopting a new intervention, or technology on a designated healthcare budget. This method is able to assesses the affordability of a healthcare intervention if the intervention is used within an environment as compared to not used within that environment ( Figure 1 ). 42 , 43 The BIA is usually performed from the payer perspective (model inputs), considers the size of the population, and has a short-term time horizon (e.g. 3 to 5 years). The only model output is the cost.
Cost-minimization analysis (CMA): aims to determine the least costly among alternative technologies that are assumed to produce equivalent healthcare outcomes (~same efficacy/safety profiles). The evidence on the equivalence must be referenced by the author conducting the study and should have been done prior to the cost-minimization analysis. 16
Cost-effectiveness analysis (CEA): one of the most used economic evaluation worldwide, it is defined by ISPOR as a comparison of interventions regarding costs in monetary units and outcomes expressed in quantitative non-monetary health units (e.g., reduced mortality or morbidity, symptom-free days gained, cases prevented, patients improved, life years gained). 23 , 44 Conversely to BIA, the CEA usually considers a longer-term time horizon based on data provided by the clinical studies and using forecasting techniques to predict the future. Additionally, discounting rates and the inputs consider the population average are applied. If there are just two alternative technologies being assessed by the CEA, their difference in cost (incremental cost) is compared to their difference in outcomes (incremental effect) by dividing the former by the latter. This ratio is known as the incremental cost-effectiveness ratio (ICER). If there are more than two alternatives, they are compared on a systematic pairwise basis using their ICERs. 23 , 35


A cost-effectiveness plane diagram can illustrate the different situations during a decision analysis and also used to demonstrate the meaning and use of the ceiling ratio, where it is often referred to as demonstrating cost-effectiveness acceptability or WTP ( Figure 2).
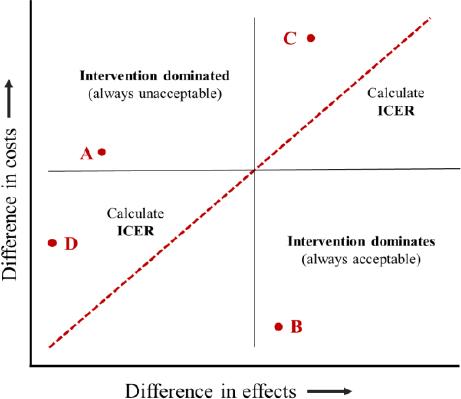
In this plan diagram, ICERs are presented graphically as a combination of the costs and the effects of a health intervention, compared to an alternative. Costs are conventionally placed on the north-south (top-bottom) axis and effects on the east-west (right-left) axis. In both cases, these effects can be negative, zero or positive. If the intervention lies in the top left quadrant, such as point A ( Figure 2 ), the costs of the intervention are higher than its alternative, and its benefits are lower. As this is unambiguously worse than its alternatives, the intervention is considered 'dominated' and should be rejected. 'Domination' means 'economic efficiency', where the dominated alternative has greater cost with no greater benefits or lower benefits with no smaller costs. Similarly, in the bottom right quadrant (point B), costs are lower and benefits are higher than its alternatives, so a treatment alternative 'dominates' and should be considered. For both the top right (point C) and bottom left (point D) quadrants, neither alternative dominates. In this situation, ICERs should be calculated (measured as the slope of the line from the origin to the point). For point C, the ICER represents the cost per unit of effect gained, while for point D it refers to a cost saving per unit of effect lost.
Cost-utility analysis (CUA): a form of CEA that compares costs in monetary units with health outcomes regarding their utility and mortality, which is expressed in QALYs. This is the preferred type of economic evaluation as it allows the use of the same health outcome for all interventions and diseases, and thus to help decision-makers to allocate resources efficiently. 23 , 24 , 44 Similar to CEA, the ICER in the CUA is calculated considering a ratio of costs over benefits, in this case, over QALYs.
Cost-consequence analysis (CCA): a form of CEA that presents costs and health outcomes in discrete categories, without aggregating or placing weights on the costs and health outcomes. 15 , 16
Cost-benefit analysis (CBA): compares costs and health benefits (and risks), all of which are quantified in common monetary units. 15 , 16
In economic evaluations, the decision analyses are usually operationalized through decision trees or simulation models. A decision analysis tree outlines and quantifies the consequences of the two or more options of a decision to be made. It can be represented by means of a tree diagram ( Figure 3 ) that is constituted by one decision node at the root; branches representing all the strategies that are to be compared; a series of chance nodes off every strategy branch from which emanate the possible consequences of each choice (e.g., transition states); and outcomes depicted at the end of each pathway. The likelihood of advancing to a given transition state is called transition probabilities. In decision trees, these transition states require them to be mutually exclusive, so that the sum of all transition probabilities emanating from a chance node is always inexorably one. Finally, the terminal nodes, where the health impact of each consequence, called payoff (e.g., utilities), is quantified in the analysis. 19 , 45

In computer-based decision-analytic modeling, the state-transition modeling is frequently used as is considered an intuitive, flexible and transparent approach. It can be used to model a cohort of patients (called Markov cohort model) or individuals (called microsimulation or first-order Monte Carlo model). 30 , 38 Markov models are analytical frameworks that represent disease processes evolving over time and are suited to model progression of chronic disease as this type of model can handle disease recurrence and estimate long-term costs and life years gained/QALYs. This type of model use 'disease states' to represent all possible consequences of an intervention of interest. These are mutually exclusive and exhaustive and so each individual represented in the model can be in one and only one of these disease states at a specified or fixed period of time. Individuals move ('transition') between disease states as their condition changes over time. Time itself is considered as discrete time periods called 'cycles' (e.g., number of weeks or months, or years), and movements from one disease state to another (in the subsequent time period) are presented as 'transition probabilities'. At the end of each cycle, the individual can either stay in the same health state or move to another health state. Time spent in each disease state for a single model cycle (and transitions between states) is associated with a cost and a health outcome ( Figure 4 ). 30 , 45

Discrete event simulation is another model with flexible frameworks that is useful in emergency care or in the transmission of infections (e.g., constrained resources environments). In these cases, the events must be mutually exclusive and individuals progress through the model only if they experience a new event. However, because this type of model is used to represent complex systems, it is usually more difficult to develop, implement, and analyze. 30 , 45 , 46
Regardless of their structural form, several similarities across healthcare decision analyses exist:
They require the clinical and policy relevant features of the problem, the time horizon of the analysis and the description of the target population.
They require information on the probability of experiencing a health state or a health event (called transition probabilities).
They require data on the payoff(s) associated with a health state or health event (e.g., cost, health effect, or both).
Almost all healthcare decision analyses use inputs from multiple studies or sources given to limitations on data availability.
Application of pharmacoeconomics: the case of pharmacy services
One of the primary applications of pharmacoeconomics in clinical practice is to guide clinical and policy decision making. Pharmacists are increasingly providing services intended to facilitate patients' access to care and improve health and medication use and outcomes. 17 , 47 Many of today's pharmacists provide a broad range of non-dispensing services such as vaccinations, coordination and review of medications, management of chronic diseases, prevention and wellness programs, point-of care testing. 7 , 13 In these cases, besides the performance of economic evaluations to confirm the added value of the pharmacist in the environment, payment models need to be developed for non-dispensing services to be sustainable. 47 , 48
A review on the available international remuneration programs to pharmacists for non-dispensing services 48 demonstrated an increase in the number of new programs for reimbursement of pharmacist providing patient care services, especially those related to medication therapy management and injections administration. Performance-based payment models have the potential to enhance value by creating a meritocratic system whereby providers delivering the best patient care are rewarded, while providers failing to provide such care are given incentives to improve. 49 However, few examples of incentive-based reimbursement models for pharmacists provided services exist and they are usually in early stages. The study of Zeater et al . reports that a wide range of measures are used to assess the financial performance of professional services in community pharmacy, which hinders the ability to compare results between studies. 47 Early experiences also suggest that unless these systems are appropriately designed, payments can be withheld from high performers, bonuses paid to low performers, and health disparities can be worsened. 49 Model to financially assess professional pharmacy services by means of a structured approach have been recently proposed, but there is still room for improvement. 47 , 49 This is important as value-based payment models have been touted as an approach that rewards quality and value in healthcare. 13 , 47
The implementation of VAFs in this context, although innovative, are even more critical, as using just QALY or DALY as the utility measures may not reflect the true value of the pharmacist intervention in short-term periods. 18 The development of theory-based frameworks is able to conceptualize the value that technologies or pharmacist-led services provide to the payers. For instance, pharmacy quality can be defined as achieving a degree of excellence by providing services which maximize the probability of positive outcomes and minimize the probability of negative outcomes. 47 , 49 Accordingly, pharmacy value can be defined as achieving quality goals while simultaneously reducing healthcare spending or keeping spending constant, or reducing spending while improving or maintaining quality. 50 However, no single value assessment framework can simultaneously reflect multiple decision contexts and the perspectives of the patient, the health plan, or society as a whole. Thus, it is important for any framework to clearly articulate the value construct it represents and the perspective and decision context in which it is to be used, and to be well validated and reliable within that construct and context. 29
The appropriate conduction, reporting and interpretation of economic evaluations allow practitioners and administrators to make better, more informed decisions regarding the available technologies and services for both patient and healthcare system levels. 15 , 19 The CHEERS statement can help during this process and should be strictly followed by authors of economic evaluations of pharmacist-led services. The parameters of an economic evaluation should be considered in the same way as those from clinical trials (e.g., population, intervention, comparator, outcome and timing – PICOT). The population comprises the modelled population, sources of input data and assumptions for which must be clearly articulated so that its generalizability and applicability can be ascertained. The intervention is the technology or service of interest, and all assumptions made about its use should be clearly described. The outcomes and costs will depend on the consequences of the interventions and the perspective adopted. The appropriate expression of the time horizon is important because ICERs vary with time. 45
Although key methodological challenges are common to all economic evaluations, studies on the economic impact of pharmacist interventions are usually poorly described, incorrectly designed or do not constitute full evaluations. 4 , 6 Additionally, several authors state having difficulties in pricing pharmacists' services given the complex amount of performed interventions, which precludes further economic evaluations in the field. 4 , 17 , 19 The poor design or large heterogeneity between primary studies (e.g., randomized controlled trials) of pharmacy services also prevent many studies from finding pharmacist interventions effective or cost-effective.
Elliot et al . showed that from the 31 published cost-effectiveness studies on pharmacy services evaluated in their review, 90.3% clearly described the intervention, but only 67.7% described the comparator pathway. 4 Almost 20% of studies lack on reporting the method applied to obtain resources use and around 75% did not perform an appropriate statistical analysis of costs. Direct costs of interventions were clearly incorporated in only half of the studies. Most ICERs were generated from process indicators such as errors and adherence, with only 4 studies (12.9%) reporting cost per QALY. Around one-third of the cost-effectiveness analyses were unclear about the time horizon. Data uncertainty and sensitivity analyses were performed in only 35% and 30% of studies, respectively, and methods used were not noticeably clear in most cases. These attempts to conduct economic evaluation of pharmacy services are almost exclusively from the US and the UK, with some representation from the Netherlands, Canada, and Australia. Few details the costs of service provision and even fewer give an estimate of service benefits or consequences other than decreased drug expenditure. Usually, studies focus on quantifying pharmacists' interventions, but lack on demonstrating the quality or impact of the service, which can be due the service itself or issues in the methodologic design of the study. 4 , 6 , 51
Recently, Murphy et al . identified three main areas in which the pharmacist has an economic impact that include: decreasing total health expenditures, decreasing unnecessary care, and decreasing societal costs. Authors discuss that, although evidence supports the potential economic value of the pharmacist in different healthcare settings, public opinion and political movements supporting patients' access to pharmacist-provided care are variable. In this context, strategies to advocate and effect change include a better understanding of this positive economic value of the pharmacist. 17
Thus, future high-quality economic evaluations with robust methodologies and study design are still required to investigate what pharmacist services have significant clinical and humanistic benefits to patients and substantiate the greatest cost savings for healthcare budgets. More work is also needed to develop valid and reliable composite pharmacy value measures to support future performance-based pharmacy payment models.

