


Mi SciELO
 Servicios personalizados
Servicios Personalizados
Revista
Articulo
 texto en
  Inglés (pdf)
 Articulo en XML
 Referencias del artículo
 Enviar articulo por email
Indicadores
-
 Citado por SciELO
 -
 Accesos
Links relacionados
-
 Citado por Google
 -
 Similares en
SciELO
Similares en
SciELO -
 Similares en Google
Compartir

 Permalink
Revista de Osteoporosis y Metabolismo Mineral
versión On-line ISSN 2173-2345versión impresa ISSN 1889-836X
Rev Osteoporos Metab Miner vol.9 no.1 Madrid ene./mar. 2017
https://dx.doi.org/10.4321/s1889-836x2017000100005
Originales
Identification of genetic variants associated with bone mineral density (BMD) in the FLJ42280 gene
1Departamento de Genética, Microbiología y Estadística - Facultad de Biología - Universidad de Barcelona - CIBERER (Centro de Investigación en Red de Enfermedades Raras) - IBUB (Instituto de Biomedicina de la Universidad de Barcelona) - Barcelona (España)
2Departamento de Genética, Microbiología y Estadística - Facultad de Biología - Universidad de Barcelona - CIBERER (Centro de Investigación en Red de Enfermedades Raras) - IBUB (Instituto de Biomedicina de la Universidad de Barcelona) - Barcelona (España)
3Departamento de Genética, Microbiología y Estadística - Facultad de Biología - Universidad de Barcelona - CIBERER (Centro de Investigación en Red de Enfermedades Raras) - IBUB (Instituto de Biomedicina de la Universidad de Barcelona) - Barcelona (España)
4Laboratorios Roche Diagnostics Deutschland GmbH - Mannheim (Alemania)
5Departamento de Genética, Microbiología y Estadística - Facultad de Biología - Universidad de Barcelona - CIBERER (Centro de Investigación en Red de Enfermedades Raras) - IBUB (Instituto de Biomedicina de la Universidad de Barcelona) - Barcelona (España)
6Departamento de Genética, Microbiología y Estadística - Facultad de Biología - Universidad de Barcelona - CIBERER (Centro de Investigación en Red de Enfermedades Raras) - IBUB (Instituto de Biomedicina de la Universidad de Barcelona) - Barcelona (España)
7Unidad de Investigación de Patología Ósea y Articular (URFOA) - IMIM (Instituto Hospital del Mar de Investigaciones Médicas) - Parque de Salud Mar - RETICEF (Red Temática de Investigación Cooperativa en Envejecimiento y Fragilidad) - Barcelona (España)
8Unidad de Investigación de Patología Ósea y Articular (URFOA) - IMIM (Instituto Hospital del Mar de Investigaciones Médicas) - Parque de Salud Mar - RETICEF (Red Temática de Investigación Cooperativa en Envejecimiento y Fragilidad) - Barcelona (España)
9Unidad de Investigación de Patología Ósea y Articular (URFOA) - IMIM (Instituto Hospital del Mar de Investigaciones Médicas) - Parque de Salud Mar - RETICEF (Red Temática de Investigación Cooperativa en Envejecimiento y Fragilidad) - Barcelona (España)
10Unidad de Investigación de Patología Ósea y Articular (URFOA) - IMIM (Instituto Hospital del Mar de Investigaciones Médicas) - Parque de Salud Mar - RETICEF (Red Temática de Investigación Cooperativa en Envejecimiento y Fragilidad) - Barcelona (España)
11Departamento de Genética, Microbiología y Estadística - Facultad de Biología - Universidad de Barcelona - CIBERER (Centro de Investigación en Red de Enfermedades Raras) - IBUB (Instituto de Biomedicina de la Universidad de Barcelona) - Barcelona (España)
12Departamento de Genética, Microbiología y Estadística - Facultad de Biología - Universidad de Barcelona - CIBERER (Centro de Investigación en Red de Enfermedades Raras) - IBUB (Instituto de Biomedicina de la Universidad de Barcelona) - Barcelona (España)
Introduction
Osteoporosis is a complex disease characterized by low bone mass and deterioration of the bone tissue’s microarchitecture which raises the risk of fracture. In the US, for example, there are 1.5 million new cases of fracture each year, thus incurring a huge economic burden for health care services. Osteoporosis is defined clinically by measuring bone mineral density (BMD), which remains the best means of predicting fracture [1,2]. Studies of heritability using twins or families have shown that 50-85% of the variation in bone mineral density is genetically determined [3]. Osteoporotic fractures also show independent heritability of bone mineral density [4].
Genome-wide association studies (GWAS) have greatly expanded our understanding of the genetic architecture of common and complex diseases [5]. This genomic approach is providing key information on disease mechanisms, with perspectives for designing more effective strategies for assessing disease risk and developing new therapeutic interventions [6]. However, genetic variants that are identified in GWAs are often found in non-coding regions of the genome whose possible function is less well known and in many cases these signals may be in linkage disequilibrium with non genotyped causal variants. The GWA meta-analysis for BMD and osteoporotic fracture of Estrada et al. [7] identified up to 56 genomic loci associated with BMD, 14 of which were also associated with osteoporotic fractures. One of the SNPs whose association with both phenotypes showed a more robust significance (rs4727338) was found in an intronic region of the FLJ42280 gene, marking it as a locus of osteoporotic susceptibility (Figure 1). Other GWA studies showed that other intronic SNPs of the same gene (rs7781370, rs10429035 and rs4729260) were also associated with BMD [8,9]. FLJ42280 is a gene which has not been studied extensively and its relation with bone biology is not known.

Figure 1 7q21.3 genomic region with the BMD association signals of the SNPs tested by Estrada et al. [7].The coordinate between the SNP genomic position rs4727338 (x-axis) and the -log10 p-value (y-axis) of its association with BMD (y-axis) is marked with a red line box. This SNP shows the greatest significance in this region. The colored points are the coordinates of the rest of the SNPs studied in the region. Each color indicates a different degree of linkage disequilibrium between each SNP and the SNP rs4727338. The FLJ42280 gene is not shown because, at the time the GWAs meta-analysis was performed, this gene was not yet annotated in the genome. Its location between SLC25A13 and SHFM1 is indicated by a red oval. This figure is a modification of what is presented in Estrada et al. [7]
In this context, the aim of our work was to give meaning to this association by determining what the causal variant is. Is rs4727338 the causal SNP or is there another SNP in linkage disequilibrium with it that is the true functional SNP? To answer this question, we have explored the genetic variability of the genomic region where the FLJ42280 gene is found and have addressed the functionality of these variants by different approaches. First, by resequencing the region in women with extremely high or extremely low BMD to look for variants with an unbalanced distribution between the two groups; Secondly, a bioinformatic study of the overlapping of the variants found with functional signals defined in the ENCODE project (The Encyclopedia of DNA Elements) and finally evaluate the possible role as eQTLs of some of the variants found.
Material and methods
Selection of study sample
The sample of this study consists of 100 women from the BARCOS [10] cohort. This cohort is composed of about 1,500 Spanish postmenopausal women monitored at the Hospital del Mar de Barcelona. Women diagnosed with osteomalacia, Paget's disease, some metabolic or endocrine disorder, or those undergoing hormone replacement therapy or drug treatment that could affect bone mass were excluded from the cohort. Women with early menopause (before age 40) were also excluded. The data collected for each sample were BMD, age, age of first menstruation, age of menopause, years since menopause, weight and height. Blood samples and informed, written consents were obtained from each patient according to the regulations of the Marital Health Park Clinical Research Ethics Committee. BMD (g/cm2) was measured at the femoral neck and lumbar spine. A dual energy X-ray densitometer was used to carry out the measurements.
Two groups of 50 samples with extreme BMD values were selected according to the Z-score value. Specifically, the groups consisted of the 50 samples with the highest Z-score (range: 2.98 to 0.73) and the 50 samples with the lowest Z-score (range: -2.41 to -4.26) of the BOATS cohort.
Preparation of genomic samples
Each woman's DNA was extracted from peripheral blood samples. The concentration and quality of the DNA samples (260/280 and 260/230 ratios) were measured by spectrophotometry on a NanoDrop ND-1000 (NanoDrop Products) instrument. To determine DNA integrity, 5 µl of each sample was analyzed by 1% agarose gel electrophoresis. Finally, the samples were normalized to a concentration of 100 ng/µl.
Long-Range PCR (LR-PCR)
A 28 kb genomic region (containing the FLJ42280 gene [22 kb] along with 3.8 kb of flanking region at 5 'and 2 kb of flanking region at 3') was divided into 7 overlapping fragments (Figure 2). The sizes and coordinates of these 7 fragments and the primer pairs used to amplify them are shown in Table 1. The fragments, 2 to 5 kb, were amplified by LR-PCR. Each LR-PCR reaction included: 100 ng of genomic DNA, 5 µl of "Magnesium +" Ex Taq buffer (20 mM Mg++; Takara) x10, mixture of dNTPs (2.5 mM each), Ex Taq polymerase 5 U/µl) and primers (20 µM), in a final volume of 50 µl. The reactions were carried out in a GeneAmp® PCR System 2700 (Applied Biosystems) thermocycler. Each fragment required distinct elongation time and hybridization temperature conditions. The total number of amplicons was 700 (100 samples x 7 fragments). The quantity and quality of all amplicons were checked by 1% w/v agarose gel electrophoresis in TBE x1 buffer.
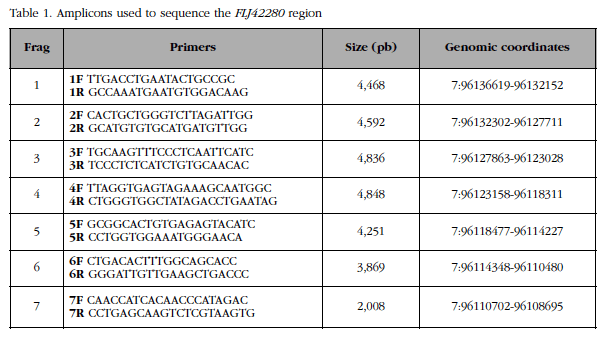

Figure 2 In the genomic region of FLJ42280 previous GWA studies have identified 4 SNPs showing association with BMD, details of which are shown in the table included in the figureTo better understand the variability of this locus, the region was subdivided into 7 overlapping fragments (yellow arrows) for resequencing in women with very high or very low BMD
Purification and quantification of samples
To remove the residues from the PCR reagents, the PCR products were purified using 96-well filter plates with a suitable pore size (Pall Corporation). The vacuum (Vacuum Manifold, Merck Millipore) was applied and the DNA retained in the filter was resuspended in 35 µl of milliQ water. The PCR products were then quantified using the Quant-iT PicoGreen dsDNA Reagent Kit (Life Technologies) following manufacturer's instructions. Briefly, a standard curve of concentrations was constructed by fluorescence emission measurements at 520 nm after the DNA was excited at 480 nm. The curve was then used to calculate the samples' DNA concentration.
Standardization of sample concentrations and pooling
The samples on the plates were normalized to a concentration of 5 ng/µl and then 5 µl of each sample of one plate (one tube per plate) was mixed in a single tube using the epMotion® 5075 Liquid Handling Workstation (Eppendorf). Thus, 14 tubes with 250 µl each were obtained, two for each PCR fragment (high BMD and low BMD). The 14 pools were pooled up to 5 times using the Genevac EZ-2 evaporator (Genevac SP Scientific) and each tube was quantified using Qubit® 2.0 Fluorometer (Life Technologies). Finally, the PCR fragments were mixed equimolarly in two tubes, one for high BMD and one for low BMD.
Massively parallel sequencing
The mass sequencing of the samples was carried out at the Genomics Service of the Scientific and Technological Centers of the University of Barcelona, using the GS 454 Junior System (Roche). Briefly, the DNA was fragmented by nebulization, two labeled libraries were prepared with adapters (sequences of 10 nucleotides), one for each group, which were mixed in a single tube. The mixture was then amplified by emulsion PCR and the final library was loaded onto a picotiter plate for pyrosequencing. Four sequencing runs were carried out, corresponding to 140 Mb of final data (35 Mb/stroke). This volume of data provides a theoretical coverage of 40x for each initial sample.
Processing of sequencing data and variant selection
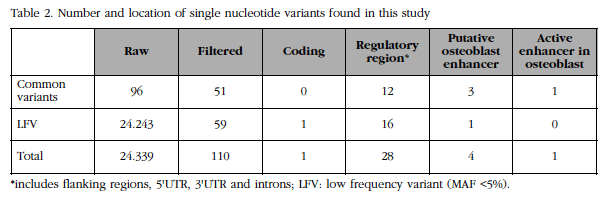
The readings obtained from the sequencing were preprocessed based on their quality and aligned against the reference genome (GRCh37) using the GS Mapper program (Roche). The readings were indexed and filtered using SAMtools. The variants present in the two groups were detected by GATK using standard filtering parameters [11]. The variants found were prioritized according to the following criteria: variants were selected with a coverage of at least 1,000 readings, present in 1% of readings and with a low bias strand. The number of readings of the variants that passed the filters was normalized by the coverage and the variants were classified between common (with a frequency greater than 5%) and rare or low frequency (with frequency less than 5%).
Functional and statistical analysis of variants
The frequencies of each variant were compared between the two groups using an exact Fisher's test, applying the Bonferroni correction for multiple comparisons. The functional analysis of variants consisted in looking at whether they were described in databases such as dbSNP and 1000 Genomes and, if so, searching for their MAF in the European and Iberian population. In addition, for the exonic variants it was observed what amino acid change they assumed and their severity predicted by SIFT, PolyPhen and Provean. For the intronic variants, we analyzed the region containing the variant: sites of hypersensitivity to DNAse, binding of transcription factors, DNA methylation, histone modifications and regulatory regions. All these data were obtained from databases and repositories such as Ensembl, UCSC Genome Browser, ENCODE, BioMart, MatInspector. HaploReg was also used to search for regulatory annotations. Finally, all the variants found were analyzed with the Ensembl Variant Effect Predictor and UCSC and with the SNP function prediction from the US National Institute of Environmental Health Sciences.
Analysis of linkage disequilibrium
To calculate the linkage disequilibrium between all variants of the genomic region of FLJ42280 we used the genotypes of the SNPs present in the region and the haplotypes of the individuals of HapMap phase 3. To calculate such an imbalance and generate a graph the software was used HaploView.
EQTL Analysis
The SNPs that gave significant differences in the GWAs and the SNP rs4613908 were assessed as possible eQTLs using two approaches: using the GTEx project portal and using the genotypes of those SNPs in HapMap individuals and the levels of cis gene expression in the same individuals. Specifically, the SNPs genotypes were obtained from 210 unrelated HapMap phase 1 and 2 individuals and the levels of expression of the SHFM1, SLC25A13 and DLX5 genes from a lymphoblastoid cell line from the same individuals obtained.
Results
Variants found and clues about its function
he genomic region of FLJ42280 (28 kb) was massively resequenced in two DNA pools corr
The genomic region of FLJ42280 (28 kb) was massively resequenced in two DNA pools corresponding to the 50 women with the highest BMD and the 50 women with the lowest BMD of the BARCOS cohort (see details in Material and Methods above) at a high depth (about 3,600x per group). We compared the number and frequency of the variants found in each group. A total of 110 variants were identified, of which 18 were new and 59 were rare or low frequency variants (Table 2). It was observed that the number of low frequency variants between the two extreme groups was balanced. Likewise, it was observed that the frequency differences of all variants were below the statistical power of the design, although 9 showed a tendency.
For each variant, its overlap was analyzed with functional elements annotated in the genome by the ENCODE project. Four of the variants overlapped with possible transcription enhancing sequences (or enhancers) of osteoblasts and one of them [SNP rs4613908; MAF(CEU)=0.39] overlapped with an active enhancer in osteoblasts (Figure 3).

Figure 3 A) Schematic of the genomic region of FLJ42280 and location of some promising variants. Common variants are indicated in red and low frequency variants (LFV) or rare in gray.Blue squares represent enhancers of osteoblasts; The darker represents an active enhancer of the osteoblasts. B) Detail of active enhancer in osteoblasts. The sequence conservation profile in vertebrates, transcription factor binding sites and histone modifications are shown. These data were extracted from UCSC Genome Browser -GRCh37- and from ENCODE (data referred to osteoblasts)
Linkage disequilibrium analysis
The linkage disequilibrium among all variants common in this region was also studied. We plotted linkage disequilibrium (LD) using HaploView and haplotype information from the HapMap project (Figure 4) and noted that there is a large LD block that includes almost the entire gene (with the exception of the 3 'UTR region) And that by the upstream part of the gene extends 5 kb beyond the resequenced region. It was also found that the SNPs rs4613908 and rs4727338 (GWAs meta-analysis of Estrada et al. [7]) present a large linkage disequilibrium between them.

Figure 4 Graph of linkage disequilibrium present in the genomic region of FLJ42280.A large block (24 kb) is seen that includes much of the gene except its 3'UTR region. The 4 SNPs that have been associated with BMD in the various GWAs are marked with green ovals. The SNP overlapping with the active enhancer in osteoblasts is marked with a purple oval. The blue horizontal line indicates the resequenced genomic region in this study
eQTL Analysis
To complete the functional analysis, an eQTL analysis was carried out. Having the genotypes of the four SNPs associated with BMD, and the SNP rs4613908 of 210 individuals from the HapMap project and the levels of gene expression of a genomic array in lymphoblastoid lines from these same individuals, we determined whether the different alleles or genotypes Of the SNPs correlated with the levels of gene expression of the genes located in the genomic region of FLJ42280. None of the SNPs showed influence on the expression levels of the SHFM1, SLC25A13 or DLX5 genes (in the array there is no information on expression levels of FLJ42280). We also accessed the GTEx database to collect eQTL information for the same SNPs and the result was negative for all of them. Finally, we searched for regulatory annotations in HaploReg. This latter analysis confirmed that the sequence surrounding SNP rs4613908 is highly conserved among mammals and that in several cell types, including primary osteoblasts, contains chromatin markers typical of enhancer sequences (H3K4me1, H3K27ac). On the other hand, HaploReg highlighted alteration of regulatory motifs of this SNP and rs10429035, but showed no effect of these SNPs on gene expression.
Discussion
A comprehensive scan of a genomic region (28 kb) has been performed in 7q21.3 which contains several very strong association signals between 4 SNPs and bone mineral density [7,8,9]. It was wanted to know all the specific variants present in coding regions (exons of gene FLJ42280) and non-coding (introns, 3'UTR, 5'UTR and flanking gene) and to evaluate the functional potential of these variants to predict which of them could be responsible for the association with BMD. The variant rs4613908 has been shown to overlap with an active enhancer active in osteoblasts contained in a sequence with high evolutionary conservation. Said SNP (with its two allelic variants) could be affecting BMD by altering this gene enhancer. It remains to be determined which is the target gene of this enhancer.
To date, we have not found other studies which have addressed the functional basis of association with BMDs of SNPs located in non-coding regions of the FLJ42280 gene. In fact, this gene has been recently annotated in the human genome, so that when the association of the SNPs of the region was detected, the gene was still missing on the map of 7q21.3 and the SNPs were left between the genes SLC25A13 and SHFM1 (Figure 1). Therefore, Estrada et al. [7] proposed that the functionality of the association could be related to SLC25A13. Currently, FLJ42280 remains an annotated gene, with very few experimental data to confirm it. It is therefore very likely that the role of SNPs associated with BMD is related to other genes. In this sense, the SHFM1 gene has been associated with some hereditary cases of cleft hand-foot malformation (Split hand and foot malformation 1; OMIM #183600) and the DLX5 gene, below, is in fact the gene responsible for This disease, since there are patients with point mutations in DLX5 that co-occur with the disease [12]. A number of enhancers have been described that affect the expression of DLX5 in different tissues and stages of development and are distributed over several hundred kilo-bases. Studies in mice and zebrafish have characterized these enhancers and have been shown to function during development [13,14]. Some of them show tissue specificity and correlate with certain phenotypes present in patients with cleft-to-foot malformation carrying multiple chromosomal abnormalities (deletions or translocations) affecting the mentioned enhancers. By placing these DLX5 enhancers on the map of the 7q21.3 region, we have seen with surprise that the SNP rs4613908, which we have just commented as a good functional candidate, is in one of these enhancers (eDLX#18), located at 500 kb of DLX5. The eDLX#18 enhancer has been described as active in the gill arches in embryonic stages [13].
There is evidence that DLX5 is involved in the determination of BMD [15], suggesting that the eDLX#18 enhancer is also active as an enhancer for DLX5 in adult osteoblasts and that our SNP of interest is an eQTL in osteoblasts. It will be crucial to test this hypothesis by analysis of DLX5 expression in primary osteoblasts and genotyping of rs4613908 of the same.
Referencias
1 Johnell O, Kanis JA, Oden A, Johansson H, De Laet C, Delmas P, et al. Predictive Value of BMD for Hip and Other Fractures. J Bone Miner Res. 2005;20:1185-94. [ Links ]
2 Kanis JA, Oden A, Johnell O, Johansson H, De Laet C, Brown J, et al. The use of clinical risk factors enhances the performance of BMD in the prediction of hip and osteoporotic fractures in men and women. Osteoporos Int. 2007;18:1033-46. [ Links ]
3 Peacock M, Turner CH, Econs MJ, Foroud T. Genetics of Osteoporosis. Endocr Rev. 2002;23:303-26. [ Links ]
4 Deng HW, Chen WM, Recker S, Stegman MR, Li JL, Davies KM, et al. Genetic determination of Colles' fracture and differential bone mass in women with and without Colles' fracture. J Bone Miner Res. 2000;15:1243-52. [ Links ]
5 Hardy J, Singleton A. Genomewide Association Studies and Human Disease. N Engl J Med. 2009;360:1759-68. [ Links ]
6 Manolio TA. Genomewide Association Studies and Assessment of the Risk of Disease. N Engl J Med. 2010;363:166-76. [ Links ]
7 Estrada K, Styrkarsdottir U, Evangelou E, Hsu YH, Duncan EL, Ntzani E, et al. Genome-wide meta-analysis identifies 56 bone mineral density loci and reveals 14 loci associated with risk of fracture. Nat Genet. 2012;44,491-501. [ Links ]
8 Rivadeneira F, Styrkársdottir U, Estrada K, Halldórsson BV, Hsu YH, Richards JB, et al. Twenty bone-mineral-density loci identified by large-scale meta-analysis of genome-wide association studies. Nat Genet. 2009;41:1199-206. [ Links ]
9 Zhang LL, Choi HJ, Estrada K, Leo PJ, Li J, Pei YF, et al. Multistage genome-wide association meta-analyses identified two new loci for bone mineral density. Hum Mol Genet. 2014;23:1923-33. [ Links ]
10 Bustamante M, Nogués X, Enjuanes A, Elosua R, García-Giralt N, Pérez-Edo L, et al. COL1A1, ESR1, VDR and TGFB1 polymorphisms and haplotypes in relation to BMD in Spanish postmenopausal women. Osteoporos Int. 2007;18:235-43. [ Links ]
11 DePristo MA, Banks E, Poplin R, Garimella KV, Maguire JR, Hartl C, et al. A framework for variation discovery and genotyping using next-generation DNA sequencing data. Nat Genet. 2011;43:491-8. [ Links ]
12 Shamseldin HE, Faden MA, Alashram W, Alkuraya FS. Identification of a novel DLX5 mutation in a family with autosomal recessive split hand and foot malformation. J Med Genet. 2012;49:16-20. [ Links ]
13 Birnbaum RY, Everman DB, Murphy KK, Gurrieri F, Schwartz CE, Ahituv N. Functional characterization of tissue-specific enhancers in the DLX5/6 locus. Hum Mol Genet. 2012;21:4930–8. [ Links ]
14 Rasmussen MB, Kreiborg S, Jensen P, Bak M, Mang Y, Lodahl M, et al. Phenotypic subregions within the split-hand/foot malformation 1 locus. Hum Genet. 2016;135:345-57. [ Links ]
15 Ulsamer A, Ortuño MJ, Ruiz S, Susperregui AR, Osses N, Rosa JL, et al. BMP-2 Induces Osterix Expression through Up-regulation of Dlx5 and Its Phosphorylation by p38. J Biol Chem. 2008;283:3816-26. [ Links ]
Received: June 15, 2016; Accepted: December 15, 2016
 Esta obra está bajo una Licencia Creative Commons Atribución-NoComercial 3.0 Internacional.
