


Mi SciELO
 Servicios personalizados
Servicios Personalizados
Revista
Articulo
 texto en
  Inglés (pdf)
 Articulo en XML
 Referencias del artículo
 Enviar articulo por email
Indicadores
-
 Citado por SciELO
 -
 Accesos
Links relacionados
-
 Citado por Google
 -
 Similares en
SciELO
Similares en
SciELO -
 Similares en Google
Compartir

 Permalink
Revista de Osteoporosis y Metabolismo Mineral
versión On-line ISSN 2173-2345versión impresa ISSN 1889-836X
Rev Osteoporos Metab Miner vol.12 no.4 Madrid oct./dic. 2020 Epub 05-Abr-2021
https://dx.doi.org/10.4321/s1889-836x2020000400003
ORIGINALS
Fracture risk predictors of a postmenopausal female population by binary statistical procedure CART
1Ginecology Department. Guadalajara University Hospital. Guadalajara (Spain)
2Applied Oftalmobiology University Institute. Valladolid University. Valladolid (Spain)
3Internal Medicine Department. Our Lady of Sonsoles Hospital. Ávila (Spain)
4Internal Medicine Department. University Hospital Río Hortega. Valladolid (Spain)
5Primary Care Management. Salamanca (Spain)
6Department of Surgery, Ophthalmology, Otolaryngology and Physiotherapy. Faculty of Medicine. Valladolid University. Valladolid (Spain)
7Medicine Department. Clinical Toxicoloy Unit. Valladolid University. Valladolid (Spain)
8Internal Medicine Department. University Hospital Río Hortega. Valladolid University. Valladolid (Spain)
Objetivo
The main consequences of osteoporosis are fragility fractures, associated with high morbimortality. The prediction of these fractures can help identify the most-at-risk population and implement preventive measures. The aim of this study was to assess the usefulness of multiple factors in their prevention, comparing the bone mineral density (BMD), the calculation of absolute risk of fracture using the tool FRAX® in the presence and absence of BMD, and the clinical data.
Material and methods
An eight-year-duration longitudinal study was conducted on a postmenopausal female population, with and without osteoporosis. All of them were taken a standardised clinical history, spinal and hip BMD, and FRAX with and without BMD. Eight years later we identified the existent fractures. In addition to a parametric and non-parametric statistic in SPSS 21.1, we used the classification and regression tree (CART) method to assess possible interactions among fracture risk factors.
Results
We studied 276 postmenopausal patients whose average age at the beginning of the study was 61.08±8.43 years-old and had a body mass index (BMI) of 25.67±4.04. 56.5% of the patients (n=156) were diagnosed with osteoporosis before the beginning of our study, and all of them were treated. After eight years of follow-up, 72 patients (24.6%) suffered a fracture and 17 patients (6.2%) also suffered a second one. The results of the CART analysis showed that the main risk factor to suffer an osteoporotic fracture after 8 years of following up is having preceding fractures. Having a femoral neck BMD lower than 0.67 was the main risk factor among those with a previous fracture.
Conclusions
The use of a binary statistical procedure (CART) on a cohort of patients allow us identify those most at risk of fractures, according to clinical parameters and simple additional tests, in order to establish more effective therapeutic measures.
Key words osteoporosis; fracture; FRAX; bone mineral density; CART analysis
INTRODUCTION
The osteoporosis is an illness linked to a high morbimortality that increases as the population grows older. It has been defined as a systemic skeletal disease characterized by a deterioration of bone micro-architecture and a decrease of bone tissue, with a consequent increase in bone fragility and a higher susceptibility to fracture1. It is a clinically silent disease that is not manifested by other signs but for its complications, fractures.
The main consequences of osteoporosis are fragility fractures that can appear in different locations, though they typically happen on the vertebrae, distal radius and proximal extremity of the femur2,3. They are fractures with a high economic cost and are associated with a higher morbimortality, specifically those on the vertebrae and the proximal femur. Hip fracture mortality, the most serious manifestation of osteoporosis, is 8% during the first month after the fracture (acute mortality). It rises to 30% after a year4. Furthermore, the recovery of patients who do not pass away is poor. Only 30% of patients suffering a hip fracture return to the baseline situation5. The vertebral fracture shows a higher incidence than the hip fracture. While the hip fracture shows a yearly incidence of 1.3-1.9 cases/1,000 inhabitants/year, the incidence of vertebral fractures is 13.6/1,000 inhabitants/year in males and 29.3/1,000 inhabitants/year in females2. Although its mortality is lower than that of hip fracture, it is not despicable, especially in patients also presenting a respiratory disease6,7. Therefore treatments are designed to prevent its appearance through adequate therapeutic measures. In order to establish the most appropriate treatment it is necessary to dispose of stand-alone diagnostic factors that help identify the every patient’s individual risk through additional tests or risk scales.
Bone mineral density (BMD) has demonstrated an ability to predict fracture risk and also to prove the efficacy against fractures of different treatments8. This has been proven by a meta-analysis, although its usefulness in individual patients is less measurable9. Moreover, there are a high number of fractures whose BMD levels are in the range of osteopenia10.
Due to the current difficulty in some countries to carry out densitometries, different clinical procedures have been developed to establish fractures risks and indication of densitometry11. These procedures have not been clearly implemented owing to the development of the FRAX® tool, which is a risk scale sponsored by the World Health Organization consisting of a very simpleto-use computer tool whose risk has been adjusted by country. Its purpose is to identify the risk of fracture in men and women between 40 to 90 years12. However, it also poses problems by not including important fracture risk factors such as falls, the lack of definition of osteoporosis secondary causes or the corticosteroid dosing, the underestimation of osteoporotic major fracture risk in some populations and its invalidity on treated osteoporosis patients. On the other hand, simple clinical data reportedly have prediction ability comparable to that of the FRAX10.
The objective of this study, then, was to assess the fracture prediction ability of BMD, of the FRAX with or without BMD and of clinical data in an osteoporosis-treated female population and in a non-osteoporotic female population showing risk factors of the disease over an eight-year follow-up, by using the classification and regression tree method (CART). Its ultimate goal is to identify those patients with the highest risk of osteoporotic fracture.
PATIENTS AND METHODS
Patients
A retrospective and longitudinal study was conducted in postmenopausal women with suspected osteoporosis or with osteoporosis diagnosis. Inclusion criteria were: having amenorrhea the preceding twelve months, and osteoporotic diagnostic or diagnostic suspicion according the clinical criteria established by the National Osteoporosis Foundation Clinician’s Guide to Prevention and Treatment of Osteoporosis13. Exclusion criteria were: the absence of osteoporosis risk factors, the lack of monitoring data and not signing the written informed consent. All women were taken a standard clinical history including demographic data, lifestyle-related factors and prior diseases. Their height and weight were measured in order to get their body mass index (weight –kg-/height2 –m-). Baseline data were collected in 2011. All patients were calculated the FRAX with and without BMD. All their clinical histories were checked again in 2019. Clinical fractures were identified through the reports from the traumatology and emergency wards. In case of any doubt, X-rays were checked. Lateral spine X-rays were assessed in order to identify incidental fractures by applying the Genant criteria14.
Bone densitometry
To establish BMD, a densitometer DXA Prodigy® (GE Healthcare, Madison, Wisconsin, USA) was used following the manufacturer’s recommendations. BMD was carried out on the lumbar spine (L1-L4), femoral neck and total hip. The T-score was appraised using the values of normality for the Spanish population.
Statistical analysis
Continuous variables are expressed as median±standard deviation (SD), while categorical variables are expressed as absolute (n) and relative (%) frequencies. We used Chi-square test to compare the categorical variables. The Kolmogorov-Smirnov test was used to analyse the distribution of the variables.
The analysis of variance test was used to get parametric variables (ANOVA) while non-parametric variables were determined by the Mann-Whitney U test (two groups) or the Kruskal-Wallis test (more than two groups).
CART analysis was used to asses possible interactions among fracture risk factors statistically linked to having suffered a fracture after eight years of follow-up. CART analysis is a binary partitioning method which provides a graphic structure similar to a decision tree15. This allows the identification of subgroups of subjects with a higher risk of suffering an osteoporotic fracture. The pool of patients featuring the entire sample is classified in groups based on a dependent factor (in this case: patients who have suffered fractured vs. patients who have not suffered fracture). During the procedure, all possible independent factors (or variables) are examined and the factor that is more closely connected with regard to the dependent variable is selected. Then, two new groups are created (nodes). This partitioning process is repeated for each node and stops when there is no statistical association between a dependant variable and the rest of independent variables, or when the size of the group sample is small. The Bonferroni correction was applied to the CART analysis.
P values less than 0.05 were considered significant. All the analyses were carried out by means of the statistical package SPSS 22.0 (SPSS, Chicago, Illinois, USA).
Ethical aspects
The protocol complies with the Declaration of Helsinki (2008) by the World Medical Association. It was approved by the Ethics Committee of Río Hortega University Hospital (Valladolid, Spain) and is in line with Spain’s data protection law (LO 15/1999) and its specifications (RD 1720/2007). All patients who agreed to participate in the study signed a written consent.
RESULTS
Our work included the study and follow-up of 276 postmenopausal patients whose mean age at the start of the study was 61.08±8.43 years. The BMI was 25.67±4.04. Almost all the patients were Caucasian (n=274, 99.6%), only one patient was of South American ethnicity (0.4%). Regarding gynecological data, the age at menarche was 13.03±1.46 years and the age at menopause was 47.99±5.75 years. The patients had a mean of 2.07±1.3 children. 56.5% of the patients (n=156) were diagnosed with osteoporosis before the start of our study, and all of them were treated. After eight years of follow-up, 72 patients (24.6%) had suffered a fracture and 17 (6.2%) had also suffered a second fracture; 61 patients (22.1%) had suffered a fracture being over 55 years of age. The data for the global population are shown in table 1.
Tabla 1. General characteristics of the population included in this study
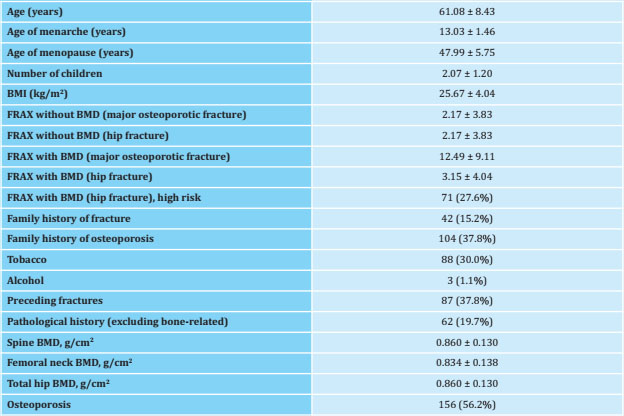
BMI: body mass index; BMD: bone mineral density. Data expressed as means ± standard deviation and absolute number (percentage).
There were 16 (8.6%) patients treated with thiazides, 32 (17.1%) with serotonin receptor inhibitors, 1 (0.5%) with androgen inhibitors, 8 (4.3%) with beta-blockers, 20 (10.7%) with thyroid hormones, 74 (27%) with antiresorptive agents, 4 (1.5%) with hormone replacement therapy, 11 (4%) with anabolic therapy, 25 (9%) with corticosteroids and 10 (3.6%) with strontium ranelate. Table 2 shows the characteristics of the included patients divided into two groups: patients with fractures occurred during the eight years of follow-up and patients without fractures.
Tabla 2. Clinical characteristics of the patients included in this study, comparing those who have suffered fragility fractures to those who have not
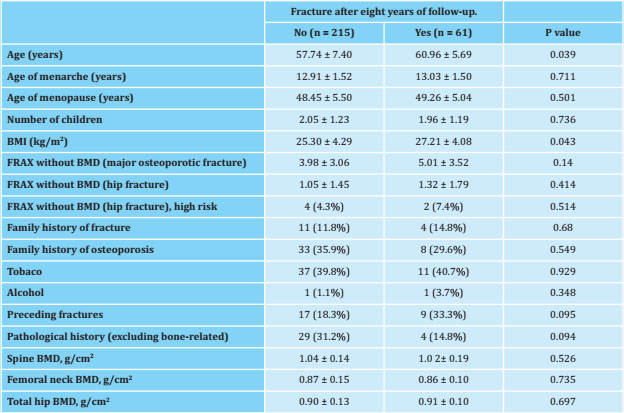
BMI: body mass index; BMD: bone mineral density. Data expressed as means ± standard deviation and absolute number (percentage).
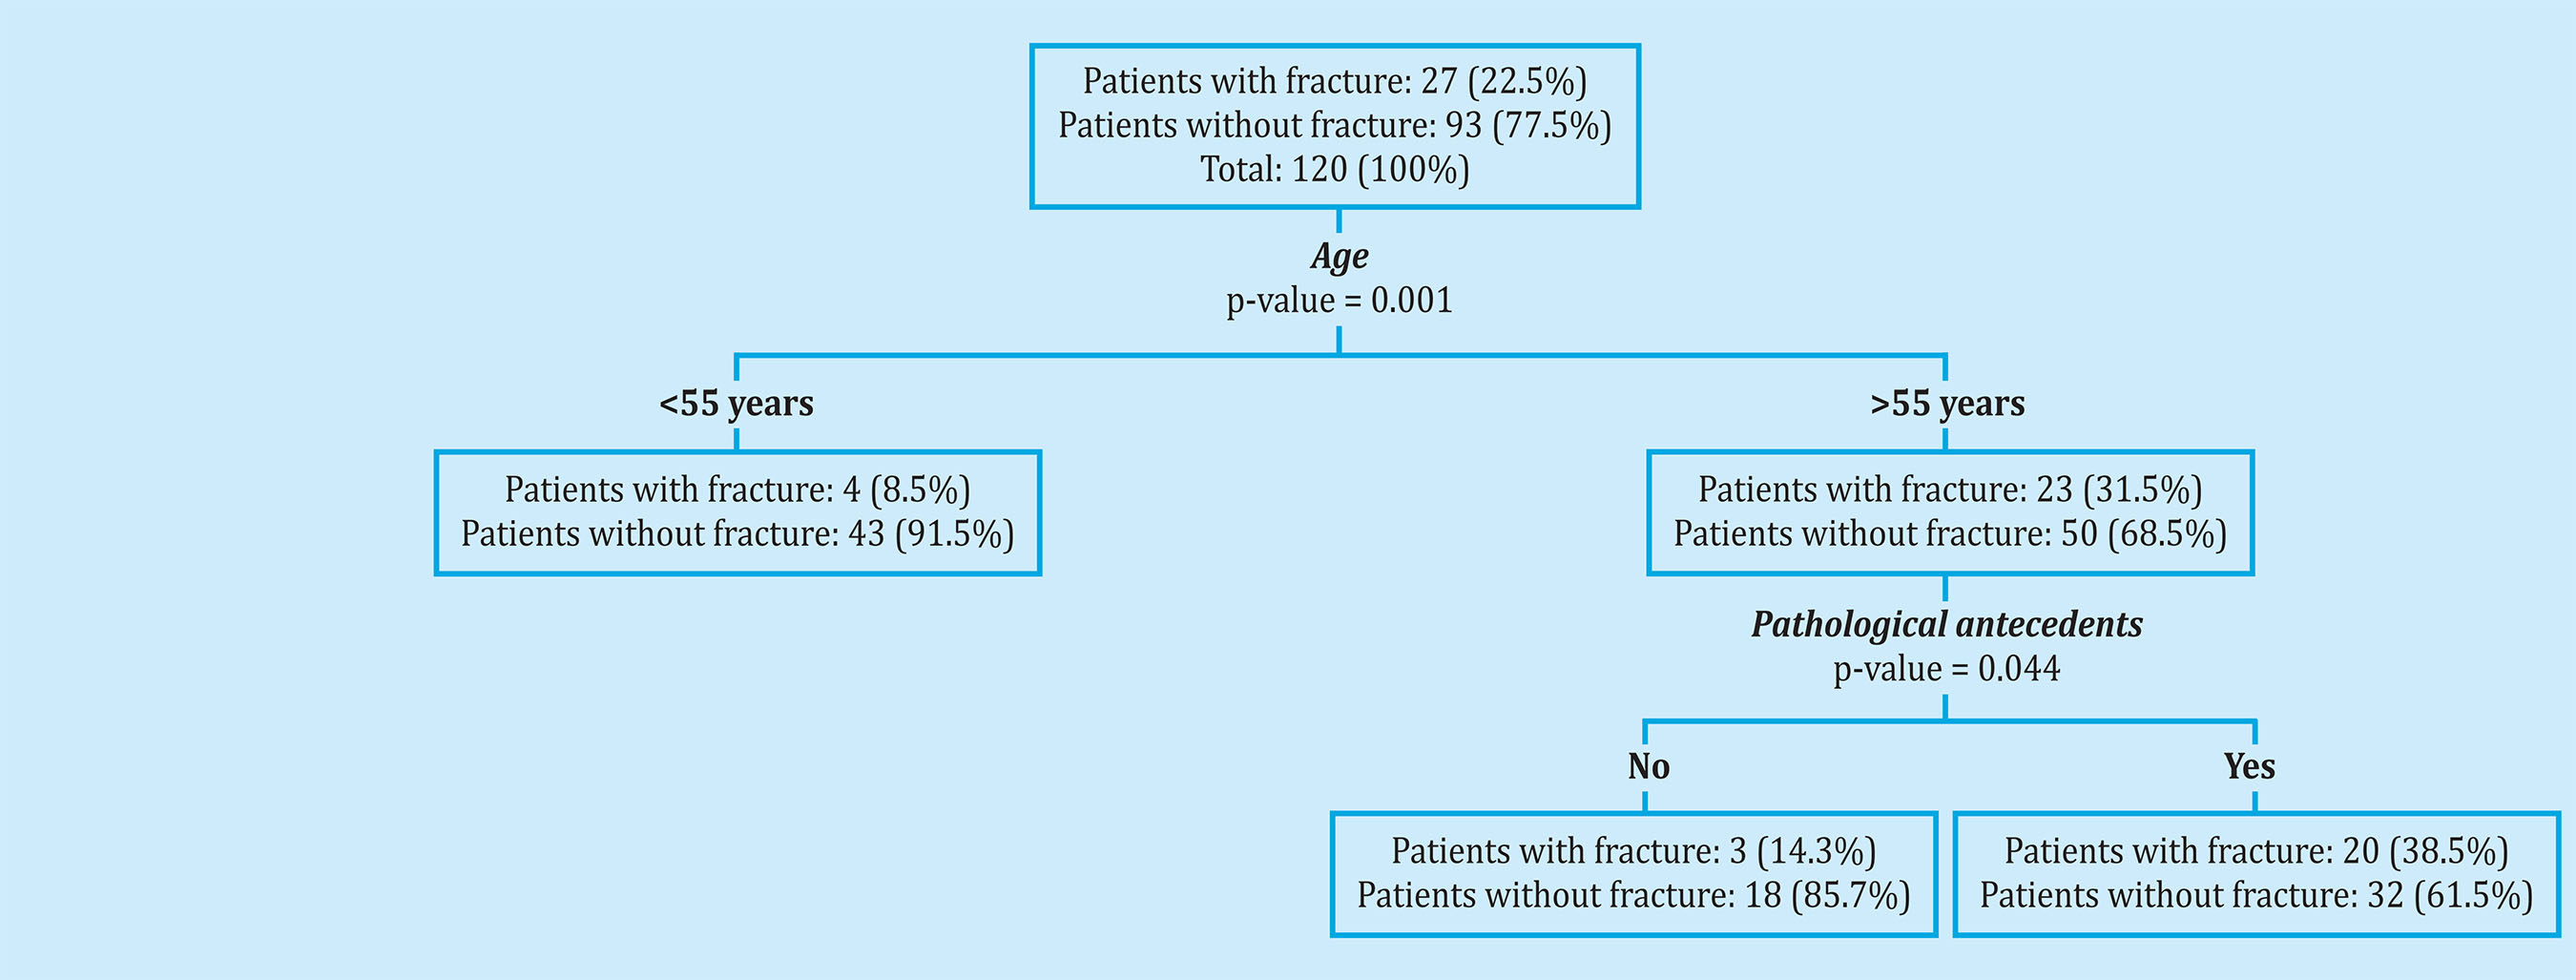
The results of the CART analysis showed that the main risk factor for suffering an osteoporotic fracture after 8 years of follow-up was having suffered previous fractures. Among patients who had suffered a previous fracture, having a femoral neck BMD less than 0.67 was the main risk factor. Among the patients who had not suffered previous fractures, the main risk factors were BMI and having a FRAX without BMD (major osteoporotic fracture) greater than 9.30 (Figure 1). Figure 2 shows the results of the CART analysis in patients diagnosed with osteoporosis. The main risk factors for suffering a fracture after 8 years of follow-up were having suffered previous fractures and presenting a BMD of the femoral neck less than 0.663. Among the patients who had not suffered previous fractures, the main risk factor was being over 67 years of age (Figure 2). Finally, the results of the CART analysis in patients not diagnosed with osteoporosis showed that the main risk factors for suffering an osteoporotic fracture were being over 55 years of age and having previously suffered the associated non-bonerelated disease, comorbidity (Figure 3).
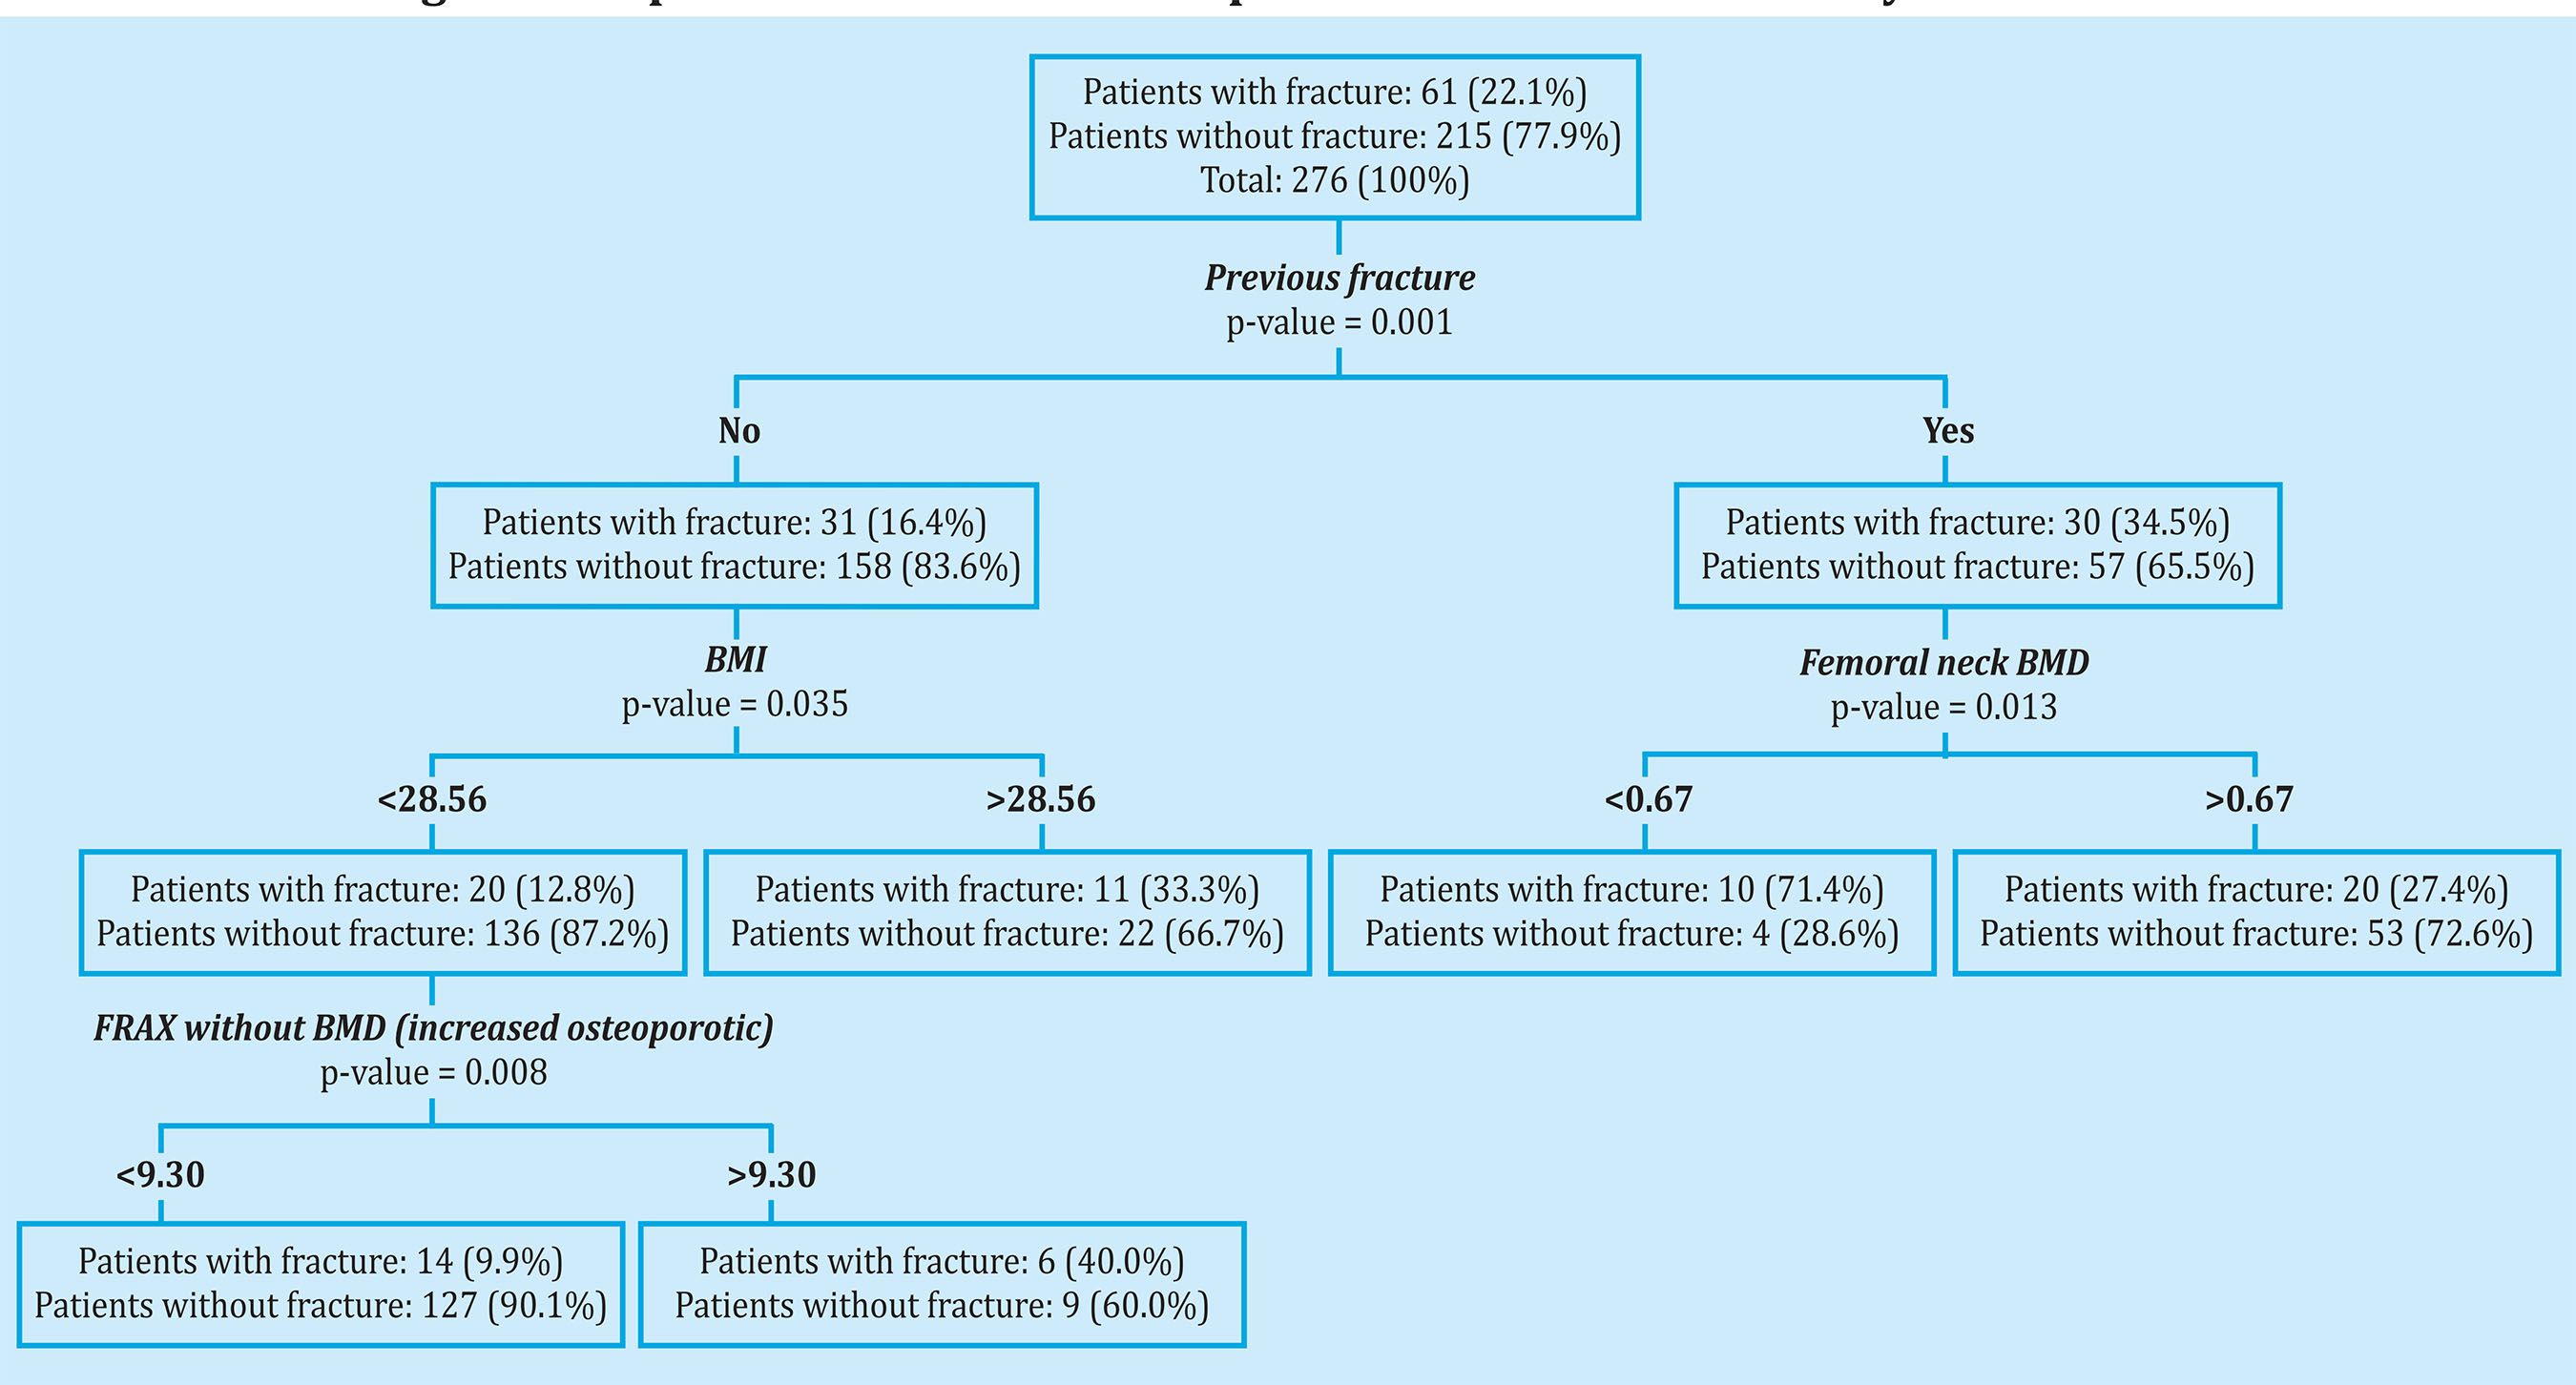
Figure 1. CART analysis (Classification and regression tree) in order to study the main risk factors associated with the risk of suffering an osteoporotic fracture in all the patients included in our study

DISCUSSION
In our study, the data that allow us to pin-point patients who have suffered an osteoporotic fracture during follow-up are the existence of a previous fracture, age, and FRAX with or without BMD. This last data loses part of its value in the CART analysis, which is why it is probably a marker of disease severity rather than a predictor in our series. In the CART analysis, which takes into consideration the factors that may influence the subsequent appearance of fractures, we witnessed that the key element for the total population is the existence of a previous fragility fracture supplemented with a BMD lower than 0.67 in the femoral neck, while in the absence of fractures, a BMI of 28 or lower and a FRAX for a major osteoporotic fracture above 9.3 would be the determining elements. In patients diagnosed with osteoporosis, under active treatment, the data are similar to those described for the general population except that, in those cases without a previous fracture, FRAX did not play any role in determining that 67 years of age is the distinguishing data. This is logical given that FRAX is of no use in treated osteoporotic patients. In patients without osteoporosis, the factor that determines the appearance of fractures is an age of over 55 years and the associated non-bone-related pathology, comorbidity.
The importance of secondary prevention is based on the fact that prior fractures constitutes the first determinant in the appearance of posterior fractures16,17. A high percentage of men and women are considered at high risk, which has been determined by a previous fracture and not diagnosed or treated18. This occurs for any fragility fracture location, being especially significant for vertebral and hip fracture. In the first case, in addition to the fracture itself, its severity according to Genant's classification and the number of fractures increase the risk19. Hip fracture is the most serious complication of osteoporosis, not only because of its ability to predict subsequent risk, but also because of its high morbimortality. Furthermore, in this case, BMD is a strong and consistent predictor of posterior fracture20. New studies carried out in real clinical practice to assess the efficacy of different treatments have shown that the increase in BMD is a determining factor in its efficacy reducing fractures21. In our study, the existence of a BMD in the femoral neck below 0.660 was a strong predictor consistent with these data. Another important factor in the appearance of new fractures is the time factor. This is where the concept of imminent risk of fracture has arisen, which is greater in the first two years after the fracture22,23. In a study carried out in a group that included 377,561 older women, the greatest risk of fracture was found to occur in the following 5 years, and especially frequent in the first two. These authors found that the determining factors were age, the location of the fracture and the associated bone disease24. In our study, this imminent risk and the location of the posterior fractures have not been determined. However, in patients not diagnosed with osteoporosis, age and associated pathology were present, coinciding with the data from this large series.
Age was another important risk factor in our CART analysis, especially in patients without prior osteoporosis and in patients with osteoporosis but without prior fracture. Numerous published studies have confirmed this fact. Ensrud et al. 25, in a group of 6,652 women and with a 10-year follow-up, concluded that models based on age and BMD, or on age and fractures, predicted risk in a similar way to FRAX. Similar data were obtained by Bolland et al.26 when comparing two scales, FRAX and Garvan, with age and BMD. In the Glow study, with 19,586 female participants over 60 years of age, it was observed that a model based on age and previous fractures was superior to FRAX and Q-Fracture without BMD27.
Another relevant fact of our study is the small role of FRAX in our CART analysis. We can see that the FRAX, both with BMD and without BMD, makes differences between the patients who do and do not fracture, but when conducting a statistical analysis based on algorithms, its value disappears. Only when analysing the total population, a FRAX for major osteoporotic fracture without BMD, higher than 9.3, has a role in patients without fracture. This FRAX value coincides with the FRAX thresholds established by Azagra et al.28 in their analysis of the Fridex cohort. These authors divided the patients into three groups, considering those with a FRAX greater than 10 as high risk. This may be due to several facts. In the Spanish population, FRAX underestimates the risk of major osteoporotic fracture. Several cohorts have tried to validate it by analyzing the differences between predicted and observed fractures29-31. The results can be considered acceptable in predicting the risk of hip fracture, but not for that of a major osteoporotic fracture, probably due to the lack of robust epidemiological data for this type of fracture. Comparing the FRAX with other simpler tests, including only age, has not shown a greater predictive ability32. Another fact of our study is that osteoporotic patients were receiving active treatment, therefore, it was not possible to validate FRAX in their cases.
Another noteworthy fact in non-osteoporotic patients is the importance of non-bone-related pathological records, comorbidity in the appearance of fractures. Unfortunately, there is no single approved index to assess fragility in clinical practice33. Some used indices have been associated with an increased risk of fractures34 and falls35. The Glow cohort and the CaMos cohort used different indices to assess the relationship between fragility and fractures, but both include many of the parameters assessed in our study. The variables of the Glow fragility fracture index included 15 items on comorbidity, 12 on basic activities of daily living (similar to the Barthel index), 6 items on signs and symptoms (fullness of life, energy, exhaustion, fatigue, non-intentional self-assessed pain/disconfort, weight loss). The fragility index used in the CaMos cohort included 30 items, 13 referring to pathology, 5 to functional aspects (vision, hearing, gait, manual dexterity/use of tools and cognition) and 12 to general health and daily activities. However, the Charlson index was not associated with the risk of fracture, although some studies, such as the SIDIAP registry, which included 186,171 men, found that a Charlson index ≥3 was linked to an increased risk of hip fracture36. The newest finding in this study is the use of the CART statistical methodology to establish the risk of posterior fracture in a heterogeneous population that included osteoporotic patients under active treatment and non-osteoporotic patients.
In conclusion, the use of a binary statistical procedure (CART) in a cohort of patients allows us to identify patients with a higher risk of fractures based on clinical parameters and complementary tests that are simple to carry out and establish more effective therapeutic measures.
Bibliografía
1 NIH Consensus Development Panel on Osteoporosis. Prevention, diagnosis and therapy. JAMA. 2001;285:785-95. [ Links ]
2 Felsenberg D, Silman AJ, Lunt M, Armbrecht G, Ismail AA, Fin HD, et al. Incidence of vertebral fracture in Europe: results from European Prospective Osteoporosis Study (EPOS). J Bone Miner Res. 2002;17:716-24. [ Links ]
3 Johnell O, Kanis J. Epidemiology of osteoporotic fractures. Osteoporos Int. 2005;16(Suppl ):S3-7. [ Links ]
4 Abrahamsen B, Van Staa T, Ariely R, Olson M, Cooper C. Excess mortality following hip fracture: a systematic epidemiologic review. Osteoporos Int. 2009;20:1633-50. [ Links ]
5 Dyer SM, Crotty M, Fairhall N, Magaziner J, Beaupre LA, Cameron ID, et al. A critical review of the long-term disability outcomes following hip fracture. BMC Geriatrics. 2016;11:158. [ Links ]
6 Center JR, Nguyen TV, Schneider N, Sambrook PN, Eisman JA. Mortality alter all major types of osteoporosis fracture in men and women: an observational study. Lancet. 1999;353:87882. [ Links ]
7 Cauley JA, Thompson DE, Ensrud KC, Scott JC, Black D. Risk of mortality following clinical fractures. Osteoporos Int. 2000;11:556-61. [ Links ]
8 Black DM, Rosen CJ. Postmenopausal Osteoporosis. N Engl J Med. 2016;374: 254-62. [ Links ]
9 Lyu H, Jundi B, Xu C, Tedeschi SK, Yoshida K, Zhao S, Nigwekar SU, et al. Comparison of denosumab and bisphosphonates in patients with osteoporosis: A meta-analysis of randomized controlled trials. J Clin Endocrinol Metab. 2019;104:1753-65. [ Links ]
10 Siris ES, Brenneman SK, Barret-Connor E, Miller PD, Sajjan S, Berger ML, et al. The effect of age and bone mineral density on the absolute, excess and relative risk of fracture in postmenopausal women aged 50-99: results from the National Osteoporosis Risk Assessment ( NORA ). Osteoporos Int. 2006;17:565-74. [ Links ]
11 Perez-Castrillón JL, Sagredo MG, Conde R, Del Pino-Montes J, De Luis D. OST risk index and calcaneus bone densitometry in osteoporosis diagnosis. J Clin Densitom. 2007;10:404-7. [ Links ]
12 Kanis JA, Johansson H, Harvey NC, McCloskey EV,. A brief history of FRAX. Arch Osteoporos. 2018;13:118. [ Links ]
13 Cosman F, de Beu SJ, LeBoff MS, Lewiecki EM, Tanner B, Randall S, et al. National Osteoporosis Foundation clinician’s guide to prevention and treatment of osteoporosis. Osteoporos Int. 2014;25:2359-81. [ Links ]
14 Genant HK, Li J, Wu CY, Shepherd JA. Vertebral fractures in osteoporosis: a new method for clinical assessment. J Clin Densitom. 2000;3:281-90. [ Links ]
15 Breiman L, Friedman J, Olshen R, Stone C. Classification and Regression Trees. 1st ed. Wadsworth International Group, Belmont, California; 1984. [ Links ]
16 Klotzbuecher CM, Ross PD, Landsman PB, Abbott TA, Berger M. Patients with prior fracture have an increased risk of future fractures: a summary of the literature and statisticaly synthesis. J Bone Miner Res. 2000;15 721-9. [ Links ]
17 Pinedo-Villanueva R, Charokopou M, Toth E, Donnelly K, Cooper C, PrietoAlhambra D, et al. Imminent fracture risk assessments in the UK FLS setting: implications and challenges. Arch Osteoporos. 2019;14:12. [ Links ]
18 Vestergaard P, Rejnmark L, Mosekilde L. Osteoporos Int. 2005;16:134-41. [ Links ]
19 Johnell O, Kanis JA, Oden A, Sernbo I, Redlund-Johnell I, Petterson C, et al. Fracture risk following an osteoporotic fracture. Osteoporos Int. 2004;15:175-9. [ Links ]
20 Black DM, Cauley JA, Wagman R, Ensrud K, Fink HA, Hillier TA. The ability of a single BMD and fracture history assessment to predict fracture over 25 years in postmenopausal women: The Study of Osteoporotic Fractures. J Bone Miner Res. 2018;33:389-95. [ Links ]
21 Abrahamsen A, Ernst MT, Smith CD, Nybo M, Rubin KH, Prieto-Alhambra D, et al. The association between renal function and BMD response to bisphosphonates treatment: Real-world cohort study using linked national registers. Bone. 2020;137:115-371. [ Links ]
22 Johansson H, Siggeirsdottir K, Harvey NC, Oden A, Gudnason V, McCloskey E, et al. Imminent risk of fracture after fracture. Osteoporos Int. 2017;28:775-80. [ Links ]
23 Schnell A, Curtis JR, Saag KG. Importance of recent fracture as predictor of imminent fracture risk. Curr Osteoporos Rep. 2018;16:738-45. [ Links ]
24 Balasubramanian A, Zhang J, Chen L, Wenkert D, Daigle SG, Grauer A, et al. Risk of subsequent fracture after prior fracture among older women. Osteoporos Int. 2019;30:79-92. [ Links ]
25 Ensrud KE, Lui LY, Taylor BC, Schousboe JT, Donaldson MG, Fink HA, et al. A comparison of prediction models for fractures in older women: is more better? Arch Intern Med. 2009;169:2087-94. [ Links ]
26 Bolland MJ, Siu AT, Mason BH, Horne AM, Ames RW, Grey AB, et al. Evaluation of the FRAX and Garvan fracture risk calculators in older women. J Bone Miner Res. 2011;26:420-7. [ Links ]
27 Sambrook PN, Flahive J, Hooven FH, Boonen S, Chapurlat R, Lindsay R, et al. Predicting fractures in an international cohort using risk factor algorithms without BMD. J Bone Miner Res. 2011;26:2770-7. [ Links ]
28 Azagra R, Roca G, Martin-Sanchez JC, Casado E, Encabo G, Zwart M, et al. Umbrales de FRAX para identificar personas con alto o bajo riesgo de fractura osteoporótica en población femenina española. Med Clin (Barc). 2015;144:1-8. [ Links ]
29 Tebe C, Del Rio LM, Di Gregorio S, Casas L, Estrada MD, Kotzeva A, et al. Validation of the FRAX predictive model for major osteoporotic fracture in a historical cohort of Spanish women. J Clin Densitom. 2013;16:231-7. [ Links ]
30 Gonzalez-Macías J, Marín F, Vila J, Diez-Perez A. Probability of fractures predicted by FRAX and observed incidence in the Spanish ECOSAP Study cohort. Bone. 2012;50:373-7. [ Links ]
31 Azagra R, Roca G, Encabo G, Aguye A, Zwart M, Guell S, et al. FRAX tool, the WHO algorithm to predict osteoporotic fractures: the first analysis of its discriminative and predictive ability in the Spanish FRIDEX cohort. BMC Musc Disord. 2012;13:204. [ Links ]
32 Rubin KH, Abrahamsen B, Friis-Holmberg T, Hjelmborg JV, Bech M, Hermann AP, et al. Comparison of different screening tools ( FRAX, OST, ORAI, OSIRIS, SCORE and age alone ) to identify women with increased risk of fracture. A population-based prospective study. Bone. 2013;56:16-22. [ Links ]
33 De Vries N, Staal J, Van Ravensberg C, Hobbelen J, Olde Rikkert M, NijhuisVan der Sanden M. Outcome instruments to measure frailty: a systematic review. Ageing Res Rev. 2011;10:104-14. [ Links ]
34 Li G, Ioannidis G, Pickard L, Kennedy C, Papaioannou A, Thabane L, et al. Frailty index of deficit accumulation and falls: data from the Global Longitudinal Study of Osteoporosis in Women (GLOW) Hamilton cohort. BMC Musculoskelet Disord. 2014;15:185. [ Links ]
35 Kennedy C, Ioannidis G, Rockwood K, Thabane L, Adachi J, Kirkland S, et al. Frailty index predicts 10-year fracture risk in adults age 25 years and older: results from the Canadian Multicentre Osteoporosis Study ( CAMOS). Osteoporos Int. 2014;25:2825-32. [ Links ]
36 Reyes C, Estrada P, Nogues X, Orozco P, Cooper C, Diaz-Perez A, et al. The impact of common co-morbidities (as measured using the Charlson index) on hip fracture in elderly men: a population-based cohort. Osteoporos Int. 2014;25:1751-8. [ Links ]
Received: November 10, 2020; Accepted: December 22, 2020
 Este es un artículo publicado en acceso (Open Access) abierto bajo la licencia Creative Commons Attribution Non-Commercial, que permite su uso, distribución y reproducción en cualquier medio, sin restricciones siempre que sin fines comerciales y que el trabajo original sea debidamente citado.
