


 Serviços customizados
 Inglês (pdf)
 Artigo em XML
 Referências do artigo
 Enviar este artigo por email
 Citado por SciELO
  Citado por Google
  Similares em
SciELO
Similares em
SciELO  Similares em Google
 Permalink
INTRODUCTION
The sport of rowing can be divided into two subtypes, both of which require specific physiological characteristics, and have significant performance differences. The first type, Olympic rowing, is performed on calm and reservoir waters over a distance of 2,000m. In contrast, traditional rowing occurs on rough sea waters with 13 rowers per crew and a coxswain1,2, whose goal is to complete a 5,556m (3 nautical miles) regatta in the shortest possible time. In both types of rowing data has revealed glycolysis to be the primary energy system in use1,2.
During a traditional rowing regatta simulation, average power output has been reported to be 250 (7) W, while rowers are simultaneously competing at 110.26 (4.48)% above the individual anaerobic threshold3. In accordance, blood lactate concentrations have been reported to reach high levels following a race (10–18mmol/L)1,2. However, post-race blood lactate concentration is position-dependent in that athletes closest to the stern of the boat (i.e. stroke seats) have higher concentrations of lactate3. Furthermore, an elite boat can reach an average speed of 4.63m/sec, which is achieved by a frequency of 36-40strokes/min throughout the course of a 20-minute regatta1. Additionally, the drive time (blade submerged in the water), is about 1.50–1.66sec/stroke3, depending on the stroke style (i.e. primarily arms or back). Consequently, a rower’s physical dimensions and anthropometrics must be taken into account since the natural physical demands of rowing performance are substantial. In fact, anthropometric parameters have been correlated with performance in elite sport, and anthropometric characteristics have been associated with Olympic rowing performance outcomes4. For instance, data has shown that a taller rower with high lean body mass may be advantageous due to a longer lever arm (i.e. force arm > resistance arm)3,4, resulting in greater power output per stroke.
Body composition (BC), especially a rower’s fat mass (FM), fat-free mass (FFM) and muscle mass (MM), may also affect performance5,6. Excessive FM in a rower, in particular, would act as deadweight, and would have adverse effects on speed, resulting in a diminished ability to accelerate7. Moreover, it is well established that greater FFM and MM in a high-intensity athlete leads to increased strength and endurance; thus, performance improvement8. Moreover, anthropometric characteristics in junior age groups affect their long-term careers, underlining the relevance of anthropometric assessments and their consideration for talent identification and development programs in rowing9.
There are many sports possessing anthropometric profiles and defined body compositions such as volleyball10 and basketball11, enabling athletes to opt for maximum performance. Along these lines, Pons et al., have defined the anthropometric characteristics, body compositions and somatotypes of Spanish athletes from different specialties who have participated in the Olympics over the last 25 years12. Hence, references for 24 sports are available in Spain with their specialties or categories, including Olympic rowing, enabling nutritionists and trainers to guide both diet and training so as to achieve the body composition allowing athletes to attain maximum performance. However, there is no study examining the anthropometrical profile of traditional rowers in an elite boat –and its relationship to performance– which allows coaches and sport scientists to better understand the physical profile of elite rowers, and formulate appropriate training strategies13. Therefore, the aims of this study are to describe elite traditional rowers’ anthropometric characteristics (BC, FM, MM, and somatotype) in order to establish reference values within this population of rowers.
MATERIAL AND METHODS
Sample
The “asociación de clubs de traineras (ACT)” league consists of 12 boats, each with 20 rowers. In this respect, for the cross-sectional design of this study, data was collected from the twenty male traditional rowers (29.3 (3.6) years) in the first division’s winning crew, considered the best team over the past 5 years, participating in this study (experience ≥6 years). They all performed the same supervised training 7 days a week for 2–3h/day. Every rower received both oral and written information regarding the research objectives, and all rowers provided written consent prior to participation. This study met the requirements of the II Declaration of Helsinki and was approved by the UPV-EHU ethics committee.
Experimental Design
In order to undergo the anthropometric measurements, the participants reported to the laboratory on a single day at the beginning of the competitive season. All anthropometric measurements were performed in compliance with the International Society of Advancement of Kinanthropometry (ISAK) protocol14 by the same international level-2 certified anthropometrist.
Height (cm) was measured using a SECA 220 measuring rod (Hamburg, Germany), with precision to within 1mm. Body Mass (BM) (kg) was measured using SECA 700 scales to within 0.1kg. Body Mass Index (BMI) was calculated using the BM/height2 (kg/m2) equation. Skinfolds (mm) (tricipital, bicipital, abdominal, suprailium, subscapular, iliac crest, front thigh, and calf) were analyzed using the Holtain skinfold caliper, with precision to within 0.2mm. In order to obtain several observations, the sum of 4 (∑4SF), 6 (∑6SF) and 8 (∑8SF) skinfolds (mm) were examined following validated procedures12. Muscle perimeters (cm) (arm, contracted arm, waist, hips, thigh and calf muscles) were assessed using a metal, non-extensible tape (Lufkin) with precision to within 1mm. All perimeters were corrected via skinfolds by using the following formula: corrected perimeter=perimeter–(∏ x skinfold area). Such corrections provide the best information regarding musculoskeletal size in each body zone15. Humeral and femoral diameters were measured with a Holtain pachymeter, accurate to within 1mm.
FM and body fat percentage (BF%) were calculated using the Carter, Withers, Yuhasz and Faulkner equations as they have already been recommended for athletes in the Spanish Kinanthropometry Group (GREC)16,17. Similarly, MM and MM% were calculated using the Lee equation16,17. The Carter and Heath equation18 was used to obtain somatotype values.
Statistical Analysis
All anthropometric data is presented as mean (standard deviation). The minimum and maximum values of the anthropometric measurements, BC and somatotype were calculated similarly. Statistical data analysis was carried out using the SPSS software package for Windows, version 21.0. (SPSS, Inc., Chicago, IL, USA).
RESULTS
The descriptive data for all variables is displayed in 2 tables. Specifically, Table 1 shows the basic anthropometric values, such as BM (80.4 (6.3) kg; range: 71.0–88.5kg), height (182.5 (5.2) cm; range: 174.0–190.5cm), and BMI (24.1 (1.3) kg/m2; range: 21.6–27.3kg/m2). Special attention has been paid to wingspan values (188.6 (5.8) cm; range: 178.0–198.0cm) due to their association with performance in traditional rowing. Similarly, Table 1 displays all perimeters, some of which have been corrected by their respective skinfolds in order to calculate muscle mass using the Lee equation; such as corrected arm perimeter (28.4 (1.6) cm; range: 26.1–31.3cm), corrected thigh perimeter (50.4 (2.6) cm; range: 45.6–56.0cm) and corrected calf perimeter (36.6 (2.6) cm; range: 31.8–41.6cm). Moreover, Table 1 shows all skinfolds and the sum of them. Thus, the ∑4SF was 33.7 (7.1) mm (range: 20.4–53.0mm), ∑6SF was 51.5 (11.4) mm (range: 31.5–72.8mm) and ∑8SF was 67.3 (15.6) mm (range: 42.1–99.2mm). Finally, Table 1 presents bone diameters, where the humerus was 7.1 (0.4) (range: 6.2–7.6) and femur was 10.3 (0.5) (range: 9.4–11.2).
Table 1. Basic anthropometric parameters, perimeters, skinfolds and bony diameters (n=20).
| Mean (SD) | Maximum | Minimum | |
|---|---|---|---|
| BASIC ANTHROPOMETRIC PARAMETERS | |||
| Body Mass (kg) | 80.4 (6.3) | 88.5 | 71.0 |
| Height (cm) | 182.5 (5.2) | 190.5 | 174.0 |
| Wingspan (cm) | 188.6 (5.8) | 198.0 | 178.0 |
| BMI (kg/m2) | 24.1 (1.3) | 27.3 | 21.6 |
| PERIMETERS (cm) | |||
| Relaxed arm | 30.8 (1.6) | 33.9 | 28.1 |
| Flexed arm | 34.7 (1.7) | 38.0 | 31.9 |
| Waist | 80.6 (3.3) | 86.3 | 71.8 |
| Hip | 96.0 (4.6) | 102.0 | 84.5 |
| Thigh | 53.8 (2.5) | 58.0 | 48.1 |
| Calf | 38.8 (2.5) | 43.0 | 33.1 |
| Corrected arm perimeter | 28.4 (1.6) | 31.3 | 26.1 |
| Corrected waist perimeter | 77.1 (3.2) | 68.8 | 82.5 |
| Corrected thigh perimeter | 50.4 (2.6) | 56.0 | 45.6 |
| Corrected calf perimeter | 36.6 (2.7) | 41.6 | 31.8 |
| SKINFOLDS (mm) | |||
| Biceps | 3.4 (0.6) | 4.35 | 2.5 |
| Triceps | 7.5 (1.3) | 9.5 | 5.8 |
| Subscapular | 9.0 (1.6) | 12.6 | 5.8 |
| Abdominal | 11.1 (3.7) | 20.6 | 4.5 |
| Suprailium (Iliac crest) | 6.1 (1.9) | 12.3 | 3.5 |
| Iliac crest | 12.5 (5.2) | 27.6 | 5.1 |
| Front thigh | 10.9 (3.5) | 17.2 | 5.3 |
| Calf | 6.9 (3.4) | 15.5 | 3.4 |
| Σ4SF | 33.7 (7.1) | 53.0 | 20.4 |
| Σ6SF | 51.5 (11.4) | 72.8 | 31.5 |
| Σ8SF | 67.3 (15.6) | 99.2 | 42.1 |
| DIAMETERS (cm) | |||
| Humerus | 7.1 (0.4) | 7.6 | 6.2 |
| Femur | 10.3 (0.5) | 11.2 | 9.4 |
BMI: Body Mass Index; Σ4SF: Sum of four skinfolds; Σ6SF: Sum of six skinfolds; Σ8SF: Sum of eight skinfolds.
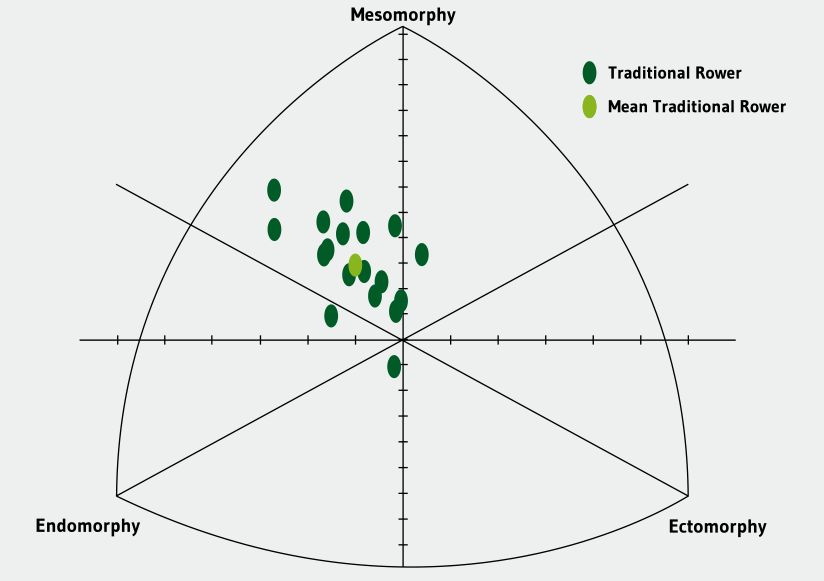
Table 2 presents BF%, FM, MM%, and MM (kg) as calculated using different specific equations and the somatotype. BF% was thereby between 8.0 (1.2)% using the Carter equation, 10.9 (1.1)% using the Faulkner equation, 8.6 (1.1)% using the Yuhasz equation and 9.9 (2.0)% according to the Withers equation. Table 2 also shows MM% using the Lee equation (43.3 (2.4)%; range: 39.4–47.8%). Regarding somatotype, the somatotype values were: endomorphy (3.5 (0.4); range: 2.7–4.4), mesomorphy (4.7 (0.6); range: 3.4–5.7), ectomorphy 2.4 (0.6); range: 0.8–3.5). This data revealed that elite traditional rowers can be classified as endo-mesomorphs (Figure 1).
Table 2. Participants’ body composition and somatotype (n=20)
| Mean (SD) | Maximum | Minimum | |
|---|---|---|---|
| BODY COMPOSITION | |||
| Carter body fat (%) | 8.0 (1.2) | 10.2 | 5.9 |
| Carter FM (kg) | 6.4 (1.1) | 8.6 | 4.3 |
| Withers body fat (%) | 9.9 (2.0) | 13.4 | 6.1 |
| Withers FM (kg) | 8.0 (1.8) | 11.3 | 4.5 |
| Yuhasz body fat (%) | 8.6 (1.1) | 10.7 | 6.7 |
| Yuhasz FM (kg) | 7.0 (1.2) | 9.1 | 4.9 |
| Faulkner body fat (%) | 10.9 (1.1) | 13.9 | 8.9 |
| Faulkner FM (kg) | 8.8 (1.2) | 12.1 | 6.5 |
| Lee MM (%) | 43.3 (2.4) | 47.8 | 39.4 |
| Lee MM (kg) | 34.7 (3.1) | 41.4 | 29.5 |
| SOMATOTYPE | |||
| Endomorphy | 3.5 (0.4) | 4.4 | 2.7 |
| Mesomorphy | 4.7 (0.6) | 5.7 | 3.4 |
| Ectomorphy | 2.4 (0.6) | 3.5 | 0.8 |
FFM: Fat-Free Mass; FM: Fat Mass.
DISCUSSION
This is the first study analyzing the anthropometric characteristics of elite traditional rowers. Firstly, a mean height of 182cm and a mean BM of 80.4kg in elite rowers were observed. The present findings are similar to those of Mujika et al.19, who reported an average height of 186cm and BM of 80.4kg in 14 elite rowers. Similarly, Izquierdo-Gabarren et al.1 found 24 elite rowers to have the following measurements: height=182cm and BM=82.4kg compared to 22 amateurs with measurements of: height=182.1m and BM=80.2kg. Interestingly, a wide range of height and BM was observed: 178–198cm and 71–88.5kg respectively, suggesting that different anthropometric compositions may be needed within specific crew positions. Specifically, hydrodynamic reasons20 may lead to varying height and BM requirements among the 13 rowers in a crew in order to balance the boat through rough seas1. In Olympic rowers, however, data has reported wider ranges for height (187.2–194cm) and BM (85.8–97.2kg)21 22 23-24 than the present investigation pertaining to traditional rowers. These higher values in Olympic rowers have also been a positive indicator of performance25 26-27. Hence, traditional rowers may not need as much height and BM as Olympic rowers possibly due to the fact that traditional rowing relies more on the arms and less on torso bending and leg extension compared to Olympic rowing20.
Moreover, since the arms are a primary factor throughout the traditional rowing stroke, it is essential to assess wingspan as it is paramount to anthropometric parameters during the course of each stroke20. An average wingspan of 189cm was now observed, representing a mean difference of 7cm compared to height. In contrast, data has reported that Olympic rowers have longer wingspans (193.4–200.6cm)22,23,27, which represents only a 4–6cm difference in relation to height. It could be speculated that the legs may not fully complete flexion and extension throughout the course of each stroke in traditional rowing, thus allowing for a shorter wingspan compared to Olympic rowing despite there being greater reliance on the arms.
A 28.4cm perimeter of the corrected relaxed arm and a 36.6cm calf perimeter (Table 1) were observed, which is lower than the corrected values reported by Kerr et al.21 (arm: 31.1cm; calf: 37.3cm) in Olympic rowers and non-corrected values reported by Mikulic22,23 (arm: 33.9–35cm; calf: 40.1–40.3cm). Consequently, the data reveals that traditional rowers do not possess muscle mass to the same extent as Olympic rowers, which may be advantageous owing to the significant muscular endurance requirements of traditional rowing. Similarly, and in agreement with Kerr et al.21, a small hip perimeter (96cm) was observed, which is common in both types of rowing due to the use of narrow boats. The long, narrow shape of the hull is designed to minimize forward motion drag21, and a small hip perimeter allows the athlete to fit suitably into this narrow shape.
Regarding BF%, previous research has observed a higher BF% (12.3%) in elite traditional rowers1 than any of the values obtained in this study. Additionally, Mikulic reported a 15.9% BF% in 14 international Olympic rowers and 13.2% BF% in 25 elite Croatian rowers23, both of which are higher than the present values. Moreover, this value can change during the season28,29. Along the same lines, Spanish Olympic rowers, depending on their category (lightweight or heavyweight), presented a BF% of 11.1 (1.1)% (Faulkner), 6.9 (1.2)% (Yuhasz), 11.9 (1.8)% (Faulkner) and 14.7 (3.2)% (Yuhasz) respectively12. However, it is difficult to compare these values as several body composition equations are often used, yielding an array of results (Table 1). In accordance with other authors16, the sum of skinfolds is used to analyze and establish normative data and to compare studies. In fact, Kerr et al.21 presented a ∑8SF from 140 elite rowers during the Sydney 2000 Olympics, resulting in a mean value of 65.3mm, which is indeed comparable to the present ∑8SF values of 67.3mm. Ultimately, a low BF% is desirable for rowers because, especially in longer distances24, an excess of FM can affect propulsion negatively, causing diminished speed and acceleration, which results in increased energy demand30.
With regard to muscle mass, there are indications that this is responsible for providing power and speed to the rowers’ rowing motion. In this respect, there are no references with which to draw comparisons since many authors include fat-free mass, which not only includes muscle but also bones, organs, minerals, blood, etc., leading to a possible overestimation of the amount of muscle mass16. However, somatotype provides information regarding the general physical shape of an athlete, which provides insight into the general desired shape for specific sports16. Somatotype analysis in the current study revealed that elite traditional rowers can be categorized as endo-mesomorphic (Figure 1), in that the rowers possess only moderate musculoskeletal development with moderate relative adiposity16. In contrast, Kerr et al. demonstrated a somatotype classification of ecto-mesomorphs (moderate musculoskeletal development, and low subcutaneous adiposity) in Olympic rowers21. Although the endomorph value in the present study is much higher than in the previous study21, this is more likely due to the specific sites where somatotype is calculated; in that it is probable these sites are leaner in Olympic rowers vs. traditional rowers due to the greater strength and lower endurance demands of Olympic rowing. In support of this hypothesis, the ∑8SF was similar in the two investigations; therefore, even though somatotype is a valuable tool, it may overestimate body composition in the present population owing to the body sites from which somatotype is obtained.
The main limitation here is that the sample cannot be regarded as representative of the ACT because a specific sample calculation was not performed. However, it is important to indicate that the club studied was champion of the ACT league as well as the winner of “La bandera de la Concha”; the competition outside the most important rowing league. Therefore, the present values could be used as normative values for elite traditional rowers to structure training in order to achieve a desired anthropometric composition.
CONCLUSIONS
Wingspan seems to be of great importance for elite traditional rowers; the height may not be as important for performance as wingspan, and a low body fat percentage is likely to be beneficial in order to achieve elite rowing status. Ultimately, the elite traditional rower’s somatotype is endo-mesomorph, suggesting that muscle endurance is a prominent factor in traditional rowing and, considering its importance in relation to training periodization, training programs should be designed accordingly. However, caution should be taken when interpreting the present results, as more research is needed to determine the exact relationships between the anthropometric profile and specific performance outcomes in elite traditional rowers.

